doi:10.1351/pac200678112003 © 2006 IUPAC
Tetranucleotides as a scaffold for diporphyrin
arrays*
Imenne Bouamaied
1, Leslie-Anne Fendt
1, Markus Wiesner
1,
Daniel Häussinger
1, Nicolas Amiot
1, Sandra Thöni
1, and
Eugen Stulz
1,2,‡1Department of Chemistry, University of Basel, St. Johanns-Ring 19, 4056 Basel, Switzerland;2School of Chemistry, University of Southampton, Highfield,
Southampton SO17 1BJ, UK
Abstract: The incorporation of porphyrin-substituted nucleosides into tetranucleotides using
phosphoramidite chemistry on solid support is reported. Both diphenyl and tetraphenyl por-phyrin nucleosides were used as building blocks. This method allows the synthesis of chiral homo- and heteroporphyrinic arrays, where the composition and thus the physical properties of the array can be modulated simply by reprogramming the DNA synthesizer. The porphyrin arrays are initially isolated in the free-base form. Remetallation to give the zinc-porphyrins can be achieved using standard procedures in solution. The UV–vis spectra of the arrays are reproducible by a superposition of the absorbance spectra of the individual porphyrins, indi-cating an undisturbed electronic ground state of the porphyrins in the arrays. The same is true for the steady-state emission spectra of the homoporphyrinic arrays, which are not influenced by the presence of the nucleotide strand. In the mixed porphyrin arrays, large differences in the excited-state properties compared to an equimolar mixture of the building blocks are ob-served by means that the emission of the diphenyl porphyrin moiety is quenched to a large extent, and the overall emission is dominated by the tetraphenyl porphyrin. The covalent con-nection of the porphyrins via the DNA-derived backbone therefore substantially alters the ex-cited-state and energy-transfer properties of mixed porphyrin systems. The circular dichro-ism (CD) spectra show induced negative cotton effects in the region of the porphyrin B-band absorption, which is due to the attachment of the chromophores to the chiral oligonucleotide backbone. Addition of a complementary tetra-adenosine did not alter any of the spectro-scopic properties, neither in chloroform nor in acetonitrile solutions. Therefore, it can be con-cluded that no duplex is formed, which is corroborated by 1H NMR spectroscopy.
Keywords: porphyrin; modified nucleotides; phosphoramidite; heteroporphyrinic arrays;
homoporphyrinic arrays; energy transfer.
INTRODUCTION
The use of materials derived from biological sources has gained attention in the past years as an alter-native environmentally benign source as compared to the traditional chemical manufacturing processes. Protein aggregation, programmed DNA assembly, and biomineralization processes may lead to new
*Paper based on a presentation at the Second International Symposium on Green/Sustainable Chemistry, 10–13 January 2006, Delhi, India. Other presentations are published in this issue, pp. 1971–2050.
derived building blocks and methods, e.g., based on readily available heme and polymerase chain reac-tion (PCR) for DNA amplificareac-tion.
The synthesis of multiporphyrin arrays has advanced to the point where a very large diversity of building blocks and supramolecular complexes thereof are accessible. Major interests in these con-structs are in the imitation of the antenna complex of the natural photosynthetic system [2], in enzyme mimics [3,4], and in the design and synthesis of new molecular electronic [5] and photonic [6] devices. The strategies employed to build the porphyrin arrays use either direct covalent connection [7–11], a metal-to-ligand complexation approach [12–15], or noncovalent hydrogen-bonding patterns [16–19]. Covalent connection strategies have the disadvantage that the relative composition of the overall array is rather static, meaning that the exchange of individual building blocks within the array may demand a complete redesign and resynthesis of the supramolecular array. To introduce supramolecular chirality in the arrays may also not easily be achieved.
Only very recently, DNA has become attractive as a supramolecular scaffold to produce nanoscaled entities [20–26]. The double-stranded DNA (dsDNA) has been used because of its high se-lectivity in recognition through base-pairing to specifically connect nanoparticles [25,27–29], in DNA chip technology and nanolithography [30], to create nanomechanical devices [22], or to construct pro-tein arrays and nanowires [31]. In this context, the use of substituted nucleotides is a very recently emerging field of research, where the dsDNA is designed to act as a template for the creation of func-tional molecules [32–39]. For example, DNA strands that were post-modified with porphyrins gave ac-cess to branched assemblies [40,41]. However, to date the DNA has not been used to synthesize a multi-functional molecule, where a variety of different electronically active substituents were incorporated site-specifically into the DNA strand, especially not using porphyrins as functional entities.
On our route to the use of dsDNA as a template for multiporphyrin arrays, we have studied the utility of solid-phase DNA synthesis to create homo- and heteroporphyrinic diporphyrin arrays. Based on our synthetic methodology to porphyrin-substituted nucleosides, the phosphoramidites 1 and 2 (Scheme 1) [42,43] were used as building blocks and were successfully incorporated into the tetra-nucleotides 3 to 5 on solid support using an automated DNA synthesizer. This provides a new synthetic route to porphyrin arrays, where the composition of the array and thus its physical properties can be changed easily. To compare the properties of the diporphyrin arrays with the individual porphyrins (i.e., to gain insight into the influence of the nucleotide backbone), the trinucleotides 6 and 7 were prepared as well.
SYNTHESIS OF THE TRI- AND TETRANUCLEOTIDE PORPHYRIN ARRAYS
The phosphoramidite building blocks 1 and 2 were obtained from the DMT-protected porphyrin nu-cleotides and isolated in 70 to 85 % yield according to the methods described earlier [42,43]. Dichloromethane (DCM) solutions (20 mM) of the building blocks were prepared and used for the syn-thesis of the porphyrin-oligonucleotides 3 to 7 in an automated DNA synthesizer in standard mode (trityl on) on a 15-µmol scale; the coupling time for the modified building blocks was increased to 15 min. Cleavage from the solid support was achieved with a mixture of 25 % ammonium hydroxide and methanol at 40 °C over night. Due to the low solubility of 3 in this solvent mixture, a second treat-ment of the solid support was necessary using 25 % ammonium hydroxide and dioxane 1:1 at 40 °C overnight. The crude products were purified on lipophilic sephadex (LH 20, DCM-MeOH 1:1). The yields of the final products as free-base porphyrins H2-3 to H2-7 were in the range of 30 to 45 %.
Analysis of the products using matrix-assisted laser desorbtion/ionization time-of-flight (MALDI-TOF) mass spectrometry showed the expected m/z peaks for porphyrin arrays as shown in Fig. 1 for the di-porphyrins H2-3 to H2-5. Remetallation of the porphyrin arrays to the zinc derivatives Zn-3 to Zn-7
was performed using the standard methods for porphyrin metallation with zinc acetate in DCM-methanol. Excess zinc salts were removed on lipophilic sephadex. The absorbance and emission spectra were determined using chloroform solutions of 2.5 ×10⁻⁶M and 2.3 ×10⁻⁸M concentration, Scheme 1 Solid-phase synthesis of the tri- and tetranucleide porphyrin arrays. M = 2H or Zn. DMT = 2,2'-dimethoxy trityl; DPP = diphenyl porphyrin; TPP = tetraphenyl porphyrin.
respectively. The concentrations used for the circular dichroism (CD) spectroscopy were variable and are indicated in Fig. 4. The 1H NMR spectra were recorded either in CDCl3(0 or 10 mM TBA-PF6) or CD3CN using a 600 MHz Bruker NMR spectrometer as 8.4 ×10⁻⁴M solutions. All solvents were de-gassed and filtered through basic alumina prior to preparing the samples. All oligonucleotides were sol-uble under the conditions indicated, and no aggregation was observed in any experiment.
UV–VIS SPECTROSCOPY
The spectra obtained from the free-base trinucleotides 6 and 7 containing one of the porphyrins are identical to the spectra of either diphenyl porphyrin (H2DPP H2-8) or tetraphenyl porphyrin (H2TPP
H2-9). The presence of the DNA backbone therefore does not influence the absorbance of the
por-phyrins, and no electronic interactions between the chromophores and the nucleobases occur, as was al-ready observed in the porphyrin nucleotide building blocks [42].
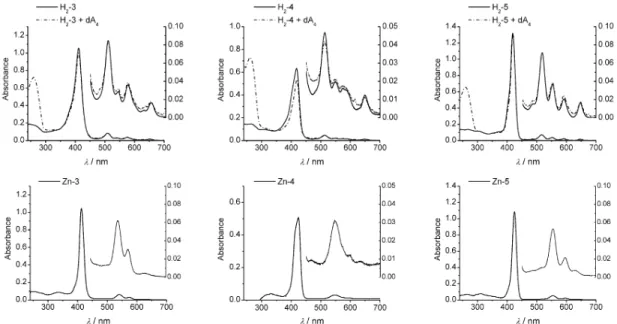
In contrast to the dinucleotide-diporphyrin arrays described earlier [43], the spectra obtained from the tetranucleotides can be reproduced by a superposition of the spectra of either the individual build-ing blocks or the trinucleotide arrays. The UV–vis absorbance spectra of the diporphyrin arrays H2-3, H2-4, and H2-5 are shown in Fig. 2 (top). The absorbance maxima λmax(logε) of the porphyrinic ab-sorptions in the arrays are compiled in Table 1. The B-band absorbances are 411 nm (5.62) for H2-3,
418 nm (5.40) for H2-4, and 419 nm (5.72) for H2-5, which are expected values for porphyrins. The
four Q-band absorbances can be found in the 450 to 700 nm region, which is typical for free-base por-phyrins. Upon addition of the complementary tetra-adenosine dA4the absorbances remain largely un-changed apart from a small hypochromism in the array H2-4 (Fig. 2). Apparently, no change in the
elec-tronic environment is induced by addition of the tetra-adenosine.
The corresponding zinc derivatives Zn-3, Zn-4, and Zn-5 (Table 1) show maxima for the B-band absorbances, which are red-shifted only marginally in 3, and by about 6 nm in 4 and 5 compared to the free-base porphyrins (the spectra are displayed in Fig. 2, bottom). This shift difference is a common value for zinc-metallated porphyrins; the values found are 413 nm (5.32) for Zn-3, 424 nm (4.76) for
Zn-4, and 425 nm (5.48) for Zn-5. Again, upon addition of the complementary tetra-adenosine, no
sig-nificant change in the electronic spectra could be observed (data not shown). The electronic ground state of the porphyrins, therefore, is not altered when incorporated into the oligonucleotide, nor is it influ-enced by the absence or presence of the complementary strand. Excitonic coupling does not occur be-cause unhindered rotation around the internucleosidic linkage seems to prevent a close contact between the porphyrin units.
Fig. 1 MALDI-TOF mass spectra of the free-base diporphyrin arrays. Calculated values [M-1]–1are 3407.13 for H2-3, 3054.53 for H2-4, and 2701.60 for H2-5.
Table 1 UV–vis absorbance data for the diporphyrin arrays 3 to 5. Data are recorded in CHCl3, c = 2.5×10⁻⁶M, T = 25 °C.
B-band absorption Q-band absorptions
H2-3 412 (5.30) 510 (4.21) 541 (3.81) 576 (3.88) 652 (3.53) Zn-3 413 (5.32) 540 (4.10) 574 (3.78) H2-4 418 (4.75) 513 (3.63) 544 (3.49) 575 (3.37) 648 (3.20) Zn-4 424 (4.76) 545 (3.13) 598 (3.68) H2-5 419 (5.38) 516 (4.15) 553 (3.96) 592 (3.75) 646 (3.63) Zn-5 425 (5.48) 555 (4.08) 596 (3.51) H2-6 417 (4.79) 509 (3.30) 544 (3.43) 575 (3.08) H2-7 418 (4.86) 515 (3.76) 552 (3.57) 591 (3.39) 645 (3.28)
STEADY-STATE EMISSION SPECTROSCOPY
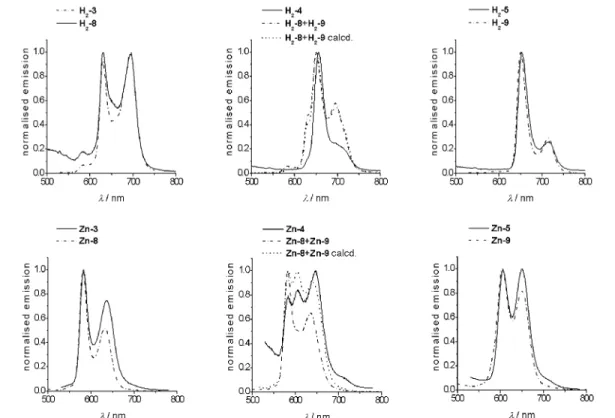
The steady-state emission spectra of the diporphyrin systems when irradiated at 420 nm show emission maxima between 600 and 750 nm, which are characteristic for the fluorescence from the first singlet excited state S1 of porphyrins. In Fig. 3, the normalized spectra are shown for the diporphyrin arrays as well as for the individual porphyrins. There are no differences in the shape of the spectra of all the homo-porphyrin oligonucleotides when compared to the fluorescence of the model free-base porphyrins diphenyl porphyrin 8 and tetraphenyl porphyrin 9 alone or the combination of 8 and 9. Comparison with the mono-porphyrin trinucleotides shows that the presence of the DNA backbone also has no influence on the excited-state behavior of the porphyrins (data not shown). Some differences in the relative in-tensities of the emission bands are detectable in the zinc-metallated arrays.
The mixed porphyrin arrays H2-4 and Zn-4, on the other hand, behave very differently compared
to a mixture of the building blocks. Both the shape and the relative intensities of the normalized spec-tra do not correspond to a simple superposition of either the porphyrin building blocks or the tri-nucleotide porphyrin systems.
In an equimolar mixture of the free-base porphyrins H2-8 and H2-9, the spectrum corresponds
well to a superposition of the emission spectra of the individual porphyrins (dash-dotted lines in Fig. 3), whereas in the case of the zinc-metallated porphyrins Zn-8 and Zn-9, the spectrum is domi-nated by the emission of the diphenyl porphyrin Zn-8. It should be noted that the relative intensity of the emission of the two porphyrins is almost equal in the free-base form, but in the zinc-metallated form, the tetraphenyl porphyrin has an emission intensity which is about 25 % of that of the diphenyl porphyrin.
In H2-4 and Zn-4, the contribution of the tetraphenyl porphyrin seems much more enhanced. In H2-4, the spectrum is very close in shape to the spectrum of H2TPP, which indicates that the emission of the DPP part is greatly diminished. Here, also, the calculated spectrum that is obtained from the nor-malized spectra of H2-8 and H2-9 represents the spectrum of the equimolar porphyrin mixture rather
than of the diporphyrin array H2-4. Similarly, for Zn-4, the emission spectrum is very different from
the spectrum of an equimolar mixture of the porphyrins. The emission of the DPP porphyrin does not seem to be completely quenched, but the contribution of the TPP part is significantly enhanced. The spectrum actually is very close to the calculated spectrum obtained from the normalized emission spec-tra of Zn-8 and Zn-9. It can, therefore, be assumed that in the arrays an energy spec-transfer from the DPP to the TPP part occurs, which increases the emission of the tetraphenyl porphyrin and quenches the emission of the diphenyl porphyrin. Since this effect is not detected in a mixture of the porphyrins at this low concentration, the enforced close proximity of the two chromophores through the oligo-nucleotide backbone leads to an intramolecular electronic communication between the porphyrins. Fig. 3 Normalized steady-state emission spectra of the free-base (top) and zinc-metallated (bottom) porphyrin arrays.
Table 2 Steady-state emission data for the diporphyrin arrays 3 to 5. Data are recorded in CHCl3, c = 2.3×10⁻⁸M, T = 25 °C.
λmax(rel. intensity) H2-3 630 (0.92) 695 (1) Zn-3 582 (1) 636 (0.75) H2-4 655 (1) 704 (sh) Zn-4 583 (0.78) 605 (0.84) 646 (1) H2-5 653 (1) 716 (0.24) Zn-5 606 (0.99) 650 (1) H2-6 631 (1) 691 (0.75) Zn-6 582 (0.58) 656 (1) H2-7 651 (1) 715 (0.22) Zn-7 602 (1) 648 (0.98)
CIRCULAR DICHROISM SPECTROSCOPY
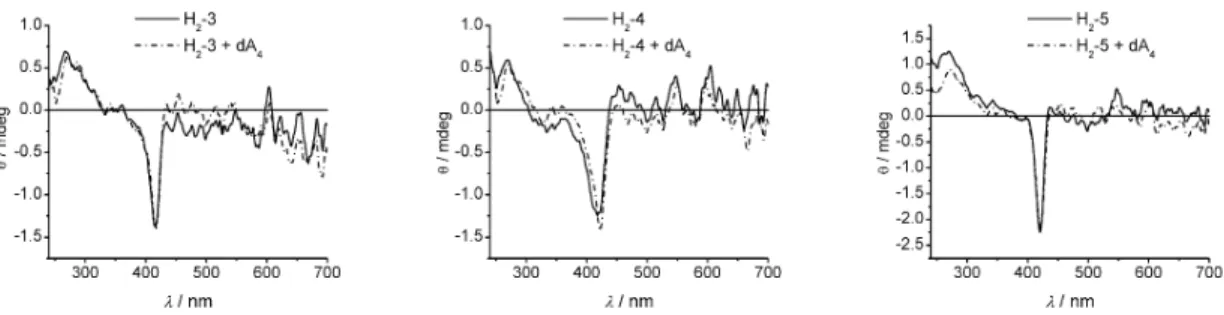
The arrays were analyzed by CD spectroscopy in order to determine whether structural changes upon dimerization with the complementary tetra-adenosine occur. Induced CD-spectroscopy has become a valuable tool for determining changes in the helicity of oligonucleotides, and the porphyrins provide a chromophore allowing the subtle detection of changes in the supramolecular chirality [44–50]. The CD spectra of the arrays H2-3 to H2-5 are shown in Fig. 4. The UV regions of the CD spectra do not show
clear features, thus the spectra do not indicate highly ordered structures with respect to the oligo-nucleotide backbone.
Regarding the B-band region of the porphyrins, all three complexes show a similar signature in their spectra. The single-strand arrays show an induced negative cotton effect at 416, 424, and 420 nm for H2-3, H2-4, and H2-5, respectively. The values for λmaxare red-shifted by 1 to 6 nm compared to the B-band absorbances of the arrays. A negative cotton effect in DNA-porphyrin complexes is nor-mally observed upon intercalation of cationic porphyrins into G-C rich sequences [49,50]. In the ab-sorbance spectra, neither hypochromism nor a bathochromic shift is observed for any of the arrays as compared to the building blocks, which would be expected if strong π-interactions with the nucleobases upon intercalation would occur. The negative cotton effect can thus be explained by an induced chiral-ity from the oligonucleotide backbone of the diporphyrin array. Noteworthy, the CD signal is strongest for the array 5, where also a sharp signal was observed. The signal of 3 is slightly broadened with a de-creased intensity compared to 5. The broadest and also weakest induced signal is observed in the array
4. Upon addition of the complementary tetra-adenosine, the spectra did not change.
Fig. 4 CD spectra of the free-base porphyrin arrays. Spectra are recorded in CHCl3(T = 25 °C) at c = 5 ×10⁻⁶M (H2-3), 13.4 ×10⁻⁶M (H
mentary strand, we studied the tetranucleotides by H NMR spectroscopy. The arrays were dissolved, and the complementary strand was added until equimolar amounts were present. Either neat CDCl3 so-lutions or 10 mM TBA-PF6solutions in CDCl3were used. However, no changes in the 1H NMR spec-tra were observed upon addition of the complementary sspec-trand, which is shown in Fig. 5a with the array
H2-3 as representative example. Further experiments were performed using both the unmodified
tetra-thymidine and tetra-adenosine (Figs. 5b–d). The spectrum of the equimolar mixture of dT4and dA4is a superposition of the individual 1H NMR spectra. No changes in the resonances assigned to the sugar-phosphate backbone or in the nucleobase region were seen. Also, no low-field resonances were detected at ~10–15 ppm, which would be expected for the nucleobase protons when they are integrated into an A-T hydrogen-bonding system [52]. The spectra of the natural oligo-nucleotides were also measured under different conditions, e.g., in both CDCl3and CD3CN solutions, and in the presence and absence of the noncoordinating buffer TBA-PF6, leading to the same results. Also, heating to 80 °C for 2 h and slow-cooling to room temperature to simulate the annealing of natural DNA did not have any influence on the outcome of the spectra. The same applies for recording the spectra at 5 °C. We therefore con-clude that the interactions between the two complementary tetranucleotides in organic solvents are very weak even in unmodified oligonucleotides where the steric repulsion from the bulky porphyrins is not present.
Fig. 5 Region of the 1H NMR spectra of the tetranucleotides: (a) H2-3 + dA4, (b) dT4, (c) dA4, (d) dT4+ dA4. The spectra shown are recorded in CDCl3(10 mM TBA-PF6) for (a) and in CD3CN for (b–d). c = 8.4 ×10⁻⁴M, T = 22 °C.
There is no spectroscopic evidence for the formation of any duplex with the complementary tetra-adenosine; this is also supported by the fact that the 1H NMR spectra of the mixtures are represented by a superposition of the individual 1H NMR spectra under very different conditions. Even though a strong interaction between the base-pairs would have been expected to occur in organic solvents, based on the reported A-T and G-C pairing in CHCl3and DCM, this is obviously not the case in the tetra-nucleotides. Since the lack of interaction is already present in the unmodified nucleotides, steric hin-drance arising from the bulky porphyrin units can be ruled out. To date, information on the behavior of DNA in organic solvents is very limited, but it was found that single-chain DNA undergoes compaction and thus a dramatic conformational change when the dielectric permittivity of the solvent is <46. The compaction of a single DNA molecule when the dielectric permittivity constant is lowered is thought to be due to the increased importance of ion-ion correlation when the electrostatic interactions are in-creased [53]. In our case, the dielectric permittivity is much lower (4.8 for CHCl3), therefore, electro-static interactions become even more important. In protic solvents such as ethanol, glycerol, or ethyl-ene glycol, the DNA duplex retains its structure though melts at a significantly lower temperature [54]. On the other hand, dimethyl sulfoxide (DMSO), methanol, and formamide did not support the duplex structure. However, these solvents are known to strongly interfere with hydrogen-bonding patterns, therefore, this cannot be directly correlated to our system where the hydrogen bondings are not expected to be disturbed. The use of noncoordinating counter-ions such as tetrabutyl ammonium or tri-ethyl am-monium may, therefore, lead to an electrostatic repulsion between the phosphate groups that prevents duplex formation. In any case, if our finding of the absence of a duplex in weakly polar aprotic solvents extends to longer DNA still needs to be shown.
We are currently probing the use of PNA as neutral complementary strand to obtain more infor-mation on possible duplex forinfor-mation. Also, more detailed analyses of the excited-state electronic prop-erties are under way to fully understand the nature of the electronic interactions between the chromo-phores.
ACKNOWLEDGMENTS
This work was supported by the Swiss National Science Foundation and by the Treubel-Foundation Basel, which are gratefully acknowledged.
REFERENCES
1. M. Gross. Chem. World 2, 25 (2005).
2. D. Furutsu, A. Satake, Y. Kobuke. Inorg. Chem. 44, 4460 (2005). 3. W. D. Woggon. Acc. Chem. Res. 38, 127 (2005).
4. D. M. Vriezema, M. C. Aragones, J. Elemans, J. Cornelissen, A. E. Rowan, R. J. M. Nolte. Chem.
Rev. 105, 1445 (2005).
5. S. D. Straight, J. Andreasson, G. Kodis, S. Bandyopadhyay, R. H. Mitchell, T. A. Moore, A. L. Moore, D. Gust. J. Am. Chem. Soc. 127, 9403 (2005).
6. L. Schmidt-Mende, W. M. Campbell, Q. Wang, K. W. Jolley, D. L. Officer, M. K. Nazeeruddin, M. Grätzel. ChemPhysChem 6, 1253 (2005).
7. D. Holten, D. F. Bocian, J. S. Lindsey. Acc. Chem. Res. 35, 57 (2002).
8. A. L. Kieran, S. I. Pascu, T. Jarrosson, M. J. Gunter, J. K. M. Sanders. Chem. Commun. 1842 (2005).
9. J. R. Dunetz, C. Sandstrom, E. R. Young, P. Baker, S. A. Van Name, T. Cathopolous, R. Fairman, J. C. de Paula, K. S. Akerfeldt. Org. Lett. 7, 2559 (2005).
10. M. Fujitsuka, A. Okada, S. Tojo, F. Takei, K. Onitsuka, S. Takahashi, T. Majima. J. Phys. Chem.
B 108, 11935 (2004).
11. M. Fujitsuka, M. Hara, S. Tojo, A. Okada, V. Troiani, N. Solladie, T. Majima. J. Phys. Chem. B
109, 33 (2005).
12. U. Michelsen, C. A. Hunter. Angew. Chem., Int. Ed. 39, 764 (2000).
13. E. Stulz, S. M. Scott, A. D. Bond, S. J. Teat, J. K. M. Sanders. Chem. Eur. J. 9, 6039 (2003). 14. E. Iengo, E. Zangrando, E. Alessio, J. C. Chambron, V. Heitz, L. Flamigni, J. P. Sauvage. Chem.
Eur. J. 9, 5879 (2003).
15. I. Bouamaied, T. Coskun, E. Stulz. In Structure & Bonding, E. Alessio (Ed.), pp. 1–48, Springer, Heidelberg (2006).
16. M. J. Gunter. In Structure & Bonding, E. Alessio (Ed.), pp. 263–295, Springer, Heidelberg (2006). 17. V. Kral, S. L. Springs, J. L. Sessler. J. Am. Chem. Soc. 117, 8881 (1995).
18. A. Berman, E. S. Izraeli, H. Levanon, B. Wang, J. L. Sessler. J. Am. Chem. Soc. 117, 8252 (1995). 19. J. L. Sessler, B. Wang, A. Harriman. J. Am. Chem. Soc. 117, 704 (1995).
20. M. A. Batalia, E. Protozanova, R. B. MacGregor Jr., D. A. Erie. Nano Lett. 2, 269 (2002). 21. E. T. Kool. Acc. Chem. Res. 35, 936 (2002).
22. Y. Benenson, R. Adar, T. Paz-Elizur, Z. Livneh, E. Shapiro. Proc. Natl. Acad. Sci. USA 100, 2191 (2003).
23. L. H. Eckardt, K. Naumann, W. Matthias Pankau, M. Rein, M. Schweitzer, N. Windhab, G. von Kiedrowski. Nature 420, 286 (2002).
24. S. A. Davis, E. Dujardin, S. Mann. Curr. Opin. Solid State Mater. Sci. 7, 273 (2003). 25. M. Li, S. Mann. J. Mater. Chem. 14, 2260 (2004).
26. B. Giese, E. Meggers, S. Wessely, M. Spormann, A. Biland. Chimia 54, 547 (2000). 27. C. A. Mirkin. Inorg. Chem. 39, 2258 (2000).
28. M. L. Sauthier, R. L. Carroll, C. B. Gorman, S. Franzen. Langmuir 18, 1825 (2002). 29. Z. Li, R. C. Jin, C. A. Mirkin, R. L. Letsinger. Nucleic Acids Res. 30, 1558 (2002).
30. K. Keren, M. Krueger, R. Gilad, G. Ben-Yoseph, U. Sivan, E. Braun. Science 297, 72 (2002). 31. H. Yan, S. H. Park, G. Finkelstein, J. H. Reif, T. H. LaBean. Science 301, 1882 (2003). 32. O. Thum, S. Jager, M. Famulok. Angew. Chem., Int. Ed. 40, 3990 (2001).
33. T. Gourlain, A. Sidorov, N. Mignet, S. J. Thorpe, S. E. Lee, J. A. Grasby, D. M. Williams. Nucleic
Acids Res. 29, 1898 (2001).
34. D. J. Hurley, Y. Tor. J. Am. Chem. Soc. 124, 3749 (2002).
35. S. I. Khan, A. E. Beilstein, G. D. Smith, M. Sykora, M. W. Grinstaff. Inorg. Chem. 38, 2411 (1999).
36. S. I. Khan, A. E. Beilstein, M. W. Grinstaff. Inorg. Chem. 38, 418 (1999). 37. K. P. Guido, H. Clever, T. Carell. Angew. Chem., Int. Ed. 44, 7204 (2005).
38. G. A. Burley, J. Gierlich, M. R. Mofid, H. Nir, S. Tal, Y. Eichen, T. Carell. J. Am. Chem. Soc. 128, 1398 (2006).
39. J. Wengel. Org. Biomol. Chem. 2, 277 (2004).
40. M. Endo, T. Shiroyama, M. Fujitsuka, T. Majima. J. Org. Chem. 70, 7468 (2005). 41. M. Endo, N. C. Seeman, T. Majima. Angew. Chem., Int. Ed. 44, 6074 (2005). 42. I. Bouamaied, E. Stulz. Synlett 1579 (2004).
(1996).
49. S. Lee, Y. A. Lee, H. M. Lee, J. Y. Lee, D. H. Kim, S. K. Kim. Biophys. J. 83, 371 (2002). 50. S. Lee, S. H. Jeon, B. J. Kim, S. W. Han, H. G. Jang, S. K. Kim. Biophys. Chem. 92, 35 (2001). 51. Y. Kyogoku, R. C. Lord, A. Rich. Proc. Natl. Acad. Sci. USA 57, 250 (1967).
52. K. Wüthrich. NMR of Proteins and Nucleic Acids, John Wiley, New York (1986).
53. S. M. Mel’nikov, M. O. Khan, B. Lindman, B. Jonsson. J. Am. Chem. Soc. 121, 1130 (1999). 54. G. Bonner, A. M. Klibanov. Biotechnol. Bioeng. 68, 339 (2000).
![Fig. 1 MALDI-TOF mass spectra of the free-base diporphyrin arrays. Calculated values [M-1] –1 are 3407.13 for H 2 -3, 3054.53 for H 2 -4, and 2701.60 for H 2 -5.](https://thumb-eu.123doks.com/thumbv2/123doknet/14902615.654401/4.810.94.713.126.273/fig-maldi-tof-spectra-diporphyrin-arrays-calculated-values.webp)