Publisher’s version / Version de l'éditeur:
Advances in Cement Research, 18, 5, pp. 87-92, 1993-04
READ THESE TERMS AND CONDITIONS CAREFULLY BEFORE USING THIS WEBSITE. https://nrc-publications.canada.ca/eng/copyright
Vous avez des questions? Nous pouvons vous aider. Pour communiquer directement avec un auteur, consultez la première page de la revue dans laquelle son article a été publié afin de trouver ses coordonnées. Si vous n’arrivez Questions? Contact the NRC Publications Archive team at
PublicationsArchive-ArchivesPublications@nrc-cnrc.gc.ca. If you wish to email the authors directly, please see the first page of the publication for their contact information.
NRC Publications Archive
Archives des publications du CNRC
This publication could be one of several versions: author’s original, accepted manuscript or the publisher’s version. / La version de cette publication peut être l’une des suivantes : la version prépublication de l’auteur, la version acceptée du manuscrit ou la version de l’éditeur.
Access and use of this website and the material on it are subject to the Terms and Conditions set forth at
Impedance studies of wollastonite micro-fibre-reinforced cement paste
systems
Gu, P.; Xu, Z.; Xie, P.; Beaudoin, J. J.; Low, N. M. P.
https://publications-cnrc.canada.ca/fra/droits
L’accès à ce site Web et l’utilisation de son contenu sont assujettis aux conditions présentées dans le site
LISEZ CES CONDITIONS ATTENTIVEMENT AVANT D’UTILISER CE SITE WEB.
NRC Publications Record / Notice d'Archives des publications de CNRC:
https://nrc-publications.canada.ca/eng/view/object/?id=156bb434-b706-4493-8010-9f7f1938918b https://publications-cnrc.canada.ca/fra/voir/objet/?id=156bb434-b706-4493-8010-9f7f1938918b
I m pe da nc e st udie s of w olla st onit e m ic ro-fibre -re inforc e d c e m e nt
pa st e syst e m s
N R C C - 3 5 4 9 5
G u , P . ; X u , Z . ; X i e , P . ; B e a u d o i n , J . J . ; L o w ,
N . M . P .
A p r i l 1 9 9 3
A version of this document is published in / Une version de ce document se trouve dans:
Advances in Cement Research, 18, (5), pp. 87-92, April-93
http://www.nrc-cnrc.gc.ca/irc
The material in this document is covered by the provisions of the Copyright Act, by Canadian laws, policies, regulations and international agreements. Such provisions serve to identify the information source and, in specific instances, to prohibit reproduction of materials without written permission. For more information visit http://laws.justice.gc.ca/en/showtdm/cs/C-42
Les renseignements dans ce document sont protégés par la Loi sur le droit d'auteur, par les lois, les politiques et les règlements du Canada et des accords internationaux. Ces dispositions permettent d'identifier la source de l'information et, dans certains cas, d'interdire la copie de documents sans permission écrite. Pour obtenir de plus amples renseignements : http://lois.justice.gc.ca/fr/showtdm/cs/C-42
Impedance studies of wollastonite
micro-fibre-reinforced cement paste systems
Ping Gu,* Zhongzi Xu,t Ping Xit!,*
J. J.
Beaudoin:j: and N. M.P. Low*
UNIVERSITY OF OTT A WA; NATIONAL R ESEA R CH COUNC I L, CANADA; NANJ I NG I NSTITUTE OF CHEM I CAL TECHNOLOGY
The impedance behaviour of wollastonite micro-fibre-reinforced cement-based composites at various degrees of hydration has been investigated. The observation of larger high-frequency arcs accompanying wollastonite micro-fibre addition to the Portland cement system at a hydration time greater than 3 days is an indication that the fibre matrix interface zone is less porous than the matrix itself This conclusion is supported by SEM examination and porosimetry determinations. It is demonstrated that differences in the value of R2 (the diameter of the high-frequency arc) for pastes with and without fibre reinforcement can be explained by the contribution to pore structure of both the fibre-cement interface and the cement matrix.
Introduction
In the last decade much attention has been given to the use of fibres in cement-based systems, owing to a great improvement in mechanical properties. These reinforcing materials are often made of steel, glass, polymer, etc. 1
Natural fibres and mineral materials such as mica flakes and cellulose fibres have been reported to have positive results in terms of increased flexural strength and toughness .1 It has been understood that the addition of fibres has a crack-arresting function. The extent of the improvement depends on the mechanical properties of the reinforcing fibres, the microstructure of the fibre-matrix interface and the interaction between the fibres and the cement matrix.
Natural wollastonite, a silicate material with the chemical formula {3-CaO · Si02 , is an economical * Department of Civil Engineering, University of Ottawa, Ottawa,
Ontario, C_anada KIN 6N5.
t Permanent address: Department of Silicate Engineering, Nanjing Institute of Chemical Technology, Nanjing, Jiangsu , 210009, P.R. China.
+
Materials Laboratory , Institute for Research in Construction , National Research Council , Ottawa, Ontario , Canada , KIA OR6. Paper received November 21 1992.reinforcing material used in the pottery industry and in certain cement products.2 It has been reported that the addition of a small percentage of wollastonite micro-fibres can reduce shrinkage in cement-based composites.2 A recent study by Low et al. ,3
•4 reported the results of an investigation into the mechanical properties of cement composites with wollastonite addition of 2-15%. It was argued on the basis of the large differences in porosity values measured by mercury intrusion, helium and isopropanol displacement that wollastonite micro-fibre addition produces a highly discontinuous pore network.
It was also concluded for cement and cement-silica fume systems that the natural wollastonite micro-fibres are an effective reinforcement which improves the flexural strength characteristics. This significant improvement of the flexural strength is attributed to the relatively high modulus of elasticity of the wollastonite fibres, and the multiple cracking mechanism associated with the fibre pull-out process. As the wollastonite fibres are relatively inert, the cement-fibre bonding is probably physical and mechanical rather than chemical in nature. The micro-structure of the cement-fibre interface zone therefore has an important influence on its mechanical properties. It has been demonstrated in previous studies5- 15 that the
impedance behaviour of cement systems is dependent on the microstructure of the solid and the liquid phase, e.g. the porosity and pore size distribution of the matrix, etc. The application of impedance spectroscopy to characterize the microstructural characteristics of wollastonite micro-fibre reinforced cement systems is described in this Paper.
Impedance behaviour of cementitious
materials
Impedance spectra recorded over a wide range of frequencies (from MHz to Hz) have provided new information and insight into cement paste microstructure and hydration. A typical impedance spectrum for a cement system plotted in the real versus imaginary plane (Fig. 87
Bulk cement paste effect Electrode effect Bulk cement paste effect
Electrode effect
R, R, + R2 Real: Q
I
' - - - . J
(a) (b)
Fig. 1. (a) Schematic plot of high-frequency arc in impedance complex plane obtained for cement paste systems. (b)
Simplified electrical equivalent circuit for hydrating cement systems
l(a)) shows a single arc in the high-frequency range, with a small part of a second arc in a relatively low frequency region. From previous investigations10-15 it is suggested
that the high-frequency arc (HFA) may be attributed to the bulk paste impedance behaviour, and that the second arc may be due to the cement-electrode surface capacitance contribution. The intercepts R1 (at the high-frequency end) and R1 +R2 (at the minimum between the
electrode arc and bulk arc) are important parameters which provide information related to the cement paste microstructure profile. The interpretation of an impedance spectrum (IS) is usually carried out through modelling with an equivalent circuit (Fig. l(b)) until the electrical response of the elemental microstructure of the cement paste is well simulated.
Previous investigations13-15 have indicated that the
impedance behaviour of the hydrating cement system depends on the ionic concentration of the pore solution and the porosity. The high-frequency resistance R1 and the high-frequency arc diameter R2 may be expressed as
(1)
(2)
where K ' is a constant related to the cell geometry, Ao
is the equivalent conductivity of the pore solution at infinite dilution, and (3 is an experimental constant associated with ionic interactions and the viscosity of the pore solution, etc. The term [C] is the concentration of ions in the bulk pore solution. The thickness of the Stern layer is represented by Ost· The specific constants k1 and
k2 are functions of temperature and the valences of the ions in the pore solution. The (area fraction)-(volume fraction) ratio ofthe pores is given by a. Pis the porosity of the cement matrix and r0 is the mean pore size, determined from a pore size distribution curve obtained by mercury intrusion porosimetry. From equations (1) and (2) the following points may be drawn.
The high-frequency resistance R1 is an inverse function of both porosity and ionic concentration in the pore solution. If the pore solution concentration remains essentially unchanged, an increase of R1 value may then
be considered to be due to the reduction of porosity as the hydration products fill the capillary pores.
The high-frequency arc diameter (or chord) R2 is an inverse function of the porosity, mean pore size and ionic concentration of the pore solution. If the concentration term remains unchanged, an increase of R2 value must be due to the change of porosity and mean pore size as the hydration time increases.
Both R 1 and R2 are affected by the ionic concentration
of the pore solution. An increase in the concentration will lead to lower R1 and R2 values.
Experimental
Materials
Type 10 Portland cement was used. The chemical composition (wt%) was as follows: Si02 = 19 · 83; Ca0=61·21; Fez03=3·20; Al203=4·18; Mg0=4·09; S03=3·93; Na20=0·45; and K20=0·82. Wollastonite
micro-fibres were supplied by Prescott & Co. USA. The shape of natural wollastonite micro-fibres is needle-like, and they are estimated to be 25-30 !Lm in diameter and 0 · 4-0 · 6 mm in length.
Specimen preparation
Four specimens were prepared containing 0, 5, 10 and 15% by volume of wollastonite. The fresh cement-based mixtures were mixed in a conventional Hobart mixer with a water : cement ratio of 0 · 35, and they were placed in a 1 · 2 em X 1 · 5 em stainless steel cylindrical cell described in references 8 and 9. The sample was left in a 100% relative humidity environment for 24 hours and subsequently immersed in saturated lime solution for the remainder of the test period.
Instrumentation
A 1260 Impedance Gain-Phase Analyzer from Schlumberger Technologies was used for the impedance measurements. Data were collected using a frequency scan from 20 MHz to 1 Hz with lO readings per decade. SEM micrographs were obtained using a Cambridge Stereoscan S250. Pore size distributions were determined by mercury intrusion at pressures up to 408 MPa using an American Instrument Co. porosimeter.
-100 -80 Cl - 60 セ@
"'
<: M セ@ セ@ -40 -20 0% wollastonite • 5% wollastonite ·- 1 O% wollastonite 15% wollastonite P セ セセセセセ MMセ MM セ セセ@ Cl セ@ -160 -120 :g -80 ·c;,"'
セ@ -40 -220 -170 ClセM QRP@
<: M セ@ セ@ - 70 -20 0 100 20 40 60 80 100 (a) 140 180 22 0 260 (c) 150 200 250 300 Real : Q (e)Impedance of wollastonite micro-fibre-reinforced cement
-40 -30 -20 -10 -200 -160 -120 -80 -40
I
I
I
(b) o lMセMM MM セセ セMMセ セセ@ 100 140 180 220 260 300 -220 -170 . 120 --70 -20 100 (d) 150 200 250 300 Real: Q (f)Fig. 2. Impedance plots in real versus imaginary resistance complex plane for cement-based composites with and without
wollastonite micro-fibre addition; hydration times: (a) 4 h; (b) 3 d; (c) 13 d; (d) 25 d; (e) 35 d and (f) 41 d
Results and discussion
Impedance behaviour of wollastonite-cement systems
The impedance behaviour of three cement paste-wollastonite micro-fibre reinforced cement systems, with various wollastonite additions from
5
to 15% by volume, was examined. A control sample without fibre addition was also prepared. Figs 2(a)-(f) depict the impedancedata in the real versus imaginary plane for the four specimens at various hydration times ranging from 4 hours to 41 days. Atthe early stage of hydration, e.g. 4 h, only part of the second arc was observed for all the specimens. At hydration times longer than 3 days high-frequency arcs were observed for all the specimens. The control sample appears to have the largest arc at 3 days (the diameters are 24, 16, 12 and 14 ohms for the 0, 5, 10 and 15%
Ping Gu et al.
wollastonite micro-fibre reinforced cement systems). However, at later hydration stages the control sample appears to have an arc smaller than all those of the wollastonite reinforced systems, and the size of the arc for the control specimen remains substantially smaller than the arc for the wollastonite systems. The differences in size with age is an indication of changes in microstructure development. The appearance of the high-frequency arc (HF A) is due to the microstructure of the solid phase and the ionic conductivity of the pore solution. Analysis of cement hydration by impedance spectroscopy relies on the extraction of useful parameters from the data, e.g. high-frequency resistance (HFR) R1, interfacial resistance R2
and interfacial capacitance C2 . In the following sections,
these model parameters are discussed.
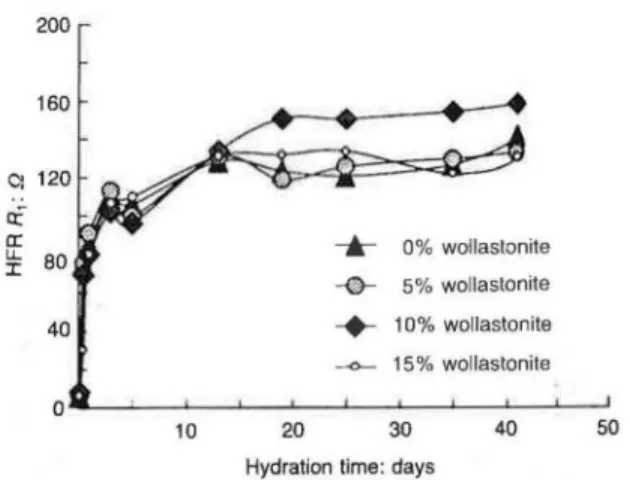
High-frequency resistance R1. Figure 3 is a plot of the high-frequency resistance R1, versus hydration time for the four systems investigated. The observations are similar to those obtained earlier by the Authors10- 12 and others. s-9 R
1 increases at early hydration times and then
reaches a relatively constant value at a hydration time of about 20 days. This tendency coincides with the relation-ship between hydration degree and time. According to equation (1) the high-frequency resistance R1 is a function of the ionic concentration of the pore solution and of the matrix porosity. 13•14 The change of R
1 with
hydration time correlates with the cement hydration process. In the early hydration process a rapid increase of R1 at early hydration (shorter than 3 days) is attributed to the rapid consumption of free water and the reduction of porosity. Once hydration has reached a certain degree the hydration rate becomes diffusion-controlled and the porosity change becomes insignificant (the alkali ionic concentration also remains relatively unchanged at the late hydration stages if leaching does not occur). The high-frequency resistance therefore remains relatively un-changed. Comparing the four curves in Fig . 3, the R1
values for the paste containing 10% wollastonite micro-fibre addition are slightly larger than for other samples at the later hydration stages. There is no apparent indication that the optimum dosage of wollastonite addition
200 ri a:
--...
0% wollaslonite u. 80 :r: -0- 5% wollastonite 40+
10% wollastonite - o - 15 % wollastonite 0 10 20 30 40Hydration time : days
Fig. 3, Plot of high-frequency resistance R1 versus
50
is around 10% by volume, i.e. the value which cor-responds to the maximum flexural strength . 3 The improvement of flexural strength is attributed to processes associated with fibre pull-out, the high modulus of elasticity of the fibres and the control of crack growth.
Interfacial resistance R2 and capacitance C2 . The
change of the interfacial resistance R2 with hydration time for the four systems is shown in Fig. 4. The shape of the R2 versus hydration time curves is similar to that
for curves of hydration degree versus hydration time. The value of R2 is determined by the intercepts R1 (at the
high-frequency end) and R1 +R2 (at the minimum
between the electrode arc and bulk arc). The increase of
R2 may be due to the accumulation of porous hydration
products (C-S-H gel, etc.), which increase the density of interfaces and internal surface area. If the ionic concentrations in the liquid phase, i.e. in the pore solu-tion, are similar in these systems, the slope may be used to characterize the hydration rate. These are affected by the ionic concentration in pore solution, 15 which is determined by the soluble alkali component in the cement. The fast increase of R2 at the early hydration stages is
due to the initial fast hydration rate; the slow increase of
R2 at the later hydration stage beyond 21 days is in
concert with surface diffusion processes controlling the overall hydration rate. Further experiments indicated that at hydration times greater than 41 days the value of R2
approached a relatively constant value. Some relatively small decreases in R2 values were also observed; these
may be due to slow leaching of the alkali ions during the curing process. The decrease ofthe interface capacitance with hydration time for the wollastonite systems is given in Fig. 5 (the inserted picture shows an enlarged scale). A rapid decrease of the capacitance values of the samples was observed. This is due to the increase in the amount of hydration products, which increase the total interface density. Small capacitance values usually correspond to a large interface resistance, indicating a denser matrix.
200 160 セ@ セ@ 120
*
E"'
'0 80 <( u. I 40 __._ 0% wollastonite -o- 5% wollastonite+
10% wollastonite ---<>- 15% wollastonite 10 20 30Hydration time: days
40 50
Fig. 4. Plot of interface resistance R2 versus hydration time
They are also a function of porosity, the mean pore size diameter and the ionic concentration of the liquid .
Fibre-matrix interface microstructure
To complement the AC impedance study, the fibre-matrix interface microstructure of the wollastonite
_..._
0% wollastonite60 -0- 5% wollastonite
20
+
j 0% wol lasto niteu.
c:
-<>-j 5% wol laston ite
cS <IJ 40 0 c: .'!! 8 ·c:;
"'
a."'
0 -.; ·c:; jQ 20 30 40 50"'
"t: <IJ .E 0Hydration time : days
Fig. 5. Plot of interface capacitance C2 versus hydration
time
(a)
(b)
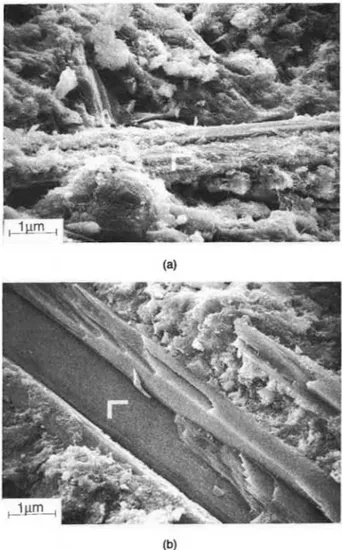
Fig. 6. SEM micrograph (X 1500) for cement paste
containing wollastonite fibre (wlc=0 · 35): (a) at 1 day of hydration; (b) at 21 days of hydration
Impedance of wollastonite micro-fibre-reinforced cement
Table 1. Total porosity of wollastonite micro-fibre-reinforced cement pastes determined by mercury intrusion porosimetry
Hydration Wollastonite content: % time
0 5 10 15
I day 31 · 5 % 32 · 48 % 34·14 % 33 · 32 % 21 day 24 · 79 % 22 · 81 % 23 ·28 % 22·21 %
reinforced cement systems was also investigated by SEM and mercury intrusion porosimetry . Two hydration times (1 and 21 days) were selected for the examintion in order to examine microstructural differences at the fibre-cement interface. Figs 6(a) and (b) are SEM micrographs at these two hydration stages for a paste containing wollastonite micro-fibres . It is clear that the fibre-cement paste interface was quite porous at an early hydration age and then became much denser. Porosity measurements also indicated a significant variation for the two hydration stages. Table 1 lists the total porosity values for the investigated samples at two hydration ages . It is noted that the control sample has a smaller porosity than all the fibre-reinforced systems at 1 day of hydration, but it is larger at 21 days of hydration. An explanation for this observa-tion is that the transiobserva-tion zone at the interface contributes to porosity at early hydration times. The transition zone becomes dense (Fig. 6) at later ages, and its contribution to porosity appears to be much less significant.
Figures 7(a) and (b) depict the pore size distribution for the pure cement paste and paste containing various percentages of wollastonite micro-fibres at 1 and 21 days of hydration . There is a significant difference in the most probable pore size diameters between the wollastonite micro-fibre-reinforced (0·05-0·2 セMエュ@ - 15% wolla-stonite system 0 · 05-0 · 3 セMエュI@ and plain paste (0 · 04-0 · 09 セMエュI@ systems at 1 day of hydration . Pores larger than 0 · 09 セMエュ@ appear to be the result of micro-fibre addition. 16 It is also noted that at 21 days of hydration the pore size distribution for the specimens with and without fibre addition is very similar. The most probable pore size diameters are around 0 · 05-0 · 08 J.tm. The similarity of pore size distribution curves for specimens at 21 days of hydration is also evidence that the porosity at this stage is mainly contributed by the bulk cement matrix rather than the transition zone .
In general, the addition of wollastonite micro-fibres tends to increase the total porosity at early ages . This has been demonstrated by impedance, SEM and porosimetry studies. However, at hydration greater than 3 days the arc diameters of the wollastonite-reinforced specimens become significantly larger than those for the control sample (about 3 times at 41 days for 15% wollastonite. These differences indicate that the transition zone due to the addition of wollastonite tends to become denser than the cement matrix itself. This is compatible with flexural strength results. Flexural strengths increase with wollastonite addition . Strength values at 28 days
Ping Gu et al. 8
_._.
0% wollastonite "#-d) -0- 5% wollastonite E 6"
+
10% wollastonite 0 > セ@ ---<>- 15% wollastonite 8. 4 0 1::"'
E セ@ 2 0 .E 0 (a) 5 "#- 4 d) E"
0 > 3 tl! 8. 0 1:: 2"'
E"'
t; .E 0 0·001 Pore size: f'm {b)Fig. 7. Plot of increment of pore volume versus pore size
diameter determined by mercury intrusion porosimetry for cement-based composites with and without wollastonite micro-fibre addition: (a) at 1 day of hydration; (b) at 21 days of hydration
(w/c=O· 35) are 10 and 20 MPa, respectively, for control paste and paste containing 11% wollastonite micro-fibre by volume.3•4 Also, wollastonite does not appear to participate directly in the hydration process. There is no apparent chemical reaction between the wollastonite micro-fibres and the cement matrix as determined by calorimetry measurements up to 25 hours of hydration time.3 Nucleation of C-S-H at wollastonite micro-fibre surfaces and the resulting pore structure change may lead to the formation of a denser transition zone than the matrix.
Conclusions
At early hydration times (less than 3 days) the high-frequency arcs obtained by AC impedance spectroscopy for wollastonite _micro-fibre-reinforced cement paste systems are smaller than those for the pure Portland cement system. This implies that the porosity at the fibre-matrix interface area is significant.
At the later hydration time (greater than 3 days), the high-frequency arcs obtained by AC impedance spectroscopy for wollastonite micro-fibre-reinforced cement paste systems are larger than those for the pure
porosity at the fibre-cement interface area is less significant than the porosity of the matrix itself.
Differences in high-frequency arc diameter R2 for pastes with and without fibre addition can be explained by the pore size distribution and the values of total porosity determined by mercury intrusion porosimetry, as well as by SEM examination.
The increase of R2 at later hydration times is due to the cement hydration products filling the existing pores, and nucleation of C-S-H at wollastonite micro-fibre surfaces. The resulting pore structure changes appear to lead to the formation of a denser transition zone than the matrix.
Acknowledgements
Financial support by NSERC and the Network of Centers of Excellence on High Performance Concrete is gratefully acknowledged. Thanks are due to B. Myers and Gordon Chan for their help with the experimental apparatus, and to Ed Quinn for taking the SEM photos.
References
I . BEAUDOIN J . J. Handbook of fibre-reinforced concrete. Noyes Publications, Park Ridge, 1990, chapter 3, 83 - 124.
2. JoHNSON R. M . and MELLING E . M . US Patent No . 4,377,415 , . March 22, 1983 .
3. Low N . M. P . and BEAUDOIN J. J. Mechanical properties of high performance cement binders reinforced with wollastonite micro-fibres. Cern. Concr. Res. , 1992, 22 981-989.
4. Low N. M . P . and BEAUDOIN J. J . Flexural strength and microstructure of cement binders reinforced with wollastonite micro-fibres. To be published.
5. McCARTER W. J. eta/. J. Mater. Sci. Lett. , 1988,7, 1056-1057.
6. Mc CARTER W. J. and BROUSSEAU R. Cern. Concr. Res. , 1990,
20, 891-900.
7. BRANTERVIK K . and NIKLASSON G. A. Cern. Concr. Res., 1991,
21, 496-508.
8. SCUDERI C . A . et al. J . Mater. Sci., 1991 , 26, 349.
9 . CHRISTENSEN B. J. et a[. J. Am. Ceram. Soc. , 1992, 75,
939-945.
10. PING Gu et a[. Cern. Concr. Res . , 1992, 22, 833-840.
II . PING Gu eta/. AC impedance spectroscopy (II): microstructural characterization of hydrating cement-silica fume systems . Cern. Concr. Res . • 1993, 23, 157-168.
12. PING Gu et a/. Microstructural characterization of the transition zone in cement systems by means of AC impedance spectroscopy .
Cern. Concr. Res., to be published .
13. PING XIE et a/. A rationalized AC impedance model for
microstructural characterization of hydrating cement systems. Cern. Concr. Res . • 1993, 23, 359-367 .
14. PING Gu et al. Application of AC impedance techniques in studies of porous cementitious materials (I) influence of solid phase and pore solution on high frequency resistance. Cern. Concr. Res., to be published .
15 . ZHONGZI Xu eta/. Application of AC impedance techniques in studies of porous cementitious materials (ID relationships between ACIS behavior and the porous microstructure. Cern. Concr. Res. ,
to be published .
16. UCHIKAWA H. Onoda Cement Company, 1988, 40; also in
Advances in cement manufacture and use. GARTNER E. (Ed .) , Engineering Foundation Conference , 1989, 1, 271-294. · Discussion contributions on this Paper should reach the Editor by