Publisher’s version / Version de l'éditeur:
Vous avez des questions? Nous pouvons vous aider. Pour communiquer directement avec un auteur, consultez la
première page de la revue dans laquelle son article a été publié afin de trouver ses coordonnées. Si vous n’arrivez pas à les repérer, communiquez avec nous à [email protected].
Questions? Contact the NRC Publications Archive team at
[email protected]. If you wish to email the authors directly, please see the first page of the publication for their contact information.
https://publications-cnrc.canada.ca/fra/droits
L’accès à ce site Web et l’utilisation de son contenu sont assujettis aux conditions présentées dans le site LISEZ CES CONDITIONS ATTENTIVEMENT AVANT D’UTILISER CE SITE WEB.
The 6th Conference on 3D Measurement Techniques [Proceedings], II, 2003
READ THESE TERMS AND CONDITIONS CAREFULLY BEFORE USING THIS WEBSITE.
https://nrc-publications.canada.ca/eng/copyright
NRC Publications Archive Record / Notice des Archives des publications du CNRC : https://nrc-publications.canada.ca/eng/view/object/?id=3c6626ee-63bb-4d53-bf41-8fca0404cbbb https://publications-cnrc.canada.ca/fra/voir/objet/?id=3c6626ee-63bb-4d53-bf41-8fca0404cbbb
NRC Publications Archive
Archives des publications du CNRC
This publication could be one of several versions: author’s original, accepted manuscript or the publisher’s version. / La version de cette publication peut être l’une des suivantes : la version prépublication de l’auteur, la version acceptée du manuscrit ou la version de l’éditeur.
Access and use of this website and the material on it are subject to the Terms and Conditions set forth at Critical Factors and Configurations for Practical 3D Image-Based Modeling
Institute for
Information Technology
Institut de technologie de l'information
Critical Factors and Configurations for Practical 3D
Image-Based Modeling *
El-Hakim, S.F., Beraldin, J.-A., and Blais, F. September 2003
* published in the 6th Conference on 3D Measurement Techniques. Zurich, Switzerland. Vol. II, pp. 159-167. September 22-25, 2003. NRC 46554.
Copyright 2003 by
National Research Council of Canada
Permission is granted to quote short excerpts and to reproduce figures and tables from this report, provided that the source of such material is fully acknowledged.
6th Conference Optical 3D Measurement Techniques, Zurich, Switzerland, 22-25 Sept., 2003 1
CRITICAL FACTORS AND CONFIGURATIONS FOR
PRACTICAL IMAGE-BASED 3D MODELING
Sabry F. EL-HAKIM, J.-Angelo BERALDIN, and François BLAIS
Visual Information Technology, National Research Council, Canada
KEY WORDS: 3D Modeling, Evaluation, Simulations, Configurations, Accuracy, Uncertainty. ABSTRACT
There is a need for accuracy evaluation tools for 3D image-based modeling and to identify the key factors and critical configurations affecting this accuracy. We propose a novel technique that creates simulated data based on the actual project data. The technique gives a valid and realistic measure of the accuracy, and has been applied on a wide variety of data to study the effect of various parameters and configurations. As a result, guidelines for some phases of 3D modeling from images are given. We focus on modeling relatively large structures like monuments and architectures for accurate documentation where knowledge of uncertainty is important.
1. INTRODUCTION
1.1 The Objectives
Yet there is no practical comprehensive study of all the issues involved in designing a 3D modeling project using digital images. Neither the optimal network design developed for photogrammetric industrial measurement nor the closely spaced image sequence needed for fully automated modeling techniques is easily applicable in a typical practical situation. Thus, existing studies, although they are the basis of this work, are not sufficient. Our study has two goals:
1. Understand the critical factors that affect the performance by:
• Experimentally verifying the already theoretically proven effects of known parameters. • Studying in depth the effect of parameters that have received less attention in the literature. • Discovering the effects of parameters and configurations that are still not obvious.
2. Develop tools that accurately predict the performance for given application parameters and compute reliable measures for monitoring and verification of the performance.
First we need to define the performance measures then use simulated data, data with ground truth, and fully equipped calibration and evaluation laboratory to test the validity of these measures. Once we are confident in the performance measures, we then use them on practical data without ground truth information to study the effect of possible practical factors. We define the performance as not only the estimated accuracy but also the sensitivity of the configuration to errors in the input data.
1.2 Previous Work
In photogrammetry the goal of the studies is to achieve the optimum accuracy (best accuracy at minimum cost). The focus is on 3D measurements of resolved targets for industrial applications, mainly in controlled environments. Accuracy can be 1: 100,000, based on at least 0.02 pixel target measurement and optimum configuration. Since in practical modeling projects we have no such targets but instead we have natural features with at best 0.5 pixel positioning and less than optimum configurations, we can expect orders of magnitude less accuracy. In computer vision the goal is to identify critical configurations where a solution fails or is ambiguous. The focus is on specific
automated technique, such as stereovision or continuous image streams with short baselines, with the assumption of no restriction on the motion and no knowledge of the camera. These two extremely different points of views have led to studies that are useful only in limited applications. In this paper we focus on large-scale objects and scenes reconstruction for documentation, animation, and visualization. In the natural settings of such objects, it is usually impossible to apply either the optimum configuration for accuracy or the essential sequence for full automation.
1.2.1 Confirmed factors. Studies in photogrammetry [e.g. Fraser 2001] have established that:
• Accuracy increases with the increase in base-to-depth (B/D) ratio and using convergent images rather than images with parallel optical axes.
• Increasing the number of measured points per image improves the accuracy but not significantly if the geometric configuration is strong and the points being measured are well defined (like resolved targets) and well distributed in the image.
• Accuracy improves significantly as the number of images where a point appears increases. However, measuring the point in more than four images gives less significant improvement. • Self-calibration is reliable only when geometric configurations are favorable.
1.2.2 Selected studies. Critical analyses of automated techniques were undertaken. Configurations
that lead to ambiguous projective construction have been identified [Hartley, 2000, Kahl et al, 2001]. Since projective reconstruction must be followed by metric construction using self-calibration, certain sequences will cause self-calibration to fail or not give a unique construction [Sturm 2002, Kahl et al, 2000]. The effect of calibration errors on 3D reconstruction has received some attention. Abraham and Forstner, 1998 performed theoretical analysis using stereo configuration. Errors in the principal distance modify directly the reconstruction while the effect of errors in the principal point coordinates are very small on forward motion. Using closely spaced images, Zucchelli and Kosecka, 2001, found that calibration errors introduce motion bias towards the optical axis. The bias increases by the increase in the field of view and causes a distortion of the resulting 3D structure. Bougnoux, 1998 pursued the stratified approach to Euclidean reconstruction and experimentally demonstrated that, although errors in calibration cause depth distortions, the basic geometric relationships (orthogonality, parallelism) were preserved. Hartley and Kaucic, 2002, showed that large errors in principal point position produce incorrect focal length from self-calibration thus creating visible reconstruction errors. Kunii and Chikatsu, 2002, used check points to find that accuracy of stereo systems improves as the resolution of the camera increases up to 3 mega pixels. Higher resolutions did not improve the accuracy. However, the analysis was based on rather large circular targets. We suspect that on natural features such as corners the pointing accuracy will always improve as the resolution increases. Grossmann and Santos-Victor, 2000, studied the accuracy of reconstruction using self-calibration and compared it with the case of using already calibrated camera. Using short base-line images, i.e. not a strong geometric configuration, they found that the case of already calibrated cameras is always more accurate, particularly on a short sequence of less than 10 images. The effect of input noise on the output parameters and coordinates was studied using theoretical analysis of error propagation [e.g. Yi et al, 1994]. The studies showed significant effect in standard stereo-vision configurations, particularly when using less optimum linear techniques. Triggs et al, 2000, confirmed that photogrammetric bundle adjustment gives the optimum solution for a given input data error. Foerstner, 1994, discussed using covariance matrices as self-diagnostic tools for evaluating the results and accuracy prediction.
1.3 Overview and Scope of the Paper
1.3.1 Performance/Accuracy measures. A measurement must be expressed in terms of an
absolute number ± uncertainty, which is an indication of the accuracy. In the absence of ground-truth data, the standard measure for accuracy or uncertainty is the covariance matrix of the 3D coordinates, factored for a confidence level, at a given reference system. Although the results can
6th Conference Optical 3D Measurement Techniques, Zurich, Switzerland, 22-25 Sept., 2003 3
significantly vary with different reference systems, these variations do not produce different structures or shapes [Morris et al, 1999]. Fraser, 1987 showed that computing the covariance matrix needs only the inverse of the 3x3 normal equations matrix of the object coordinates, thus neglecting correlation between points and the effect of the projective parameters errors. The covariance matrix of all unknowns gives complete evaluation of all parameters like camera position and orientations and correlations between parameters. Bias introduced by systematic errors (e.g. incorrect calibration) will not correctly be reflected in covariance matrices since they are assuming only random errors. Therefore, the effect of systematic errors should be added to the standard deviations.
1.3.2 Parameters and configurations. We need to study the effect of parameters and
configurations on the accuracy of the 3D reconstruction and identify those that may lead to either singularity (no solution) or instability (a small error in the input data causes large errors in the output). The major parameters are camera internal geometry parameters such as resolution and lens parameters, calibration errors, camera and point configurations, number of images per point and points per image, the choice of datum or the 3D coordinate frame and its uncertainty, and assumptions, if any, made about the surfaces in the scene.
1.3.3 Analysis techniques. Many existing publications concentrate only on the theoretical analysis
and have no or limited real experimental results. Theoretical analysis alone is not sufficient since it is usually based on some simplifying assumptions and may not take into considerations all factors present in practice. On the other hand, experimental analysis alone is not sufficient either because it is done on the available data whereas significantly different data may lead to different behavior. One may also analyse the effect of input error on output data under different conditions using real data. However, the most flexible and cost effective way to measure the effect of each parameter, combination of parameters, and any configuration is to use simulations. In this case, care must be exercised to ensure that the simulation represents reality. Some controlled tests are also needed to assess specific parameters and configurations and have some ground-truth-based evaluation.
1.3.4 Scope. Although the paper does not deal with projective reconstruction and we assume
correct correspondence, the analysis is still applicable to the metric reconstruction that must follow the projective one. We use optimal photogrammetric bundle adjustment so our analysis is not biased by any algorithmic simplification or assumptions made. Due to the limited space, not all the actual results could be presented here, however most of the findings are discussed. Based on the analysis, guidelines for achieving geometrically correct 3D models will be given.
2. PRIMARY ANALYSIS
2.1 Design of the Measurement Process
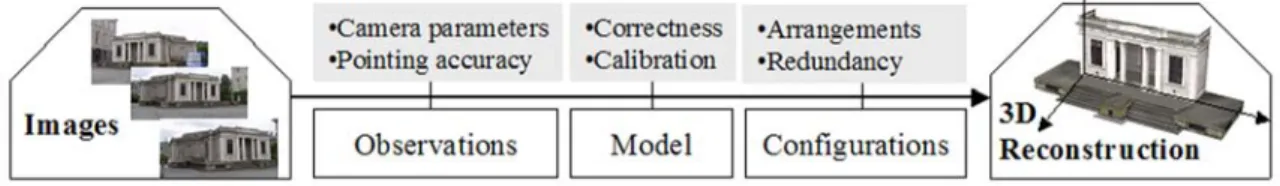
Creation of 3D models, although has been a very active topic over the past decade, remains an experimental process. In particular, designing a procedure to achieve the required accuracy for a given application is still ad hoc. In any accepted standardized measurement application the design procedure follows figures 1. Without identifying the sources and the size of the error given the application parameters, we have no way of designing a project to satisfy its requirements. This procedure has been in use in close-range photogrammetric industrial applications using simulations [Fraser 1987]. Our analysis is also based on simulated data supported by real data, and ground truth observations, from a large number of diverse projects.
2.2 Identifying Error Sources
1. Pointing accuracy is affected by image quality such as resolution, lens aberrations, sharpness, and human errors if pointing manually. 2. The validity of the model parameters describing the internal
geometry of the camera (camera calibration errors).
3. External geometry or configuration parameters such as camera positions and orientations relative to the object and to each other. 4. Redundancy or the number of points per image and the number of
images where a point appears.
5. Datum (reference coordinate system) establishes scale, origin, and orientation. Change in datum should not change the shape of the object, however it will change the resulting coordinates and thus the covariance matrix and its homogeneity.
6. Assumptions, if any, made about the shape of the object.
Figure 1: Design process
Figure 2: Main sources of error in the 3D reconstruction from images
3. ANALYSIS WITH REAL AND SIMULATED DATA
The most effective way to do the analysis is to use simulation supported by real data. This allows us to separate the effect of various factors and have more control and flexibility on the configurations.
3.1 Ground Truth Simulation Tool
We developed a novel tool to simulate test data with ground truth from the actual project data. The idea can be summarized as follows:
1. Take images of the object of interest in the practically possible locations. Apply bundle adjustment with the real data to find camera parameters and some object coordinates.
2. Replace the real object with a simulated object based on the 3D measurements and reference system from step 1. The simulated object can be a simplified version of the actual object.
3. Project the 3D coordinates of the ideal object into the images using the computed camera parameters from step 1. Since the simulated shapes are simple, the software tool determines the visible surfaces automatically. Previously measured real object image coordinates are removed. 4. Add noise to the projected image coordinates, the value of which depends on image resolution
and quality of features (usually 0.25 to 1.0 pixel on natural features).
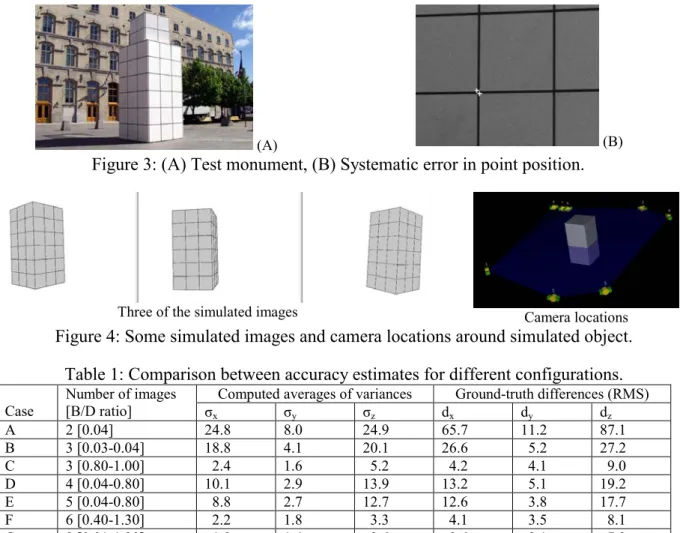
5. We now have a set of simulated data that has the same configuration as the actual data. We then perform accuracy and sensitivity evaluation based on ground truth. If the tests prove that the model will not meet accuracy requirements or is unreliable, the configuration can be changed in the simulation to achieve the desired accuracy and re-acquire the actual images accordingly. We will start with a simple monument, the Paris City sculpture, Place de Paris, in Quebec City (figure 3). Images were taken all around at various base-line distances. Bundle adjustment was done using points at the corners of the lines on the object surfaces. From this, a simulated object (figure 4) has been created. A total of 84 points at the intersections of grid lines were created with ideal xyz coordinates. Random errors of one-pixel standard deviation were added.
6th Conference Optical 3D Measurement Techniques, Zurich, Switzerland, 22-25 Sept., 2003 5
(A) (B)
Figure 3: (A) Test monument, (B) Systematic error in point position.
Three of the simulated images Camera locations
Figure 4: Some simulated images and camera locations around simulated object. Table 1: Comparison between accuracy estimates for different configurations.
Computed averages of variances Ground-truth differences (RMS) Case Number of images [B/D ratio] σx σy σz dx dy dz A 2 [0.04] 24.8 8.0 24.9 65.7 11.2 87.1 B 3 [0.03-0.04] 18.8 4.1 20.1 26.6 5.2 27.2 C 3 [0.80-1.00] 2.4 1.6 5.2 4.2 4.1 9.0 D 4 [0.04-0.80] 10.1 2.9 13.9 13.2 5.1 19.2 E 5 [0.04-0.80] 8.8 2.7 12.7 12.6 3.8 17.7 F 6 [0.40-1.30] 2.2 1.8 3.3 4.1 3.5 8.1 G 8 [0.01-1.30] 1.8 1.4 2.6 3.6 3.1 7.2
3.2 Validation of Accuracy Estimator
We will consider the estimator σ, from the covariance matrix, valid if the actual error is within 3 σ. The estimator was valid except for some cases. When the added noise is not random, the estimator becomes too optimistic. We intentionally perturbed the image coordinates by small amount, the one shown in figure 3-B. This resulted in up to 7 σ errors. This emphasizes the fact that statistical estimators can only deal with the random component. Also the estimator was unreliable when the redundancy was low, such as using points in only two closely spaced images [table 1 (A)]. The homogeneity of the standard deviations is also desired else we need an estimator for each point.
3.3 Effect of Image Configurations
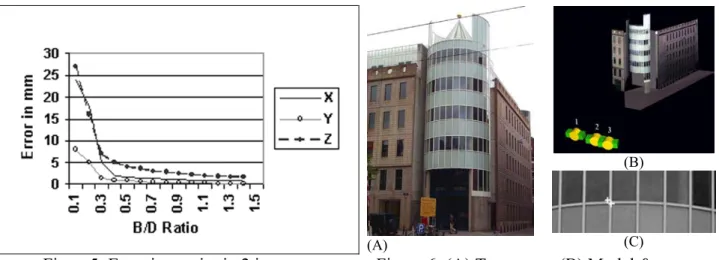
We will now closely examine the effect of camera configurations, particularly the use of closely spaced images versus widely spaced images. In a sequence of closely spaced images, if the points are tracked only in 2 images (figure 5), the resulting reconstruction was poor. The effect was almost proportional to B/D2 when B/D was less than 0.3. Using combination of images, some with poor and some with good geometry, and tracking the points over all images, the reconstruction was acceptable. In the case of 4 images [table 1 (D)], the points that appeared in 3 weak images only had an order of magnitude larger standard deviation than the points appearing in all 4 images. This situation will happen in practice due to accessibility limitations. In the scene is figure 6 due to trees and close-by buildings it was difficult to find suitable camera positions. Only 3 images at small B/D (0.13) were possible. Standard deviations in X, Y, and Z were: 4.0 mm, 6.6 mm, and 24.2 mm, thus the small B/D ratio gave significant error in Z. An error of the size shown in figure 6C in one image gave an error of 9 mm (X), 13.8 mm (Y), and 60.1 mm (Z) when using all three images. When using only two images the error in Z increased to 193 mm (compared to 60.1 mm for 3 images).
(A)
(B)
(C)
Figure5: Error in a point in 2 images Figure 6: (A) Test scene, (B) Model & camera locations, (C) Systematic error in point position.
3.4 Effect of Redundancy
Using the test data in figure 3, we studied the effect of the number of points per image and the number of images where a point appears. The poor B/D ratio contributed to large uncertainty when the redundancy was low (2-3 images), but then reached the same accuracy at 6 images as when the B/D ratio was high. This proves that tracking points over at least 6 images gives significant improvement in accuracy, particularly for weak geometric configurations.
A: B/D ratio (0.57-0.92) –30 points per image.
B: B/D ratio (0.57-0.92)- 60 points per
image. C: B/D ratio: 0.17-0.46 – 30 points per image.
Figure 7: Effect of redundancy at different image configurations.
3.5 Effect of calibration errors
3.5.1 Errors in focal length. The test sculpture shown in figure 8 was
imaged from all sides with each image taken with different focal length. The focal lengths varied from 14 mm to 26 mm. First, we performed a bundle adjustment assuming one focal length for all images (15 mm). This resulted in an average standard deviation of 5.7 mm (X), 3.7 mm (Y), and 6.9 mm (Z). When using the correct focal length per image, the standard deviations were 1.9 mm, 1.3 mm, and 2.4 mm respectively, an improvement by a factor of 3. However, the systematic effect on the shapes was much larger than what the standard deviation indicated. For example, a rectangular shape on the object measured 1002.8-mm x 600.2-mm x 1004.4-mm x 600.4-mm using the correct focal lengths. The same rectangle measured 1007.8-mm x 592.1-mm x 1032.9-mm x
6th Conference Optical 3D Measurement Techniques, Zurich, Switzerland, 22-25 Sept., 2003 7
3.5.2 Errors in principal point. Fixing the principal point (P.P.) at image center is common when
performing self-calibration in computer vision. From laboratory calibration of many digital cameras we found that the calibrated principal point coordinates were shifted from the center by an average of 35 pixels. We calibrated with fixed P.P. at the center and also calibrated by solving for the correct location. Comparing results, we found no effect on either the standard deviations or reconstruction (e.g planes, cylinders and angels between planes remain correct). Studies that showed significant effect (Hartley and Kaucic, 2002) varied the principal point by half the size of the image, which does not happen in practice unless the image is cropped.
3.6 Effect of Resolution
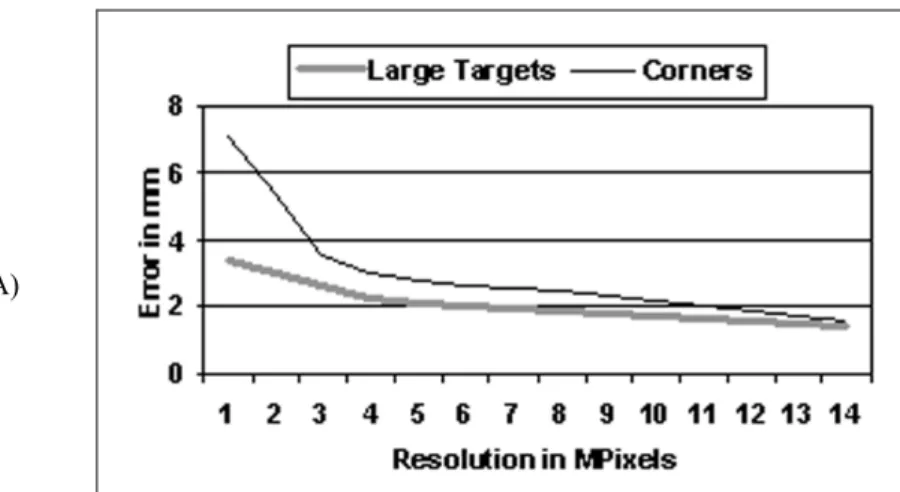
On well-defined large targets the effect of the resolution on the center of the target may not be the same as on small targets and natural features like corners. We experimented with targets of various sizes and with corners. Our test site includes 31 sets of target groups each has 6 targets of two different sizes and corners of rectangles (figure 9). The targets were surveyed to 0.1 mm accuracy and used as ground truth. The cameras used had resolutions ranging from 1.5 to 14 mega pixels. Figure 10 displays the relationship between resolution and accuracy on the Z coordinate for large targets and small targets or corners (results with small targets and corners were combined). On the large targets, improvement when increasing the resolution was relatively small. For example it was 30% from 1.5 to 4 mega pixels, and 20% from 4 to 14 mega pixels. A 60% improvement between 1.5 and 4 mega pixels and 30% between 4 and 14 mega pixels was found on the small targets and the corners, thus the effect of image resolution was more significant.
(A)
(B)
Figure 9: Test Targets (A), Close up (B) Figure 10: Accuracy vs. resolution
4. CONCLUSIONS
Since internal evaluation using the covariance matrix may give too optimistic results (particularly for weak geometry, low redundancy, and presence of systematic errors) a novel tool to simulate data with ground truth from the actual project data has been developed. This simulation was very useful in uncovering behavior that the covariance matrix alone did not reveal. Using this tool, as well as controlled tests, the conclusions of the work presented in this paper can serve as guidelines for accurate image-based modeling. Here are the most significant conclusions:
• In practice, it is difficult to achieve optimum network design. Therefore, the goal should be to avoid weak geometric configurations, low redundancy, and incorrect calibration.
• To avoid low redundancy, points should be tracked over 4 or more images, at least two of which have base to depth ratio of 0.4 or larger, and over at least 6 images for closely spaced sequences. This is the most effective way to increase accuracy even for poor configurations.
• Weak geometric configurations are directly function of the base to depth ratio, and the effect is more pronounced when this ratio is small (close to B/D2 when B/D is less than 0.3).
• Since conditions for accurate self-calibration may not be achievable in practice, separate camera calibration at the focal settings used in the actual project is recommended. Most digital cameras, at least recent ones, will accurately record the actual settings on each image thus we can calibrate at each of those setting. Assuming that the principal point is located at the center of the image while doing the calibration has insignificant effect on the reconstruction.
• On natural features, the accuracy of the input data improves significantly as camera resolution increases, while the improvement is less significant on well-defined large resolved targets. • In applications such as architectures, assumptions about surface shapes, such as planes and
cylinders (like the objects in figure 3 and 6), are sometimes integrated in the solution. Although not shown here, if these assumptions are not exactly true they will create bias in the results. • In practical projects, using natural features and less than optimum configuration, but high
redundancy and correct pre-calibration, we can expect about 1: 4,000 accuracy. This should be reduced if practical conditions reduce the redundancy or the pointing precision.
REFERENCES
Abraham, S., Foerstner, W., 1998. Calibration errors in structure from motion. DAGM Symposium Mustererkennung, Stuttgart, Germany, Springer Verlag, pp. 117-124.
Bougnoux, S., 1998. From projective to Euclidean space under any practical situation, a criticism of self-calibration. Proc. Intl. Conf. Computer Vision (ICCV98), pp. 790-796.
Foerstner, W., 1994. Diagnostics and performance evaluation in computer vision. NSF/ARPA Workshop: Performance versus Methodology in Computer Vision, Seattle, WA, pp. 11-25.
Fraser, C.S. 1987. Limiting error propagation in network design. Photogrammetric Engineering and Remote Sensing, 53(5), pp. 487-493.
Fraser, C.S., 2001. Network design. In Close Range Photogrammetry and Machine Vision (K.B. Atkinson Ed.), Whittles Publishing, Caithness, Scotland, U.K.
Grossmann, E., Santos-Victor, J., 2000. Uncertainty analysis of 3D reconstruction from uncalibrated views. Image and Vision Computing, 18, pp. 685-696.
Hartley, R., 2000. Ambiguous configurations for 3-view projective reconstruction. In European Conf. Computer Vision, pp. 922-935, Dublin, Ireland, Springer-Verlag.
Hartley, R, Kaucic, R., 2002. Sensitivity of calibration to principal point position. ECCV 2002, LNCS 2351, pp. 433-446.
Kahl, F., Triggs, B., Åström, K., 2000. Critical motions for auto-calibration when some intrinsic parameters can vary. Journal of Mathematical Imaging and Vision 13, pp. 131-146.
Kahl, F., Hartley, H., Åström, K., 2001. Critical configurations for N-views projective reconstruction. IEEE Computer Vision and Pattern Recognition (CVPR’01), vol. 2, pp. 158-163. Kunii, Y., Chikatsu, H., 2002. Generating 3D model of “Meguro Residence” using digital amateur
camera. ISPRS Commission V Symposium, Corfu, Greece, Sept.
Morris, D., Kanatani, K., Kanade, T., 1999. Uncertainty modeling for optimal structure from motion. Proc. Vision Algorithms: Theory and Practice Workshop, Sept., Corfu, Greece.
Sturm, P., 2002. Critical motion sequences for the self-calibration of cameras and stereo systems with variable focal length. Image and Vision Computing, 20, pp. 415-426.
Triggs, W., P. McLauchlan, R. Hartley, A. Fitzgibbon, 2000. Bundle Adjustment for Structure from Motion. In Vision Algorithms: Theory and Practice, Springer-Verlag.
Yi, S., Haralick, R.M., Shapiro, L.G., 1994. Error propagation in machine vision, Machine Vision and Applications, 7(2), 93-114.
Zucchelli, M., Kosecka, J., 2001. Motion bias and structure distortion induced by calibration error. Proceedings of British Machine Vision Conference (BMVC), Manchester, UK, pp. 663-672.