Dynamique de l'infection grippale : modélisation et applications
Texte intégral
Figure
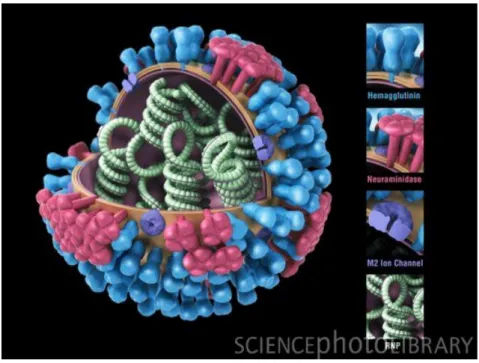
![Figure 2.1: Inuenza virus replication cycle (from [34])](https://thumb-eu.123doks.com/thumbv2/123doknet/14705718.565971/25.892.213.687.369.760/figure-inuenza-virus-replication-cycle-from.webp)

![Figure 3.1: A schematic showing the stages of the hostenvironment interaction in the course of infection [60].](https://thumb-eu.123doks.com/thumbv2/123doknet/14705718.565971/35.892.135.756.149.547/figure-schematic-showing-stages-hostenvironment-interaction-course-infection.webp)

![FIG. 5. Distribution of individual infection and illness parameters for the latent period (a) and infectiousness duration (b) computed for eight viral titer thresholds (0.5, 1, 1.5, 2, 2.5, 3, 3.5, and 4 log 10 [TCID 50 /ml]), infectiousness (white, absenc](https://thumb-eu.123doks.com/thumbv2/123doknet/14705718.565971/55.892.130.786.139.523/distribution-individual-infection-parameters-infectiousness-duration-thresholds-infectiousness.webp)
![Figure 4.1: Proportion of infectiousness. Upper left panel: Infectiousness is proportional to the VK only as in [120]](https://thumb-eu.123doks.com/thumbv2/123doknet/14705718.565971/58.892.168.718.358.792/figure-proportion-infectiousness-upper-left-panel-infectiousness-proportional.webp)
Documents relatifs
In order to complete the discussion about melting system, we process in 6 and 7 with two different setups that are common in the process of melting in the Arctic; effect of
Figure B.1.: Marginal effect of the age ln Agenij on the number of foreign high skilled workers employed, conditional on the level of skilled labour endowment of the country
effect on challenged (Time Chal) and unchallenged (Ti me Unchal) larvae as explanatory variables (arrows) on selected response variables (lines) related to energy
The purpose of the present paper is to study the effect of temperature on the properties of nanofluids, namely thermal conductivity and dynamic viscosity, in the two most
Le but principal de la présente étude est la mise en œuvre d’une méthodologie de mesures quantitatives de cette modalité d’imagerie en combinaison avec des agents de
On a choisi de modéliser simultanément et de façon cohérente l’effet de la densité et des facteurs sociaux sur la croissance, aux deux niveaux de l’arbre et du
The effect of selective decontamination of the digestive tract on colonisation and infection rate in multiple trauma patients. Stoutenbeek CP, van
On en conclut que, dans le scénario de référence, les variations saisonnières de la balance électrique du territoire sont imputables principalement à la
