Contrasting biogeochemical
characteristics of the Oubangui River and
tributaries (Congo River basin)
Steven Bouillon1, Athanase Yambe´le´2, David P. Gillikin3, Cristian Teodoru1, François Darchambeau4, Thibault Lambert4& Alberto V. Borges4
1Department of Earth and Environmental Sciences, KULeuven, Leuven, Belgium,2Service de l’Agrome´te´orologie et de Climatologie, Direction de la Me´te´orologie Nationale, Bangui, Central African Republic,3Department of Geology, Union College, Schenectady, NY, USA,4University of Lie`ge, Chemical Oceanography Unit, Lie`ge, Belgium.
The Oubangui is a major tributary of the Congo River. We describe the biogeochemistry of contrasting tributaries within its central catchment, with watershed vegetation ranging from wooded savannahs to humid rainforest. Compared to a 2-year monitoring record on the mainstem Oubangui, these tributaries show a wide range of biogeochemical signatures, from highly diluted blackwaters (low turbidity, pH, conductivity, and total alkalinity) in rainforests to those more typical for savannah systems. Spectral analyses of chromophoric dissolved organic matter showed wide temporal variations in the Oubangui compared to spatio-temporal variations in the tributaries, and confirm that different pools of dissolved organic carbon are mobilized during different hydrological stages. d13C of dissolved inorganic carbon ranged between 228.1% and 25.8%, and was strongly correlated to both partial pressure of CO2and to the
estimated contribution of carbonate weathering to total alkalinity, suggesting an important control of the weathering regime on CO2fluxes. All tributaries were oversaturated in dissolved greenhouse gases (CH4,
N2O, CO2), with highest levels in rivers draining rainforest. The high diversity observed underscores the
importance of sampling that covers the variability in subcatchment characteristics, to improve our understanding of biogeochemical cycling in the Congo Basin.
T
he recognition that carbon (C) processing within inland waters could be a substantial component in C budgets at the catchment, regional, or global scale (e.g.1–3), has led to an increased momentum in studies onriverine biogeochemistry. Further constraining the role of river systems will only be possible by generating additional comprehensive datasets, in particular on systems or regions which are currently underrepresented. Of key importance are tropical and subtropical regions, which have been suggested to be of particular importance in terms of riverine transport of sediments and carbon (e.g.4–5), and have been suggested to show higher areal CO
2 outgassing rates than their temperate or boreal counterparts3,6. Based on a long tradition of interdisciplinary
studies, the Amazon often serves as a model system for the biogeochemical functioning of tropical river basins with African rivers being largely neglected. The Congo River basin is second to the Amazon in terms of discharge (1310 versus 6640 km3yr21) and catchment size (3.8 106versus 5.8 106km2), but is much less well characterized
from a hydrological, physico-chemical, and biogeochemical point of view. The main biogeochemical studies on the Congo basin have focussed on dissolved and particulate erosion rates both on the main Congo River and in some of its major tributaries such as the Oubangui and Sangha (e.g.,7–11). The synthesis of Laraque et al.11, however,
shows that sampling efforts were concentrated on a limited number of sites, and these monitoring programmes were limited to a restricted number of basic parameters. For many stations, extrapolations needed to be made based on less than 5 samples (e.g. the upper Congo River and Kasai River12,). Mariotti et al.13provided the first
stable isotope data on particulate organic carbon (POC) from the lower Congo River and some of its tributaries. More recently, some explorative work on the organic and inorganic C biogeochemistry of the lower Congo River has been presented14–46, and we reported results from a 1-year sampling programme on the Oubangui at Bangui
(Central African Republic, CAR), focussing on the dynamics and annual export of different C pools and green-house gas (GHG) emissions17. Rivers in the Congo basin network, however, can be expected to show highly
variable physico-chemical and biogeochemical characteristics, considering the range in geology, climatic condi-tions and land use/vegetation across the basin. Laraque et al.18analysed the physico-chemical properties and major
ion composition in different tributaries of the lower Congo, and found strong contrasts between those draining the
SUBJECT AREAS: STABLE ISOTOPES BIOGEOCHEMISTRY Received 23 April 2014 Accepted 3 June 2014 Published 23 June 2014 Correspondence and requests for materials should be addressed to S.B. (steven.bouillon@ ees.kuleuven.be)
‘‘Cuvette Congolaise’’ (mainly rainforest-dominated lowlands) and the ‘‘Te´ke´ plateaux’’, where savannahs form the main biome type. Similarly, Mann et al.19 recently demonstrate strong gradients in
biogeochemical characteristics across rivers and streams in the Sangha and lower Oubangui catchment. The existence of a large gradient in biogeochemical characteristics is relatively well documen-ted for some of the large South American basins (e.g.20), but
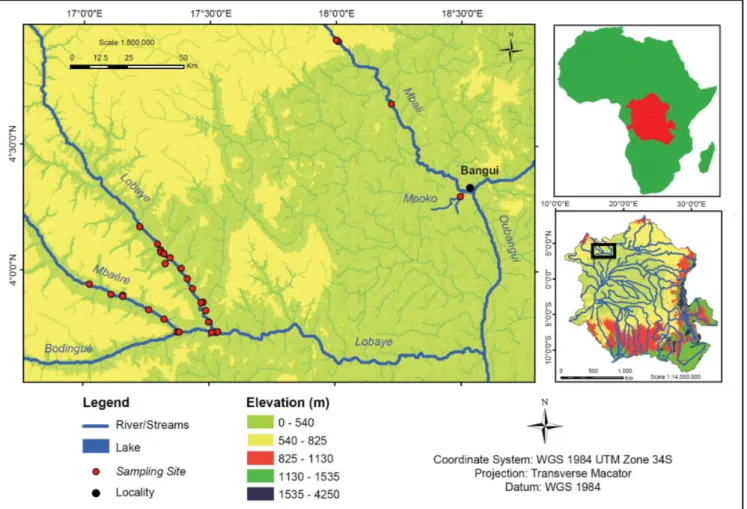
compre-hensive geochemical data from the Congo basin are still mostly limited to the mainstem in the Malebo Pool at Brazzaville and some of the main tributaries. During three sampling campaigns between 2010 and 2012, we sampled a number of tributaries of the Oubangui River, from savannah-dominated systems (Mbali River, Mpoko River) to those draining mainly humid rainforest ecosystems (Lobaye, Mbae´re´, Bodingue´, and some of their minor tributaries) in the Ngotto Forest (Figure 1). Here, we compare biogeochemical data from these tributaries with our own results from 2 years of high-frequency sampling on the mainstem Oubangui River at Bangui, and with available literature data on the wider Congo Basin.
Results
Material fluxes in the Oubangui River. A detailed discussion of results for the first year of monitoring was presented in Bouillon et al.17. While no direct DOC measurements are available for the
2ndyear, we estimated DOC fluxes based on the relationship between
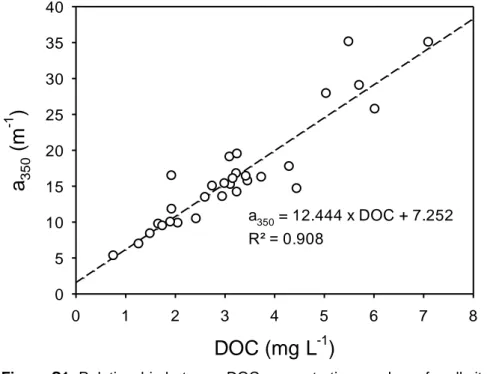
a350and DOC observed in the tributaries (see Supplement Figure S1; unpublished data from other sites within the larger Congo Basin also follow this trend). The 2ndyear of measurements was characterized
by a markedly lower annual discharge (,30% lower), and for most elements, the annual transport fluxes were accordingly lower than
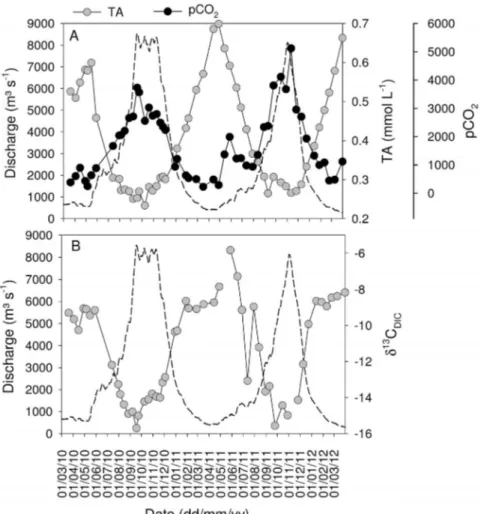
those reported previously by 22% (for DIC) to 55% (for DOC, summarized in Table 1). As an illustration, the seasonal patterns over both years of sampling are presented in Figures 2–3 for TSM, TA, d13C
DIC, pCO2, CH4and N2O. The full data can be found in17 and in Supplementary Table 2. During the 2ndyear, however, we also
analysed spectral parameters of cDOM. The a350values exhibited a strong increase with increasing discharge, with values ranging from about 5 m21 during base flow to . 20 m21 during high flow
(Figure 4). The a250:a365 ratio values were relatively high during base flow (4.6–5.5) and dropped markedly during the ascending limb of the hydrograph to values closed to 4.2 during high flow period (Figure 4). Opposite patterns were observed for the spectral slopes. S275–295 values decreased with increasing discharge (from .0.016 nm21 during base flow to 0.012 nm21 during high flow)
whereas S350–400values increased with increasing discharge (from 0.013 nm21 during base flow to 0.016 nm21 during high flow).
Finally, spectral slope ratios (SR) exhibited a strong seasonal variation with markedly higher values during base flow period (.1.2) compared to high flow period (about 0.8).
Despite the lower transport fluxes, estimated CO2fluxes across the water-air interface were similar or slightly higher during 2011–2012 than during 2010–2011 (Table 1). Overall, the seasonality in concen-trations and isotope ratios followed similar patterns during both years (Figures 2–3), hence we will not discuss these in detail but use the data mainly to examine overall patterns across the mainstem and tributaries.
Tributary characteristics.Tributaries showed a much wider range of values for most of the measured variables than recorded during the
Figure 1|Map showing the location of the Oubangui within the Congo Basin, and detailed map showing the tributary sampling sites (note that some sites represent small first order tributaries). Map produced using ArcGIS software.
2 years of monitoring on the mainstem Oubangui River. Biogeochemical signatures in the tributaries appear to be clustered according to the catchment characteristics. Specific conductivity generally showed very low values (average 14.6 mS cm21, with a
minimum of 7.6 mS cm21) in many sites within the densely
vegetated Ngotto Forest (Lobaye, Mbae´re´, Bodingue´), and was higher in the more northern, savannah catchments (Mbali, Mpoko : 22–170 mS cm21) as well as in all left bank tributaries of the Lobaye
river (average 89.4 mS cm21) which are situated at the rainforest/
savannah transition. TA was generally well correlated with specific conductivity (Figure 5), and ranged between 0.009 and 1.791 mmol L21. The highly dilute rivers in rainforest-dominated catchments
were also characterised by very low TSM concentrations (0.7– 16.0 mg L21) while higher TSM loads were encountered in some of
the tributaries of the Lobaye (9.4–44.4 mg L21) and in Mpoko River
(78.0 mg L21). Rivers in the Ngotto Forest were also characterized by
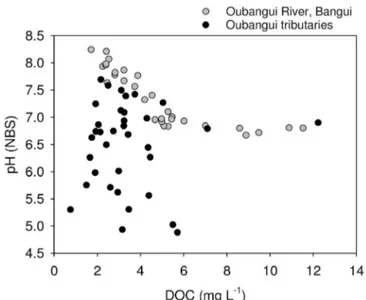
relatively lower pH values, but despite the visual appearance as ‘blackwater’ rivers (in particular the Mbae´re´ and Bodingue´), do not
show substantially higher DOC concentrations (between 1 and 6 mg L21 for the majority of samples, Figure 6). The a
350values of the Oubangui tributaries were higher during the wet period (36.2 6 14.0 m21) than during the dry period (22.9 6 6.8 m21) (see
Supplementary Tables) and are well correlated with DOC concentrations across the seasons (Figure S1). The variations of a250:a365 ratios were relatively limited within and across seasons, with a pattern of lower values during wet period (3.84 6 0.16) compared to the dry period (4.02 6 0.17). Spectral slopes over the range 275–295 nm (S275–295) decreased weakly between the dry and wet period, with mean values of 0.0124 6 0.0004 nm21and 0.0116 6
0.0003 nm21, respectively. In contrast, S
350–400values tended to be higher during wet period (0.0152 6 0.001 nm21) compared to dry
period (0.0147 6 0.0009 nm21). The difference in the S
Rratio was however more marked between the two seasons, with lower values during the wet period (0.770 6 0.049) compared to the dry period (0.845 6 0.046). Note that the variations of DOM composition proxies were more marked when data are compared site to site. For example, the increase in a350 in the Mbae´re´ from 10.5 to 35.0 m21 between dry and wet periods was related to clear
decreases in the a250:a365 ratio (from 4.3 to 3.7), S275–295 (from 0.0131 to 0.0117 nm21) and S
R(from 0.860 to 0.799). Compared to the mainstem Oubangui River, d13C values of DIC span a wide
range of values and are typically more13C-depleted, with very low
values in the Mbae´re´ (223.5 6 2.0%), intermediate values in the mainstem Lobaye (216.1 6 2.0%) and in its minor tributaries (214.3 6 2.3%), and highest values in the Mbali and Mpoko River (211.1 to 210.5%). d13C
DICvalues are strongly negatively correlated with pCO2(Figure 7). With the exception of the Mpoko River, d13C values of POC and DOC fall within the range expected for
a dominance of C3 vegetation (231.2 to 225.8% for POC, 230.6 to 227.0 for DOC). The more turbid Mpoko River showed a d13C
POCof 222.8%, indicating a substantial contribution from C4 vegetation in this subcatchment (no d13C
DOC data available for this site). d13C values of POC and DOC pools were well correlated, and d13C
POC values increased with TSM load (Figure 8).
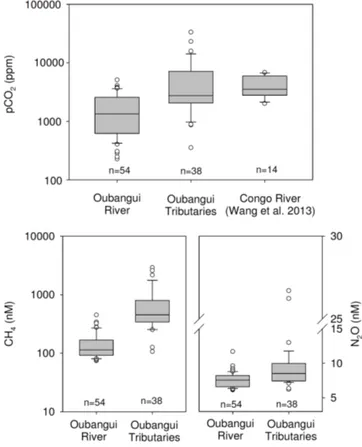
Calculated pCO2 values for the different Oubangui tributaries were highly variable, ranging between 870 and 33500 ppm, being generally higher than those observed in the mainstem Oubangui River (Figure 9). Similarly, both dissolved CH4and N2O concentra-tions were generally higher in tributaries than in the mainstem Oubangui River (Figure 9).
Discussion
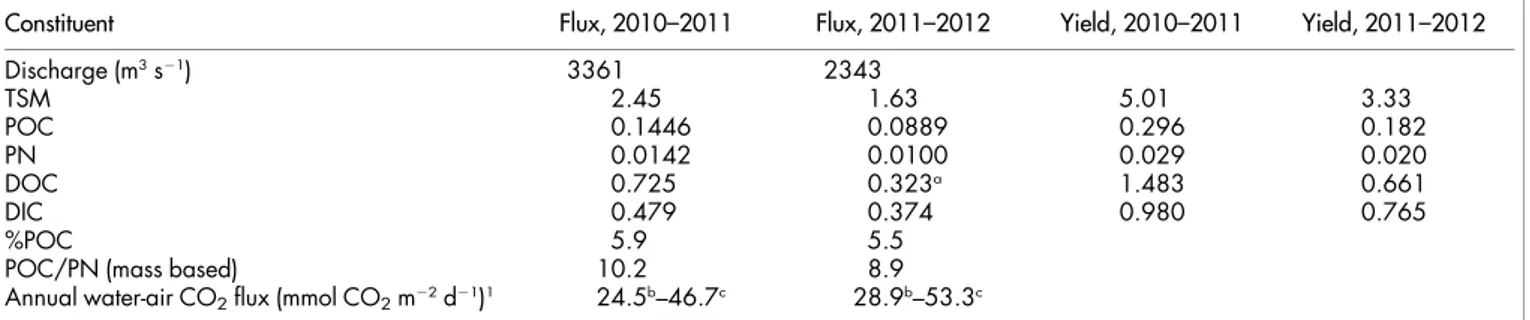
Organic carbon.Rivers are often categorized in one of three types, mainly based on colour, distinguishing white-water rivers (alkaline to neutral pH, high sediment loads), black-water rivers (acidic, high DOC loads, very low sediment loads and dissolved ion concentrations), and clear-water rivers (low sediment loads but Table 1 | Summary of fluxes and element ratios, and yields (i.e. fluxes expressed per unit are of the catchment) measured in the Oubangui River at Bangui during two subsequent hydrological years, 20th March 2010 to 19th March 2011 (data from Bouillon et al. 2012) and 20th March 2011 to 18th March 2012 (this study). Fluxes are expressed in Tg y21, yields are expressed in ton km22y21
Constituent Flux, 2010–2011 Flux, 2011–2012 Yield, 2010–2011 Yield, 2011–2012
Discharge (m3s21) 3361 2343 TSM 2.45 1.63 5.01 3.33 POC 0.1446 0.0889 0.296 0.182 PN 0.0142 0.0100 0.029 0.020 DOC 0.725 0.323a 1.483 0.661 DIC 0.479 0.374 0.980 0.765 %POC 5.9 5.5
POC/PN (mass based) 10.2 8.9
Annual water-air CO2flux (mmol CO2m22d21)1 24.5b–46.7c 28.9b–53.3c
a: estimated based on relationship between a350and DOC concentrations, see text and Supplementary Figure S1. b, c: calculated using two different parameterisations, see17for details.
Figure 2|Seasonal variations of daily discharge (dotted lines) and (A) total suspended matter concentrations (TSM), and (B) concentrations of CH4and N2O in the Oubangui River at Bangui between March 2010 and
variable in terms of pH and alkalinity). This distinction is, however, not always straightforward (see e.g. 21). Consistent with the generally low mechanical erosion rates reported for the Congo Basin11, TSM
concentrations in most of the tributaries were low. Only the Mpoko River which drains a wooded savannah region and some of the minor tributaries of the Lobaye, on the rainforest-savannah transition zone, showed slightly more elevated TSM concentrations (9.0–78.0 mg L21). While the Bodingue´ and Mbae´re´ watersheds sampled here
visually show characteristics of blackwater rivers, their DOC concentrations (1.5–7.1 mg L21) in the lower range of those found
in the mainstem Oubangui (Figure 8), and generally lower than those reported for the mainstem Congo River (6.2 to 17.6 mg L21; 13,19) or
the Epulu River in the upper Congo Basin (5.2–9.0 mg L21; Spencer
et al. 2010), and lower than the range reported for blackwater rivers in the Amazon (7–40 mg L21, 21). In all of the sampled tributaries,
DOC remained the dominant form of organic C (OC), representing 53–95% of the total OC pool. While sampling sites were not consistently similar between different sampling campaigns, DOC concentrations were generally higher during the 2012 wet season compared to the 2 dry season campaigns (e.g. for the mainstem Lobaye: 3.5 6 0.9 mg L21, n55 during the wet season, 1.9 6
0.1 mg L21, n55 during dry season; for the Mbae´re´: 6.4 6 1.0 mg
L21, n52 during the wet season, 2.4 6 0.8 mg L21, n56 during dry
season). Such higher DOC concentrations during wet conditions are in line with results from other sites in the Congo basin such as the mainstem Oubangui10,17, mainstem Congo10,16, and rivers in the Ituri
Forest14.
The ratio of spectral slopes SR and the a250:a365 ratio were developed as rapid and easy methods for characterizing cDOM. The SRratio has been correlated to molecular weight and sources, i.e samples of greater allochthonous contribution with higher molecular weight DOM have lower SRvalues22. The a250:a365ratio has been correlated with the molecular size and DOM aromaticity with decreasing values relating to increasing molecular size23. In a
recent study focusing on cDOM properties in 30 U.S Rivers, Spencer et al.24also showed that the a
250:a365ratio was inversely related to the hydrophobic organic acid fraction (HPOA) of DOM which repre-sents the high molecular weight, aromatic-dominated fraction of DOM25. Therefore, low a
250:a365ratio values (high HPOA fraction)
Figure 3|Seasonal variations of daily discharge (dotted lines) and (A) total alkalinity (TA) and the partial pressure of CO2(pCO2), and (B) the carbon
stable isotope signatures of dissolved inorganic carbon (d13C
DIC) in the Oubangui River at Bangui between March 2010 and March 2012.
Figure 4|Seasonal variations of a350and the a250:a365ratio in the
indicate an allochthonous origin of DOM, whereas high a250:a365 values (low HPOA fraction) suggest an autochthonous sources (algal or microbial) or photodegraded DOM26–27.
The ranges of S275–295, S350–400and SRin the Oubangui system are comparable to that from other allochthonous dominated freshwater systems including temperate, Arctic, and tropical rivers15,22,28–30. The
range of the a250:a365ratio is comparable to that from other temperate and Arctic rivers15,28.
The large variations in stream SRand a250:a365ratios that occurred along with changes in DOC concentrations and water discharge during the high flow period in the Oubangui River and its tributaries clearly indicate that DOM pools are being mobilized that are differ-ent than those typical of base flow conditions (Supplemdiffer-entary Tables 4 and 5). Similar changes in DOM optical properties across the hydrological cycle, especially in spectral slopes proxies, have also been reported in tropical14,29and Arctic rivers28,30, as well as in an
agricultural watershed in California31. Highest DOC concentrations
were linked with lower SRand a250:a365values, indicating an increase in the contribution of allochthonous sources to stream DOM due to greater surface runoff and leaching of organic rich layers during the high flow period14,30. However, lowest DOC concentrations were
linked with higher SRand a250:a365values, indicating that DOM is less aromatic in nature during the base flow period. This shift in DOM sources can be explained by the deepening of hydrologic flow paths through the soil profile and greater residences time of DOC in contact with soil subsurface microbial communities, leading to the mobilization of a more microbially processed DOM during base flow period14,30. However, combining optical and fluorescence properties
of cDOM, Yamashita et al.29proposed another explanation in the
interpretation of the increase of SRduring base flow period reported in tropical rivers in Venezuela. These authors suggested that the increase of SRvalues could potentially result from a higher contri-bution of autochthonous source by enhanced plankton primary pro-ductivity during the low turbidity period. However, based on the previous study of Bouillon et al.17, such autochthonous source has
not been identified as contributor of DOC in the Oubangui River, supporting the hypothesis of a deepening of hydrological flow path as driver of changes in DOM sources.
The temporal variation observed in spectral slopes proxies in the Oubangui River are similar to those observed in the Epulu River14.
During the wet period (April) the Epulu was characterized by lowest SRvalues (0.834 6 0.028) close to those measured in the Oubangui River during high flow period occurring from September to December (0.832 6 0.041). In the Epulu River, SRincreased with decreasing discharge during post- and intermediary periods (November-February), with mean and maximal values of 0.962 6 0.056 and 1.066, respectively. Mean value of SRin the Oubangui River
Figure 5|Relationships between specific conductivity and (A) total alkalinity (TA), and (B) in situ pH for the mainstem Oubangui (grey circles; data from 2 years of monitoring), and tributaries of the Oubangui (black circles).
Figure 6|Relationship between dissolved organic carbon (DOC) concentrations and in situ pH for the mainstem Oubangui (grey circles; data from 2 years of monitoring), and tributaries of the Oubangui (black circles).
Figure 7|Relationships between the carbon stable isotope composition of DIC (d13C
DIC) and the partial pressure of CO2(pCO2), for the
mainstem Oubangui (grey circles; data from 2 years of monitoring), and tributaries of the Oubangui (black circles).
during base flow periods was higher, about 1.180 6 0.116, with a maximal SRvalue of 1.323. S350–400values showed the same temporal variations in both rivers, with lowest values in the Oubangui River compared to the Epulu River. The main difference between these two tropical rivers is the variations in S275–295 values observed in the Oubangui River and to a lower extent in Oubangui tributaries. High flow period was associated with a clear decrease in S275–295, whereas Spencer et al.14reported no seasonal variations in S
275–295 across the hydrological cycle.
Despite the similar temporal variations in DOC concentrations and DOM composition, spatial differences can be observed between the Oubangui River and its tributaries. The Oubangui River is char-acterized by a more important range of variations in whole cDOM parameters, including absorption coefficient, a250:a365(E2:E3), and spectral slope coefficients. This observation is quite different from those reported by Yamashita et al.29, where hydrological changes
seem to affect cDOM properties in tributaries to a larger extent than the main river channels.
d13C
POCvalues showed a positive correlation with sediment loads (Figure 8), but were generally in the range expected for C3-domi-nated catchments. The d13C values in the rivers draining the Ngotto
Forest are relatively low (232.2 to 229.1%), but vegetation in these systems can be expected to have low d13C values given the effects of
both high precipitation32 and relatively closed-canopy structure
(e.g.,33). The increasing pattern in d13C
POC values with increased sediment loads (albeit still low on a global scale, 34) suggests higher sediment inputs in catchments where C4 vegetation is more substan-tial (i.e., from savanna landscapes). The negative relationship between TSM loads and %POC (the contribution of POC to the total particulate matter load, Figure 8) has been previously observed in a range of individual river basins (e.g.,35), and on a global scale
(e.g.,4,36). In our case, this correlation can be interpreted as reflecting
the continuum from 2 contrasting end-members: (i) direct litter or organic-rich surface soil layers as observed in the majority of the rainforest rivers, and (ii) more soil-derived sediments as observed in the more turbid systems, with correspondingly lower %POC. Inorganic carbon. HCO32 in rivers is mainly derived from the weathering of carbonate and silicate rocks, with the relative proportions depending to a very large extent on the lithology of the drainage basin37–38. Gaillardet et al. (39, based on data from 8)
estimated the relative contributions of carbonate and silicate weathering to the bicarbonate load of the Congo River and some of its tributaries (Oubangui, Sangha, and Kasai) and found a contribution of silicate weathering generally between 50–60% except for the Sangha where carbonate dissolution dominated (only 9% resulting from silicate weathering). Since we do not have data on Cl2concentrations as required in their approach, we used the
simple stoichiometric model of Garrels and Mackenzie37whereby the
contribution to TA from carbonate weathering (TAcarb) is computed from Ca21and Mg21concentrations and the contribution to TA from
silicate weathering (TAsil) is computed independently from dissolved silicon (Si) concentrations, according to:
TAcarb52*([Ca21] 1[Mg21] - [SO422])
Figure 8|Relationship between total suspended matter concentrations (TSM) and (a) d13C signatures of particulate organic carbon (d13C
POC),
and (b)the contribution of particulate organic carbon (POC) to the TSM pool (%POC) for the mainstem Oubangui, tributaries of the Oubangui and samples collected throughout the Congo basin (literature data from Mariotti et al. 1991, Sigha-Nkamdjou et al. 1993, Coynel et al. 2005, Bouillon et al. 2012, Spencer et al. 2012).
Figure 9|Boxplots of data on pCO2, CH4, and N2O concentrations for
the mainstem Oubangui River (data from 2 years of monitoring), and tributaries of the Oubangui (all sites and sampling seasons combined). pCO2data for the lower Congo River are from Wang et al. (2013). n
TAsil5[Si]/2
SO422allows to account for Ca21originating from the dissolution of gypsum (CaSO4), but this correction term was ignored in absence of SO422data. In a companion study in the Tana basin (Kenya) we found SO422to correspond to about 10% of Ca21for a variety of streams and rivers40, which is likely an upper estimate for our study
area given the more humid climate and the absence of evaporative environments.
For the tributaries, there is a good linear regression between the modeled TA (TAcarb1TAsil) and observed TA (r250.99, n 5 36, Figure 10A). In the Oubangui mainstem, the modeled TA is well correlated to the observed TA but markedly deviates from the 1:1 line as the values increase. The stoichiometric model of37assumes
that the weathering of silicate rocks leads to a release of HCO32and dissolved Si (DSi) according to a 1:2 ratio. This is true for common mineral forms such as olivine and albite, but the dissolution of some other mineral forms lead to a different HCO32:DSi ratio. For instance, the weathering of plagioclase feldspar (NaCaAl3Si5O16) leads to the release of HCO32and DSi in a 654 ratio. While no detailed information is available on the mineralogy of the underlying bedrock in our study catchments, they are underlain mostly by meta-morphic rocks in which feldspars are likely to be common consitu-ents. When we apply this ratio to the Oubangui mainstem data, the recomputed modeled TA in the high values range is in better
agree-ment with observed TA, than based on the HCO32:DSi ratio of 152 (Figure 10A). The contribution of carbonate rock weathering (%TAcarb) was estimated as the percentage of TAcarbto total modeled TA (TAcarb1TAsil), and ranged between 30% and 94%, encompass-ing the range of %TAcarbcomputed by Gaillardet et al.39between 40% and 91%. %TAcarbis positively correlated to TA indicating a lower contribution of carbonate rock weathering in the basins draining humid forest than savannah.
Carbon in HCO32originating from silicate rock weathering comes exclusively from CO2, while 1/2 of the C in HCO32from carbonate rock comes from CaCO3and the other 1/2 from CO2. If the CO2 involved in the weathering comes from organic C degradation, d13C
DICshould have a negative signature (as indicated by the d13C signatures of DOC and POC), while marine CaCO3has a d13C sig-nature close to 0%41.
This can explain the positive relationship between %TAcarband d13C
DIC (Figure 10B). When applying a linear fit to these data (R250.69), the extrapolated d13C
DIC values for the end members where the contribution of carbonate weathering is 0 and 100% are 231.3 and 21.5%, respectively, which corresponds well with the expected values for terrestrial vegetation in the rainforest biome and marine carbonates. d13C
DICvalues as low as those found in some of the Ngotto forest rivers (as low as 228.1%) have, to the best of our knowledge, only been reported for a few rivers in the Amazon basin42–43, and can only occur under conditions when alkalinity is
extremely low and hence where silicate weathering dominates. The strong correlation between d13C
DICand pCO2(Figure 7) on the one hand, and the link between d13C
DICand carbonate weathering dis-cussed above, suggest that the relative importance of silicate versus carbonate weathering may exert an important control on pCO2in the studied river systems. Such a mechanism is further suggested by the highly significant regressions (p,0.0001) between log(pCO2) and the estimated contribution of carbonate weathering to TA (R250.38), or with Si/Ca21 ratios (R250.35), i.e.,rock weathering
would explain close to 35% of the variance of pCO2. A recent analysis of factors controlling inorganic carbon speciation in North American rivers44concluded that while much of the variation in the spatial
patterns of TA and pH can be explained by catchment processes and characteristics related to chemical weathering (e.g., precipita-tion, proportion of carbonate rocks), spatial variations in pCO2were mainly governed by in-river processes only indirectly related to the catchments (e.g. temperature through its effect on respiration). At the scale of our study, where factors such as temperature are much more homogeneous spatially and seasonally, it appears that the weathering regime could exert a partial control on the inorganic carbon speciation, and hence influence pCO2and water-atmosphere CO2exchange. It should be noted, however, that our calculated pCO2 data from rivers with low pH are likely to be overestimates, since a comparison of calculated pCO2data with those measured in the field with a direct headspace technique suggests that the former approach induces a substantial bias towards higher pCO2under conditions of low pH (,6.5) and/or very low TA (Abril et al., in preparation). While this compromises some of the absolute pCO2data from rivers in the Ngotto forest, it is unlikely to distort the overall patterns described above.
Methane and nitrous oxide. The data compilation by Bastviken et al.2 demonstrated the lack of CH
4 flux data from tropical systems, despite the fact that tropical freshwater systems are often claimed to show much higher CH4 emissions than temperate or high-latitude systems. For the Oubangui tributaries, we have made no attempts to calculate diffusive CH4fluxes (due to the lack of data required to estimate gas exchange velocities, as outlined above for CO2), yet it is evident that dissolved CH4concentrations are, on average, more than an order of magnitude higher than in the mainstem Oubangui River (Figure 9). Riverine CH4concentrations
Figure 10|Relationship between (A) observed and modeled total alkalinity (TA) (see text for details), and (B) the carbon stable isotope composition of DIC (d13C
DIC) and the estimated contribution of TA
in the few African catchments studied so far range drastically, with reported values between 1 and 6730 nM in the Athi-Galana-Sabaki River45, between 48 and 870 nM in the Comoe´, Bia and Tanoe´ rivers
in Ivory Coast46, and between 25 and 505 nM in the Tana River
basin47. While CH
4 concentrations in the mainstem Oubangui show a pronounced seasonality (17, and Figure 2), a comparison of CH4data for the Lobaye and Mbae´re´ between our dry and wet season campaigns shows no distinct differences. While the riverine network is clearly a consistent source of CH4to the atmosphere, the data suggest that diffusive CH4fluxes are highly variable in space and time and therefore difficult to upscale reliably. As reported earlier for the mainstem Oubangui River, dissolved N2O levels were generally low (6.4–13.0 nM, except for the Ke´le´, a small and shallow rainforest stream draining into the Mbae´re where N2O concentrations reached 26.7 and 26.2 nM during the 2012 and 2013 sampling campaigns, respectively). These values represent only a slight oversaturation with respect to atmospheric equilibrium (137 6 22%, 380–402% for the Ke´le´). A synthesis by Baulch et al.48 found higher N
2O emissions to be associated with increasing N inputs, hence the low N2O concentrations observed are in line with the pristine status of our study catchments and the observed low nitrate levels (median of 7.1 mM, range: 0–50 mM, n5 32; own unpublished data).
Concluding remarks. Overall, our results demonstrate that even within a relatively small set of subcatchments of the Oubangui River, biogeochemical characteristics of different rivers and streams show highly contrasting characteristics on the one hand, yet consistent co-variations between parameters on the other hand. According to Raymond et al.3and Regnier et al.49, one of the factors
limiting our ability to better constrain the role of rivers in regional and global C budgets is that the current empirical database is too sparse to adequately resolve the diversity of soil types, inland waters, estuaries and coastal systems, and specifies the Congo Basin as one of the key areas of regional priority. The data collected and compiled here, while covering only a small subset of the Congo Basin, suggest that large data collection efforts will be required to adequately describe the aquatic biogeochemical variability for this large tropical basin. However, the systematic co-variation between some of the examined proxies of C origin and transformation, and the apparent link with certain catchment characteristics (lithology and vegetation) provide some important clues on the type of classification and characterization needed to upscale future data to the catchment scale.
Methods
The Oubangui River (Figure 1) is the second largest tributary of the Congo River (after the Kasai), with a length of 2400 km from the source (Uele River) to its confluence with the Congo River, and a drainage basin of 644000 km2, of which 489000 km2(76%) is located upstream of Bangui10. The Oubangui catchment upstream of Bangui is dominated by dry wooded savannahs, with more humid forest situated downstream towards the confluence with the Congo mainstem. The mean annual precipitation in the catchment is ,1400–1540 mm y21 10. The hydrological cycle of the Oubangui is characterized by a single main flood peak and maximum discharge typically in October-November. Annual discharge has fluctuated between 2120 m3s21(1990) and 6110 m3s21(1969). Although we did not find land-use data specifically for the Oubangui catchment, deforestation rates in the CAR are reported to be among the lowest in Africa (net deforestation of 0.06% y21 50). According to the Food and Agriculture Organisation (FAO) statistics (http://faostat.fao.org/), agri-cultural land use has remained stable between 1961 and 2010, and makes for ,8% of the total land area. Considering a national population density of ,7 inhabitants km22, these figures support classifying the Oubangui catchment as nearly pristine. Monitoring on the Oubangui in the city of Bangui (CAR, 4u219 N, 18u 349 E) was initiated in late March 2010, and was followed by approximately 2-weekly sampling. A subset of data collected between March 2010 and March 2011 were presented in21; data on the subsequent year of monitoring (after which this programme ended) are included here.
Tributaries of the Oubangui were sampled in March 2010 (dry season), March 2011 (dry season), and November 2012 (wet season). During the first field campaign, two sites were sampled along the Mbali River (Fig. 1), as well as the Mpoko River just south of Bangui (see also 13), and the main rivers draining the Ngotto Forest, Lobaye
province (Fig. 1). The Ngotto Forest was revisited in 2011 and 2012 for more extensive sampling on the main rivers (Mbae´re´, Lobaye, and Bodingue´) and some of their minor tributaries. The Ngotto Forest, bordering on the Republic of Congo (a.k.a. Congo Brazzaville) and characterized by annual precipitation of ,1600 mm, is classified as a semi-deciduous rainforest and lies south of the wooded savannahs of the Guinea-Sudanian transition zone. Water levels were lower during the dry season surveys (March) than during the wet season (November), but water level differences are rather small (1.0–1.5 m), in line with the relatively stable discharge of the Lobaye River (monthly average flow ranging between 250 and 500 m3s-1 for the period 1950–1984; data from the Global River Discharge Database (http://www.sage.wisc. edu/riverdata/, accessed February 2014). The Mbae´re´ and Bodingue´ are the two main permanent rivers, which are bordered by extensive areas of seasonally flooded forests. The Bodingue´ River joins the Mbae´re´ River prior to joining the Lobaye River, which lies on the northern side of the Ngotto Forest and represents the border towards drier, savannah landscapes to the North. The Lobaye River is an important tributary of the Oubangui River. The Ngotto Forest forms a protected area with high biodiversity, and very low human population densities51. The geology of the region is complex and includes igneous, metamorphic, and Mesoproterozoic– Neoproterozoic sedimentary formations that include calcareous sediments52.
Water temperature, conductivity, dissolved oxygen (O2) and pH were measured in situ with a YSI ProPlus multimeter, whereby the O2and pH probes were calibrated on each day of data collection using water saturated air and United States National Bureau of Standards buffer solutions (4 and 7), respectively. All sampling for larger rivers was performed from dugout canoes at ,0.5 m below the water surface, in a few cases sampling was performed from a bridge (Mpoko) or from the river shore (Mbali). Samples for dissolved gases (CH4, N2O) and the stable isotope composition of dis-solved inorganic C (d13C
DIC) were collected with a Niskin bottle or a custom-made sampling bottle consisting of an inverted 1L polycarbonate bottle with the bottom removed, and ,0.5 m of tubing attached in the screw cap53. 12 mL exetainer vials (for d13C
DIC) and 50 mL serum bottles (for CH4and N2O) were filled from water flowing from the outlet tubing, poisoned with HgCl2, and capped without headspace. Approximately 2000 mL of water were collected 0.5 m below the water surface for other particulate and dissolved variables, and filtration and sample preservation was performed in the field within 2 h of sampling.
Samples for total suspended matter (TSM) were obtained by filtering 200–1000 mL of water on pre-combusted (4 h at 500uC) and pre-weighed glass fiber filters (47 mm GF/F, 0.7 mm nominal pore size), and dried in ambient air during the fieldwork. Samples for determination of particulate organic C (POC), particulate nitrogen (PN) and C isotope composition of POC (d13C
POC) were collected by filtering 50–300 mL of water on pre-combusted 25 mm GF/F filters (0.7 mm nominal pore size). The filtrate from the TSM filtrations was further filtered on 0.2 mm polyethersulfone syringe filters (Sartorius, 16532-Q) for total alkalinity (TA), DOC and d13C
DOC(8– 40 mL glass vials with Polytetrafluoroethylene coated septa). TA was analysed by automated electro-titration on 50 mL samples with 0.1 mol L21HCl as titrant (reproducibility estimated as typically better than 6 3 mmol kg21based on replicate analyses). The partial pressure of CO2(pCO2) and DIC concentrations were com-puted from pH and TA measurements using thermodynamic constants of Millero54as implemented in the CO2SYS software55. It should be noted, however, that this approach is expected to overestimate pCO2in some of the blackwater rivers (see Discussion).
For the monitoring data on the Oubangui River, CO2exchange with the atmo-sphere was calculated as F5 kaDpCO2 where k is the gas transfer velocity, a is the solubility coefficient for CO2, and DpCO2 represents the difference in partial pres-sure of CO2between water and air. Monthly averages corresponding to time of sampling of atmospheric pCO2from Mount Kenya (Kenya, -0.05uN 37.80uE) were retrieved GLOBALVIEW-CO2 database (Carbon Cycle Greenhouse Gases Group of the National Oceanic and Atmospheric Administration, Earth System Research Laboratory). k values were calculated using two approaches, one based on the rela-tionship between wind speed and k600 (i.e., k normalized to a constant temperature of 20uC), and an alternative approach using a gas transfer parameterization based on depth and water current that was developed for rivers and streams; details can be found in Bouillon et al.17. No CO
2flux estimates were made for the tributary sampling sites, since both approaches would be hampered by a lack of adequate ancillary information - data on river depth and flow velocity are lacking, and the varying degree of canopy closure would compromise the use of modeled wind speed data.
For the analysis of d13C
DIC, a 2 ml helium (He) headspace was created, and H3PO4 was added to convert all DIC species to CO2. After overnight equilibration, part of the headspace was injected into the He stream of an elemental analyser – isotope ratio mass spectrometer (EA-IRMS, ThermoFinnigan Flash HT and ThermoFinnigan DeltaV Advantage) for d13C measurements. The obtained d13C data were corrected for the isotopic equilibration between gaseous and dissolved CO2as described in Gillikin and Bouillon56and measurements were calibrated with certified reference materials LSVEC and either NBS-19 or IAEA-CO-1. Reproducibility of d13C mea-surements was 0.2% or better. Concentrations of CH4and N2O were determined via the headspace equilibration technique (20 mL N2headspace in 50 mL serum bottles) and measured by gas chromatography (GC, 63) with flame ionization detection (GC-FID) and electron capture detection (GC-ECD) with a SRI 8610C GC-FID-ECD calibrated with CH4:CO2:N2O:N2mixtures (Air Liquide Belgium) of 1, 10 and 30 ppm CH4and of 0.2, 2.0 and 6.0 ppm N2O, and using the solubility coefficients of Yamamoto et al.57for CH
4and Weiss and Price58for N2O. 25 mm filters for POC, PN and d13C
POCwere decarbonated with HCl fumes for 4 h, re-dried and packed in Ag cups. POC, PN, and d13C
abovementioned EA-IRMS using the thermal conductivity detector (TCD) signal of the EA to quantify POC and PN, and by monitoring m/z 44, 45, and 46 on the IRMS. An internally calibrated acetanilide and sucrose (IAEA-C6) were used to calibrate the d13C
POCdata and quantify POC and PN, after taking filter blanks into account. Reproducibility of d13C
POCmeasurements was better than 60.2%. Samples for DOC and d13C
DOCwere analysed either on a Thermo HiperTOC-IRMS, or with an Aurora1030 TOC analyser (OI Analytical) coupled to a Delta V Advantage IRMS. Typical reproducibility observed in duplicate samples was in most cases ,65% for DOC, and 60.2% for d13C
DOC. For a subset of samples from the Ngotto Forest, we compared DOC concentrations and d13C data for samples filtered on 0.2 mm (as described above) and only on 0.7 mm GF/F filters; for both variables no significant differences were found (n515, two-tailed paired t-test, in both cases p,0.0001 at 95% confidence interval, data in Supplementary Table 1).
Samples for major element concentrations and Si were filtered through a 0.45 mm polyethersulfone (PES) or polycarbonate (PC) filter, and measured by ICP-AES (Iris Advantage, Thermo) or ICP-MS (Perkin Elmer Elan 6100).
Samples for the analyses of cDOM spectral characteristics were prepared similarly as for DOC analyses, but without H3PO4addition. cDOM samples were stored in amber glass vials with PTFE-coated septa. Absorbance measurements were recorded on a Perkin-Elmer UV/Vis 650S using a 1 cm quartz cuvette. Absorbance spectra were measured from 190 to 900 nm at 1 nm increments and noise instrument was assessed measuring Milli-Q water as blank. The correction for scattering, index of refraction and blank was performed by fitting the absorption spectra to the data over the range 200–700 nm according to the following equation:
Al~A0e{S l{lð 0ÞzK, ð1Þ where Aland A0are the absorbance measured at defined wavelength l (nm) and at reference wavelength l05375 nm, respectively, S is the spectral slope (nm21) that describes the approximate exponential decline in absorption with increasing wave-length, and K is a background offset. According to Johannessen and Miller59, the offset value was then subtracted from the whole spectrum. The fit was not used for any purpose other than to provide an offset value. After correction, absorption coeffi-cients were calculated according to the relation:
al~2:303|Al=L, ð2Þ
where al is the absorption coefficient (m21) at wavelength l, A is the absorbance corrected at wavelength l, and L the path length of the optical cell in meters (0.01 m).
Several optical indices were calculated to investigate CDOM properties, including spectral slopes over the ranges 275–295 nm (S275–295) and 350–400 nm (S350–400), the slope ratio (SR) and the a250:a365ratio. Spectral slopes were determined using linear regression for the log-transformed a spectra for the intervals 275–295 nm and 350– 400 nm and the slope ratio SR was calculated as the ratio of S275–295to S350–40022. The a250:a365ratio (also called E2:E3 ratio) was calculating using absorption coefficients at the appropriate wavelengths.
Literature data on specific parameters were obtained either from tabulated values in the relevant papers, data supplied by authors, or digitized from figures using PlotDigitizer v2.6.1 (http://plotdigitizer.sourceforge.net/).
1. Cole, J. J. et al. Plumbing the global carbon cycle: Integrating inland waters into the terrestrial carbon budget. Ecosystems 10, 171–184 (2007).
2. Bastviken, D. et al. Freshwater methane emissions offset the continental carbon sink. Science 33, 50 (2011).
3. Raymond, P. A. et al. Global carbon dioxide emissions from inland waters. Nature 503, 355–359 (2013).
4. Ludwig, W., Probst, J. L. & Kempe, S. Predicting the oceanic input of organic carbon by continental erosion. Global Biogeochem. Cycles 10, 23–41 (1996). 5. Schlu¨nz, B. & Schneider, R. R. Transport of terrestrial organic carbon to the oceans
by rivers: re-estimating flux and burial rates. Int. J. Earth Sci. 88, 599–606 (2000). 6. Aufdenkampe, A. K. et al. Riverine coupling of biogeochemical cycles between
land, oceans, and atmosphere. Front. Ecol. Environ. 9, 53–60 (2011). 7. Probst, J. L., Mortatti, J. & Tardy, Y. Carbon river fluxes and weathering CO2
consumption in the Congo and Amazon river basins. Appl. Geochem. 9, 1–13 (1994).
8. Ne´grel, P. et al. Erosion sources determined by inversion of major and trace element ratios and strontium isotopic ratios in river water: the Congo Basin case. Earth Planet. Sci. Lett. 120, 59–79 (1993).
9. Seyler, P. & Elbaz-Poulichet, F. Biogeochemical control on the temporal variability of trace element concentrations in the Oubangui river (Central African Republic). J. Hydrol. 180, 319–332 (1996).
10. Coynel, A. et al. Spatial and seasonal dynamics of total suspended sediment and organic carbon species in the Congo River. Glob. Biogeochem. Cycles 19, GB4019 (2005).
11. Laraque, A. et al. A review of material transport by the Congo River and its tributaries. Hydrol. Process. 23, 3216–3224 (2009).
12. Seyler, P. et al. Concentrations, fluctuations saisonnie`res et flux de carbonne dans le bassin du Congo. Grands Bassins Fluviaux (ORSTOM, Paris, 1995). 13. Mariotti, A. et al. Carbon isotope composition and geochemistry of particulate
organic matter in the Congo River (Central Africa): application to the study of Quaternary sediments off the mouth of the river. Chem. Geol. 86, 345–357 (1991).
14. Spencer, R. G. M. et al. Temporal controls on dissolved organic matter and lignin biogeochemistry in a pristine tropical river, Democratic Repblic of Congo. J. Geophys. Res. 115, G03013, doi:10.1029/2009JG001180 (2010). 15. Spencer, R. G. M. et al. An initial investigation into the organic matter
biogeochemistry of the Congo River. Geochim. Cosmochim. Acta 84, 614–627 (2012).
16. Wang, Z. A. et al. Inorganic carbon speciation and fluxes in the Congo River. Geophys Res Lett 40, doi: 10.002/grl.50160 (2013).
17. Bouillon, S. et al. Organic matter sources, fluxes and greenhouse gas exchange in the Oubangui River (Congo River basin). Biogeosciences 9, 2045–2062; doi:10.5194/bg-9-2045-2012 (2012).
18. Laraque, A. et al. Impact of lithological and vegetal covers on flow discharge and water quality of Congolese tributaries of the Congo River. Rev. Sci. Eau 11, 209–224 (1998).
19. Mann, P. J. et al. The biogeochemistry of carbon across a gradient of streams and rivers within the Congo Basin. J. Geophys. Res. doi:10.1002/2013JG002442 (in press).
20. Richey, J. E. et al. Outgassing from Amazonian rivers and wetlands as a large tropical source of atmospheric CO2. Nature 416, 617–620 (2002).
21. Mayorga, E. & Aufdenkampe, A. [Processing of bioactive elements in the Amazon River system]. The Ecohydrology of South American Rivers and Wetlands [McClain, M.E. (ed)] [1–24 ](IAHS Press, Wallingford, UK, 2002). 22. Helms, J. R. et al. Absorption spectral slopes and slope ratios as indicators of
molecular weight, source, and photobleaching of chromophoric dissolved organic matter. Limnol. Oceanogr. 53, 955–969 (2008).
23. Peuravuori, J. & Pihlaja, K. Molecular size distribution and spectroscopic properties of aquatic humic substrances. Anal. Chim. Acta 337, 133–149 (1997). 24. Spencer, R. G. M., Butler, K. D. & Aiken, G. R. Dissolved organic carbon and
chromophoric dissolved organic matter properties of rivers in the USA. J. Geophys. Res. 117, G03001, doi:10.1029/2011JG001928 (2012). 25. Aiken, G. R. et al. Isolation of hydrophobic organic-acids from water using
nonionic macroporous resins. Org. Geochem. 18, 567–573 (1992).
26. McKnight, D. M. & Aiken, G. R. [Sources and age of aquatic humus]. Aquatic Humic Substances [Hessen, D. & TranvikL. (eds)] [9–39] (Springer, Berlin, 1998). 27. Cory, R. M. et al. Chemical characteristics of fulvic acids from Arctic surface
waters:Microbial contributions and photochemical transformations. J. Geophys. Res. 112, G04S51, doi:10.1029/2006JG000343 (2007).
28. Spencer, R. G. M. et al. Utilizing chromophoric dissolved organic matter measurements to derive export and reactivity of dissolved organic carbon exported to the Arctic Ocean: A case study of the Yukon River, Alaska. Geophys. Res. Lett. 36, L06401, doi:10.1029/2008GL036831 (2009).
29. Yamashita, Y. et al. Optical characterization of dissolved organic matter in tropical rivers of the Guayana Shield, Venezuela. J. Geophys. Res. 115, G00F10, doi:10.1029/2009JG000987 (2010).
30. Mann, P. J. et al. Controls on the composition and lability of dissolved organic matter in Siberia’s Kolyma River basin. J. Geophys. Res. 117, G01028, doi:10.1029/ 2011JG001798 (2012).
31. Hernes, J. P. et al. The role of hydrologic regimes on dissolved organic carbon composition in an agricultural watershed. Geochim. Cosmochim. Acta 72, 5266–5277 (2008).
32. Kohn, M. J. Carbon isotope compositions of terrestrial C3 plants as indicators of (paleo)ecology and (paleo)climate. PNAS 107, 19691–19695 (2010).
33. Cerling, T. E., Hart, J. A. & Hart, T. B. Stable isotope ecology of the Ituri Forest. Oecologia 138, 5–12 (2004).
34. Milliman, D. J. & Farnsworth, L. K. River discharge to the coastal ocean: a global synthesis (Cambridge University Press, 2011).
35. Tamooh, F. et al. Distribution and origin of suspended matter and organic carbon pools in the Tana River Basin, Kenya. Biogeosciences 9, 2905–2920; DOI:10.5194/ bg-9-2905-2012 (2012).
36. Meybeck, M. Carbon, nitrogen, and phosphorus transport by world rivers. Am. J. Sci. 282, 401–450 (1982).
37. Garrels, R. M. & Mackenzie, F. T. Evolution of Sedimentary Rocks (W.W. Norton, New York, 1971).
38. Meybeck, M. Global chemical weathering of surficial rocks estimated from river dissolved loads. Am. J. Sci. 287, 401–428 (1987).
39. Gaillardet, J., Dupre´, B. & Alle`gre, C. J. A global mass budget applied to the Congo Basin rivers: erosion rates and continental crust composition. Geochim. Cosmochim. Acta 59, 3469–3485 (1995).
40. Tamooh, F. et al. Dynamics of dissolved inorganic carbon and aquatic metabolism in the Tana River Basin, Kenya. Biogeosciences 10, 6911–6928; DOI:10.5194/bg-10-6911-2013 (2013).
41. Mook, W. G. & Tan, F. C. [Stable carbon isotopes in rivers and estuaries]. Biogeochemistry of Major World Rivers [Degens, E.T., Kempe, S. & Richey, J.E. (eds)] [245–264] (John Wiley, Hoboken, N. J., 1991).
42. Mayorga, E. et al. Young organic matter as a source of carbon dioxide outgassing from Amazonian rivers. Nature 436, 538–541 (2005).
43. Ellis, E. E. et al. Factors controlling water-column respiration in rivers of the central and southwestern Amazon Basin. Limnol. Oceanogr. 57, 527–540 (2012). 44. Lauerwald, R. et al. What controls the spatial patterns of the riverine carbonate
45. Marwick, T. R. et al. Dynamic seasonal nitrogen cycling in response to anthropogenic N-loading in a tropical catchment, the Athi-Galana-Sabaki River, Kenya. Biogeosciences 11, 443–460; DOI:10.5194/bg-11-443-2014 (2014). 46. Kone´, Y. J. M. et al. Seasonal variability of methane in the rivers and lagoons of
Ivory Coast (West Africa). Biogeochemistry 100, 21–37 (2010).
47. Bouillon, S. et al. Distribution, origin and cycling of carbon in the Tana River (Kenya): a dry season basin-scale survey from headwaters to the delta. Biogeosciences 6, 2475–2493; DOI:10.5194/bg-6-2475-2009 (2009).
48. Baulch, H. M. et al. Nitrogen enrichment and the emissons of nitrous oxide from streams. Glob. Biogeochem. Cycles 25, GB4013 (2011).
49. Regnier, P. et al. Anthropogenic perturbation of the carbon fluxes from land to ocean. Nature Geosc 6, 597–607 (2013).
50. Duveiller, G. et al. Deforestation in Central Africa: estimates at regional, national and landscape levels by advanced processing of systematically-distributed Landsat extracts. Remote Sens. Environm. 112, 1969–1981 (2008).
51. Brugie`re, D., Sakom, D. & Gautier-Hion, A. The conservation significance of the proposed Mbae´re´-Bodingue´ national park, Central African Republic, with special emphasis on its primate community. Biodiversity and Conservation 14, 505–522 (2005).
52. Milesi, J. P. et al. An overview of the geology and major ore deposits of Central Africa: Explanatory note for the 1:4,000,000 map ‘‘Geology and major ore deposits of Central Africa’’. J. Afr. Earth Sci. 44, 571–595 (2006).
53. Abril, G., Commarieu, M. V. & Gue´rin, F. Enhanced methane oxidation in an estuarine turbidity maximum. Limnol. Oceanogr. 52, 470–475 (2007). 54. Millero, F. J. The thermodynamics of the carbonic acid system in seawater.
Geochim. Cosmochim. Acta 43, 1651–1661 (1979).
55. Lewis, E. & Wallace, D. W. R. Program developed for CO2system calculations (Carbon Dioxide Information Analysis Center, Oak Ridge National Laboratory, U.S. Department of Energy, Oak Ridge, Tennessee, 1998). Available online at http://cdiac.ornl.gov/oceans/co2rprt.html, accessed February 2014.
56. Gillikin, D. P. & Bouillon, S. Determination of d18O of water and d13C of dissolved inorganic carbon using a simple modification of an elemental analyzer – isotope ratio mass spectrometer (EA-IRMS): an evaluation. Rapid Comm. Mass Spectrom. 21, 1475–1478 (2007).
57. Weiss, F. R. & Price, B. A. Nitrous oxide solubility in water and seawater. Mar. Chem. 8, 347–359 (1980).
58. Yamamoto, S., Alcauskas, J. B. & Crozier, T. E. Solubility of methane in distilled water and seawater. J. Chem. Eng. Data 21, 78–80 (1976).
59. Johannessen, S. C. & Miller, W. L. Quantum yield for the photochemical production of dissolved inorganic carbon in seawater. Mar. Chem. 76, 271–283 (2001).
Acknowledgments
This work was financially supported by the European Research Council (StG 240002: AFRIVAL: ‘‘African river basins: catchment-scale carbon fluxes and transformations’’), two travel grants to S.B. from the Research Foundation Flanders (FWO-Vlaanderen), and a National Geographic Society Research and Exploration Grant (#8885-11) to D.P.G. and S.B. We thank Marc-Vincent Commarieu for analyses of TA, Zita Kelemen for IRMS support, Harold Hughes (Museum for Central Africa, Tervuren, Belgium) and Kristin Coorevits (KU Leuven) for ICP-MS analyses, and Christiane Lancelot for access to the Perkin-Elmer UV/Vis 650S. A.V.B. and T.L. are a senior research associate and postdoctoral researcher, respectively, with the Fonds National de la Recherche Scientifique (FNRS, Belgium). We thank all staff members of the ECOFAC (Ecosystemes Forestiers d’Afrique Centrale) centre in Ngotto for their hospitality and assistance in the field, in particular Denis Passy. A. Coynel and A. Wang kindly provided the raw data of their published work. J. Hartmann and Nils Moosdorf kindly shared their knowledge concerning the lithology of the study catchments.
Author contributions
S.B. and A.V.B. designed the research; S.B., A.Y. and D.P.G. conducted the field sampling, S.B., A.V.B., T.L., C.T. and F.D. analysed samples, S.B. drafted the manuscript with input from A.V.B., A.Y., D.P.G., T.L., C.T. and F.D.
Additional information
Supplementary informationaccompanies this paper at http://www.nature.com/ scientificreports
Competing financial interests:The authors declare no competing financial interests. How to cite this article:Bouillon, S. et al. Contrasting biogeochemical characteristics of the Oubangui River and tributaries (Congo River basin). Sci. Rep. 4, 5402; DOI:10.1038/ srep05402 (2014).
This work is licensed under a Creative Commons Attribution-NonCommercial-NoDerivs 4.0 International License. The images or other third party material in this article are included in the article’s Creative Commons license, unless indicated otherwise in the credit line; if the material is not included under the Creative Commons license, users will need to obtain permission from the license holder in order to reproduce the material. To view a copy of this license, visit http:// creativecommons.org/licenses/by-nc-nd/4.0/
Steven Bouillon, Athanase Yambélé, David P. Gillikin, Cristian Teodoru, François Darchambeau, Thibault Lambert, and
3
Alberto V. Borges.
4
DOC (mg L
-1)
0
1
2
3
4
5
6
7
8
a
350(m
-1)
0
5
10
15
20
25
30
35
40
a
350= 12.444 x DOC + 7.252
R² = 0.908
5
Figure S1: Relationship between DOC concentrations and a350 for all sites in the Oubangui tributaries sampled in 2012 and 2013. This relationship was used
6
to estimate DOC concentrations and the annual flux of DOC in the mainstam Oubangui for the 2nd year of monitoring, when no direct DOC measurements are
7
available. The relationship shown here is consistent with other data collected throughout the Congo basin (own unpublished data).
Supplementary Table 1: Comparison of concentrations and δ C signatures of dissolved organic carbon (DOC) on samples prepared by (i) immediately
10
preserving samples filtered through 0.7 µm GF/F filters, and (ii) preservation after further filtration through 0.2 µm syringe filters. No significant differences
11
were found for either DOC concentrations or δ13
CDOC (paired t-test).
12
13
Site (March 2011 samples) [DOC], 0.2 µm [DOC], 0.7 µm 13CDOC, 0.2 µm
13
CDOC, 0.7 µm
Imbalataka (tributary of Mbaéré) 1.27 1.40 -29.9 -30.0
Mbaéré 1.50 1.54 -29.7 -29.0
Mbaéré 1.66 1.74 -29.9 -29.6
Kélé (tributary of Mbaéré) 4.45 4.41 -30.2 -30.3
Lubé (left bank tributary of Lobaye) 5.50 5.46 -27.1 -26.4
Lobaye 1.93 1.76 -28.2 -28.7
Mamboussou (right bank tributary of Lobaye) 12.23 12.10 -29.2 -29.1
Lobaye 2.06 1.98 -28.6 -28.6
Ibéléké (right bank tributary of Lobaye) 3.24 3.29 -29.7 -29.8
Mbaéré, after confluence with Bodingué 2.42 2.32 -30.0 -29.8
Lobaye, dowstream of confluence with Mbaéré 1.90 1.89 -29.0 -29.0
Lobaye 1.74 1.72 -27.3 -28.3
Lobaye 1.93 2.00 -28.7 -28.4
Bodingué 4.30 4.29 -30.1 -30.0
Mbaéré, after confluence with Bodingué 3.46 3.50 -29.9 -29.9
March 2012. Date Discharge (m³ s-1) T (°C) %O2 Specific conductivity (µS cm-1)
pH (NBS scale) TSM (mg L-1) 13C-DIC (‰) POC (mg L-1) PN (mg L-1) POC/PN
(weight) %POC 14/04/2011 421 29.3 72.3 7.85 2.4 -8.7 0.462 0.060 7.7 19.3 28/04/2011 505 30.0 74.1 7.93 3.0 -7.8 0.548 0.069 7.9 18.5 14/05/2011 717 30.2 115.1 67.0 8.00 4.5 0.816 0.101 8.1 18.0 28/05/2011 859 30.1 97.8 63.4 8.23 12.3 -5.8 1.884 0.293 6.4 15.4 16/06/2011 1180 29.9 97.1 60.0 7.52 8.0 -7.3 0.839 0.122 6.9 10.5 28/06/2011 1395 29.6 93.9 53.8 7.32 8.8 -9.1 0.835 0.125 6.7 9.5 13/07/2011 1214 28.9 90.2 49.2 7.48 6.7 -13.1 0.690 0.102 6.8 10.2 30/07/2011 1377 29.6 96.5 44.0 7.44 10.6 1.043 0.142 7.4 9.9 13/08/2011 2046 28.2 94.4 41.5 7.25 20.3 -11.2 1.122 0.178 6.3 5.5 30/08/2011 3206 28.6 72.4 37.7 6.96 30.7 -13.7 1.399 0.190 7.4 4.6 10/09/2011 3528 28.1 72.3 35.1 6.89 32.9 -13.4 1.604 0.172 9.3 4.9 25/09/2011 4602 28.4 72.0 35.0 6.75 30.1 -15.6 1.422 0.161 8.8 4.7 15/10/2011 6266 27.8 84.2 32.1 6.69 31.2 -14.4 1.365 0.138 9.9 4.4 29/10/2011 7688 27.2 85.3 31.3 6.72 26.1 -15.0 1.246 0.121 10.3 4.8 12/11/2011 7128 28.2 83.0 30.8 6.56 23.9 1.380 0.136 10.2 5.8 26/11/2011 5725 28.0 87.6 30.6 6.80 18.7 -14.1 1.102 0.106 10.4 5.9 10/12/2011 3432 26.9 92.5 31.9 6.86 20.7 -12.1 1.313 0.139 9.4 6.3 24/12/2011 1972 27.4 93.0 35.6 7.07 15.1 -9.9 0.808 0.118 6.8 5.3 14/01/2012 1248 25.1 98.0 40.7 7.28 6.3 -8.6 0.603 0.091 6.6 9.6 28/01/2012 922 27.1 99.5 45.5 7.47 2.7 -8.7 0.370 0.059 6.2 13.9 11/02/2012 654 28.4 96.5 51.4 7.48 2.8 -8.9 0.350 0.055 6.4 12.5 24/02/2012 544 29.3 99.0 56.2 7.91 3.5 -8.5 0.483 0.075 6.5 13.9 10/03/2012 401 29.3 99.7 61.9 7.92 2.4 -8.4 0.437 0.072 6.1 18.2 31/03/2012 293 29.1 96.2 71.1 7.62 2.4 -8.2 0.501 0.084 6.0 20.9
Date
13C-POC (‰)
TA (mmol L
-1)
DIC (mmol L
-1)
pCO
2(ppm)
N
2O (nmol L
-1)
CH
4(nmol L
-1)
Ca (µM)
Mg (µM)
Si (µM)
14/04/2011 -29.2 0.686 0.696
487
7.2 126.7 162.0 123.0 180.0 28/04/2011 -28.8 0.699 0.699289
8.5 138.5 170.7 124.3 175.4 14/05/2011 -28.9 0.636 0.6761373
6.4 341.3 148.5 111.5 154.7 28/05/2011 -27.2 0.592 0.6511990
7.3 450.6 135.9 105.4 35.1 16/06/2011 -29.8 0.536 0.5721226
6.6 324.5 132.2 100.1 148.3 28/06/2011 -29.1 0.485 0.5211239
6.4 261.8 111.7 89.4 171.5 13/07/2011 -29.2 0.429 0.458 981 6.7 234.1 107.0 70.4 218.8 30/07/2011 -28.5 0.366 0.393 935 6.2 230.4 97.4 61.1 202.1 13/08/2011 -28.4 0.346 0.388 1356 8.4 187.5 89.9 55.4 177.4 30/08/2011 -27.0 0.308 0.380 2341 11.7 147.0 85.3 48.1 219.6 10/09/2011 -26.6 0.265 0.339 2379 9.3 122.4 82.9 42.3 224.3 25/09/2011 -26.4 0.307 0.425 3810 8.2 127.7 75.6 44.9 223.7 15/10/2011 -26.3 0.293 0.423 4114 8.8 101.6 63.9 45.7 237.6 29/10/2011 -26.2 0.283 0.401 3679 8.1 105.2 67.4 44.3 239.3 12/11/2011 -26.7 0.266 0.426 5123 7.8 80.5 65.7 45.8 238.5 26/11/2011 -27.5 0.271 0.364 2958 7.6 91.9 63.0 43.9 242.0 10/12/2011 -28.0 0.288 0.375 2704 7.5 96.0 66.6 44.9 245.9 24/12/2011 -28.7 0.333 0.394 1934 6.7 94.3 75.4 52.9 233.1 14/01/2012 -29.9 0.386 0.430 1327 7.3 88.8 87.9 63.2 225.0 28/01/2012 -31.2 0.434 0.465 997 6.9 80.2 104.9 75.1 234.8 11/02/2012 -30.6 0.478 0.511 1088 6.5 79.4 119.3 85.4 231.7 24/02/2012 -29.5 0.523 0.533 451 6.6 128.2 135.1 92.7 218.5 10/03/2012 -29.1 0.579 0.590 481 6.3 137.5 146.5 103.2 212.1 31/03/2012 -29.5 0.663 0.695 1116 6.1 159.3 180.9 119.7 181.0Supplementary Table 3 : Full dataset on physico-chemical and biogeochemical data collected in various tributaries of the Oubangui during 3 field campaings
between 2010 and 2012.
Date River / Site
Latitude (decimal degrees) Longitude (decimal degrees) T (°C) %O2 Specific conductivity (µS cm-1) pH (NBS scale) TSM (mg L
-1) 13C-DIC (‰) POC (mg L-1) PN (mg L-1) POC/PN
(weight) %POC 13 C-POC (‰) 21/03/2010 Mbali River 4.91439 18.00844 24.4 98.5 31.7 6.73 2.7 -11.1 0.277 0.034 8.1 12.3 -29.4 21/03/2010 Mbali River 4.66550 18.22128 26.7 88.4 52.8 7.39 3.1 -10.4 0.372 0.032 11.8 8.5 -27.5 21/03/2010 Mpoko River 4.32442 18.51167 29.1 78.2 170.2 7.59 77.0 -10.5 1.689 0.232 7.3 13.8 -22.8
22/03/2010 Lobaye, ferry point 4.05069 17.34492 26.4 94.6 13.0 6.45 15.0 -15.3 1.092 0.106 10.3 9.7 -28.1
23/03/2010 Lobaye, bridge 4.17358 17.22372 25.5 90.9 12.6 6.41 17.2 -16.2 1.427 0.121 11.8 8.5 -27.8
21/03/2011 Lobaye 4.07166 17.30829 25.5 98.7 11.9 6.90 14.4 -14.7 1.334 0.110 12.1 9.3 -28.8
21/03/2011 Lobaye 4.10503 17.29411 25.8 99.4 11.9 6.94 12.6 -13.9 1.158 0.099 11.7 9.2 -29.0
22/03/2011 Lobaye, after confluence with Mbaéré 3.75407 17.52856 26.2 91.7 11.3 6.63 10.4 -15.9 0.997 0.086 11.6 9.5 -29.3
22/03/2011 Lobaye 3.79562 17.49983 26.8 97 16.3 6.74 16.4 -13.8 1.426 0.136 10.5 8.7 -29.0 22/03/2011 Lobaye 3.87487 17.47599 26.6 99.5 13.1 6.98 12.8 -14.2 1.290 0.119 10.9 10.1 -29.0 20/11/2012 Lobaye 4.07166 17.30829 24.7 92 16.2 6.68 8.8 -18.0 1.057 0.075 14.1 12.1 -29.0 21/11/2012 Lobaye 3.92850 17.43455 25.1 92.1 18.3 6.84 6.6 -16.0 0.990 0.110 9.0 15.1 -29.3 21/11/2012 Lobaye 3.87355 17.46859 25.2 92.6 18.5 6.75 6.9 -18.1 1.124 0.241 4.7 16.2 -28.8 22/11/2012 Lobaye 3.79557 17.49878 25.5 91.8 21.3 6.79 12.4 -16.3 1.015 0.101 10.0 8.2 -29.1
22/11/2012 Lobaye, dowstream of confluence with Mbaéré 3.75726 17.53485 25.3 69.3 13.2 6.01 5.2 -20.7 0.648 0.062 10.5 12.4 -29.4
23/03/2010 Mbaére, bridge 3.94450 17.02500 24.5 63.2 8.2 5.56 5.5 -23.6 0.627 0.054 11.6 8.6 -29.3 20/03/2011 Mbaéré 3.90394 17.11073 25.5 64.4 7.6 6.26 5.6 -21.2 1.132 0.102 11.0 20.2 -29.7 20/03/2011 Mbaéré 3.89716 17.15729 25.3 79.4 7.9 6.27 8.6 -21.3 1.494 0.117 12.7 17.4 -30.0 23/03/2011 Mbaéré 3.80638 17.32200 25.7 80 8.4 5.71 6.4 -22.6 0.914 0.074 12.3 14.3 -30.5 23/03/2011 Mbaéré 3.84314 17.26092 25.6 79 8.1 5.70 6.6 -22.8 1.354 0.099 13.7 20.5 -30.2 23/11/2012 Mbaéré 3.89735 17.15737 24.7 51 8.1 5.30 1.2 -28.1 0.432 0.029 14.8 36.0 -29.8
22/03/2011 Mbaéré, after confluence with Bodingué 3.75467 17.51074 25.6 83 7.8 5.98 3.9 -22.1 0.888 0.071 12.5 23.0 -30.5
23/03/2011 Mbaéré, after confluence with Bodingué 3.75558 17.38182 25.7 80.5 8.7 5.62 5.6 -23.2 0.921 0.074 12.5 16.4 -30.7
22/11/2012 Mbaéré, after confluence with Bodingué 3.75453 17.51075 24.2 48.1 9.7 4.88 1.1 -26.5 0.348 0.024 14.4 30.5 -30.1
20/03/2011 Imbalataka (tributary of Mbaéré) 3.90408 17.11038 23.3 66.1 11.7 5.75 3.5 -22.9 0.903 0.079 11.4 26.1 -29.1
20/03/2011 Kélé (tributary of Mbaéré) 3.90082 17.15848 23 84.8 15.2 5.02 4.4 -24.1 1.821 0.137 13.3 41.4 -30.5
23/11/2012 Kélé (tributary of Mbaéré) 3.90075 17.15847 25.2 91.2 12.2 4.94 0.7 -22.5 0.408 0.038 10.7 55.1 -30.7
23/03/2011 Bodingué 3.75596 17.37455 25.4 76.8 8.8 5.31 2.1 -24.5 0.561 0.041 13.6 26.7 -31.2
21/03/2011 Mamboussou (right bank tributary of Lobaye) 4.08135 17.30740 22.8 90 36.6 6.86 38.3 -15.7 3.221 0.307 10.5 8.4 -29.2
20/11/2012 Mamboussou (right bank tributary of Lobaye) 4.08147 17.30735 22.4 87.5 52.6 7.13 28.2 -13.2 3.315 0.259 12.8 11.8 -29.1
21/03/2011 Ibéléké (right bank tributary of Lobaye) 4.02745 17.32564 24.8 85 6.50 10.4 -18.9 1.858 0.192 9.7 17.9 -30.0
24/11/2012 Ibéléké (right bank tributary of Lobaye) 4.02745 17.32564 23.3 93.5 20.0 6.26 14.1 -16.4 2.176 0.205 10.6 15.4 -30.2
21/03/2011 Lubé (left bank tributary of Lobaye) 4.06681 17.32090 23 90.6 97.1 7.25 44.4 -12.6 2.131 0.226 9.4 4.8 -25.8
20/11/2012 Unnamed left bank tributary of the Lobaye 4.06685 17.32090 23.5 87.2 99.5 7.42 35.9 -11.7 1.350 0.120 11.2 3.8 -25.8
21/11/2012 Ngilingala (left bank tributary of the Lobaye) 4.00858 17.38897 22.8 90.8 95.1 7.50 34.2 -13.4 1.275 0.118 10.8 3.7 -26.3
21/11/2012 Unnamed left bank tributary of Lobaye 3.96712 17.41333 23.6 88.4 87.7 7.09 9.4 -14.1 0.746 0.052 14.3 8.0 -29.3
21/03/2010 Mbali River 2.2 0.275 0.390 3350 6.4 1652 49.8 36.8 212.5
21/03/2010 Mbali River 2.1 0.538 0.585 1476 7.3 452
21/03/2010 Mpoko River 3.3 1.791 1.886 3253 9.3 779 469.2 311.3 271.8
22/03/2010 Lobaye, ferry point 2.5 0.131 0.234 3160 7.3 422 26.6 15.7 211.7
23/03/2010 Lobaye, bridge 4.4 0.119 0.222 3060 7.3 324
21/03/2011 Lobaye 1.93 -28.2 0.118 0.151 981 8.3 358 25.1 15.0 203.9
21/03/2011 Lobaye 2.06 -28.6 0.113 0.142 870 8.4 252 24.9 15.0 210.3
22/03/2011 Lobaye, after confluence with Mbaéré 1.90 -29.0 0.119 0.181 1881 9.8 315 27.8 17.4 200.7
22/03/2011 Lobaye 1.74 -27.3 0.148 0.207 1822 9.0 321 36.4 22.7 211.4 22/03/2011 Lobaye 1.93 -28.7 0.126 0.155 887 8.8 291 27.2 17.2 212.8 20/11/2012 Lobaye 3.10 -28.4 0.161 0.236 2202 7.3 256 39.0 20.2 223.7 21/11/2012 Lobaye 3.25 -28.1 0.189 0.250 1796 7.5 451 42.4 23.3 230.8 21/11/2012 Lobaye 3.23 -28.1 0.184 0.258 2185 7.4 388 44.3 23.3 237.7 22/11/2012 Lobaye 2.99 -28.4 0.208 0.283 2237 7.8 686 54.1 29.4 233.4
22/11/2012 Lobaye, dowstream of confluence with Mbaéré 5.04 -29.7 0.107 0.343 6990 7.2 457 37.0 16.6 217.0
23/03/2010 Mbaére, bridge 4.4 0.059 0.447 11180 8.7 730 14.0 8.3 180.3 20/03/2011 Mbaéré 1.50 -29.7 0.060 0.135 2203 14.2 7.9 179.6 20/03/2011 Mbaéré 1.66 -29.9 0.058 0.130 2104 10.0 711 14.5 7.9 174.3 23/03/2011 Mbaéré 2.95 -29.7 0.059 0.325 7911 10.0 515 14.3 8.6 182.4 23/03/2011 Mbaéré 2.60 -29.9 0.055 0.313 7631 10.0 561 14.1 8.3 183.1 23/11/2012 Mbaéré 5.71 -30.3 0.037 0.515 13813 7.1 516 20.4 7.1 171.7
22/03/2011 Mbaéré, after confluence with Bodingué 2.42 -30.0 0.061 0.207 4318 10.9 365 13.7 8.3 209.4
23/03/2011 Mbaéré, after confluence with Bodingué 3.46 -29.9 0.050 0.331 8347 10.2 418 15.2 8.7 179.6
22/11/2012 Mbaéré, after confluence with Bodingué 7.10 -30.4 0.026 1.201 33500 7.8 451 18.6 6.1 168.0
20/03/2011 Imbalataka (tributary of Mbaéré) 1.27 -29.9 0.034 0.180 4045 13.0 374 18.7 12.4 167.3
20/03/2011 Kélé (tributary of Mbaéré) 4.45 -30.2 0.029 0.875 23255 26.7 254 14.5 9.4 136.6
23/11/2012 Kélé (tributary of Mbaéré) 0.76 -30.6 0.009 0.556 15849 26.2 107 23.8 7.3 158.8
23/03/2011 Bodingué 4.30 -30.1 0.038 0.517 14070 11.5 442 13.4 8.7 175.4
21/03/2011 Mamboussou (right bank tributary of Lobaye) 12.23 -29.2 0.256 0.337 2237 10.8 1213 69.3 47.4 341.8
20/11/2012 Mamboussou (right bank tributary of Lobaye) 6.02 -29.5 0.512 0.600 2432 8.2 1275 108.6 79.8 407.9
21/03/2011 Ibéléké (right bank tributary of Lobaye) 3.24 -29.7 0.111 0.191 2334 9.5 2587 22.1 17.1 209.1
24/11/2012 Ibéléké (right bank tributary of Lobaye) 3.16 -30.1 0.164 0.374 5897 8.4 2168 41.2 24.0 224.3
21/03/2011 Lubé (left bank tributary of Lobaye) 5.50 -27.1 0.903 1.020 3271 10.6 821 190.9 157.6 490.1
20/11/2012 Unnamed left bank tributary of the Lobaye 3.43 -27.0 0.991 1.075 2412 8.3 917 181.9 167.7 545.2
21/11/2012 Ngilingala (left bank tributary of the Lobaye) 3.74 -28.1 0.948 1.016 1927 8.5 1045 175.0 191.8 560.9
21/11/2012 Unnamed left bank tributary of Lobaye 3.11 -28.3 0.714 0.846 3768 9.4 2911 149.1 141.6 436.1
21/11/2012 Loamé (left bank tributary of Lobaye) 2.75 -28.3 0.664 0.743 2363 8.5 726 166.0 114.2 303.8