https://doi.org/10.4224/20386772
READ THESE TERMS AND CONDITIONS CAREFULLY BEFORE USING THIS WEBSITE. https://nrc-publications.canada.ca/eng/copyright
Vous avez des questions? Nous pouvons vous aider. Pour communiquer directement avec un auteur, consultez la première page de la revue dans laquelle son article a été publié afin de trouver ses coordonnées. Si vous n’arrivez pas à les repérer, communiquez avec nous à [email protected].
Questions? Contact the NRC Publications Archive team at
[email protected]. If you wish to email the authors directly, please see the first page of the publication for their contact information.
NRC Publications Archive
Archives des publications du CNRC
For the publisher’s version, please access the DOI link below./ Pour consulter la version de l’éditeur, utilisez le lien DOI ci-dessous.
Access and use of this website and the material on it are subject to the Terms and Conditions set forth at
Adhesion testing procedure for hot-poured crack sealants
Al-Qadi, I. L.; Fini, E. H.; Figueroa, H. D.; Masson, J.-F.; McGhee, K. K.
https://publications-cnrc.canada.ca/fra/droits
L’accès à ce site Web et l’utilisation de son contenu sont assujettis aux conditions présentées dans le site LISEZ CES CONDITIONS ATTENTIVEMENT AVANT D’UTILISER CE SITE WEB.
NRC Publications Record / Notice d'Archives des publications de CNRC:
https://nrc-publications.canada.ca/eng/view/object/?id=9e224025-37af-46f6-a9c3-86ea1e89ba36 https://publications-cnrc.canada.ca/fra/voir/objet/?id=9e224025-37af-46f6-a9c3-86ea1e89ba36
http://www.nrc-cnrc.gc.ca/irc
Adhe sion t e st ing proc e dure for hot -poure d c ra c k se a la nt s
N R C C - 5 3 2 5 6
A l - Q a d i , I . L . ; F i n i , E . H . ; F i g u e r o a , H . D . ;
M a s s o n , J . - F . ; M c G h e e , K . K .
M a r c h 2 0 1 0
A version of this document is published in / Une version de ce document se trouve dans:
Illinois Center for Transportation, pp. 73, November 01, 2008
The material in this document is covered by the provisions of the Copyright Act, by Canadian laws, policies, regulations and international agreements. Such provisions serve to identify the information source and, in specific instances, to prohibit reproduction of materials without written permission. For more information visit http://laws.justice.gc.ca/en/showtdm/cs/C-42
Les renseignements dans ce document sont protégés par la Loi sur le droit d'auteur, par les lois, les politiques et les règlements du Canada et des accords internationaux. Ces dispositions permettent d'identifier la source de l'information et, dans certains cas, d'interdire la copie de documents sans permission écrite. Pour obtenir de plus amples renseignements : http://lois.justice.gc.ca/fr/showtdm/cs/C-42
A
DHESION
T
ESTING
P
ROCEDURE
FOR
H
OT
-P
OURED
C
RACK
S
EALANTS
Prepared By
Imad L. Al-Qadi
Eli H. Fini
University of Illinois at Urbana-Champaign
Hector D. Figueroa
Quality Engineering Solutions
Jean-François Masson
National Research Council of Canada
Kevin K. McGhee
Virginia Transportation Research Council
Research Report ICT-08-026
Illinois Center for Transportation
November 2008
CIVIL ENGINEERING STUDIES
Illinois Center for Transportation Series No. 08-026 UILU-ENG-2008-2014
Technical Report Documentation Page
1. Report No. ICT-08-026
2. Government Accession No. 3. Recipient's Catalog No.
4. Title and Subtitle
ADHESION TESTING PROCEDURE FOR HOT-POURED CRACK SEALANTS
5. Report Date November 2008
6. Performing Organization Code
8. Performing Organization Report N o. 7. Author(s)
Imad Al-Qadi, Eli Fini, Hector Figueroa, and Jean-Francois Masson ICT-08-026 UILU-ENG-2008-2014
9. Performing Organization Name and Address University of Illinois at Urbana Champaign
Department of Civil and Environmental Engineering 205 N. Mathews Ave, MC-250
Urbana, Illinois 61081
10. Work Unit ( TRAIS)
11. Contract or Grant No. VTRC Project # 67775 TPF-5(045)
13. Type of Report and Period Covered Technical Report
12. Sponsoring Agency Name and Address Federal Highway Administration 400 North 8th Street, Room 750 Richmond, VA 23219-4825
Virginia DOT – Lead State 1401 E. Broad St
Richmond, VA 23219
14. Sponsoring Agency Code
15. Supplementary Notes
16. Abstract
Crack sealing is a common pavement maintenance treatment because it extends pavement service life significantly. However, crack sealant often fails prematurely due to a loss of adhesion. Because current test methods are mostly empirical and only provide a qualitative measure of bond strength, they cannot predict sealant adhesive failure accurately. Hence, there is an urgent need for test methods based on bituminous sealant rheology that can better predict sealant field performance. This study introduces three laboratory tests aimed to assess the bond property of hot-poured crack sealant to pavement crack walls. The three tests are designed to serve the respective needs of producers, engineers, and
researchers. The first test implements the principle of surface energy to measure the thermodynamic work of adhesion, which is the energy spent in separating the two materials at the interface. The work of adhesion is reported as a measure of material compatibility at an interface. The second test is a direct adhesion test, a mechanical test which is designed to closely resemble both the installation process and the crack expansion due to thermal loading. This test uses the Direct Tensile Test (DTT) machine. The principle of the test is to apply a tensile force to detach the sealant from its aggregate counterpart. The maximum load, Pmax, and the energy to separation, E, are calculated and reported to indicate interface bonding. The third test implements the principles of fracture mechanics in a pressurized circular blister test. The apparatus is specifically designed to conduct the test for bituminous crack sealant, asphalt binder, or other bitumen-based materials. In this test, a fluid is injected at a constant rate at the interface between the substrate (aggregate or a standard material) and the adhesive (crack sealant) to create a blister. The fluid pressure and blister height are measured as functions of time; the data is used to calculate Interfacial Fracture Energy (IFE), which is a fundamental property that can be used to predict adhesion. The stable interface debonding process makes this test attractive. This test may also provide a means to quantify other factors, such as the moisture susceptibility of a bond. In addition, the elastic modulus of the sealant and its residual stresses can be determined analytically. While the direct adhesion test is proposed as part of a newly developed
performance-based guideline for the selection of hot-poured crack sealant, the blister test can be used to estimate the optimum annealing time and installation temperature.
17. Key Words 18. Distribution Statement
No restrictions. This document is available to the public through the National Technical Information Service, Springfield, Virginia 22161.
ACKNOWLEDGEMENT
The research on the Development of Performance-Based Guidelines for the
Selection of Bituminous–Based Hot-Poured Pavement Crack Sealants is sponsored by the Federal Highway Administration “pooled-fund study TPF5 (045)” and the US-Canadian Crack Sealant Consortium. The contribution of the participating states, industry, and provinces is acknowledged. This report is part of a series of reports that resulted from this study. Four reports were published by the Illinois Center for Transportation:
Al-Qadi, I.L., E.H. Fini, H.D. Figueroa, J.-F Masson, and K.K. McGhee, Adhesion Testing Procedure for Hot-Poured Crack Sealants, Final Report, No. ICT-08-026, Illinois Center for Transportation, Rantoul, IL, Dec 2008, 103 p.
Al-Qadi, I.L., E.H. Fini, J.-F Masson, A. Loulizi, K.K. McGhee, M.A. Elseifi,
Development of Apparent Viscosity Test for Hot-Poured Crack Sealants, Final Report, No. ICT-08-027, Illinois Center for Transportation, Rantoul, IL, Dec 2008, 41 p.
Al-Qadi, I.L., S.-H. Yang, J.-F. Masson, and K.K. McGhee, Characterization of Low Temperature Mechanical Properties of Crack Sealants Utilizing Direct Tension Test, Final Report, No. ICT-08-028, Illinois Center for Transportation, Rantoul, IL, Dec 2008, 70 p.
Al-Qadi, I.L., S.-H. Yang, M.A. Elseifi, S. Dessouky, A. Loulizi, J.-F. Masson, and K.K. McGhee, Characterization of Low Temperature Creep Properties of Crack Sealants Using Bending Beam Rheometry, Final Report, No. ICT-08-029, Illinois Center for Transportation, Rantoul, IL, Dec 2008, 81 p.
Two internal reports on aging and sealant characterization were published by the National Research Council of Canada and a summary can be found in the following papers):
Collins, P., Veitch, M., Masson, J-F., Al-Qadi, I. L., Deformation and Tracking of Bituminous Sealants in Summer Temperatures: Pseudo-field Behaviour,
International Journal of Pavement Engineering, Vol. 9, No. 1, 2008, pp. 1-8.
Masson, J-F., Woods, J. R., Collins, P., Al-Qadi, I. L., Accelerated Aging of Bituminous Sealants: Small-kettle Aging, International Journal of Pavement
Engineering, Vol. 9, No. 5, 2008, pp. 365-371.
In addition, an executive summary report of the study was published by the Virginia Transportation Research Council (the leading state of the study):
Al-Qadi, I. L. J-F. Masson, S-H. Yang, E. Fini, and K. K. McGhee, Development of Performance-Based Guidelines for Selection of Bituminous-Based Hot-Poured Pavement Crack Sealant: An Executive Summary Report, Final Report, No. VTRC 09-CR7, Virginia Department of Transportation, Charlottesville, VA, 2008, 40 p.
DISCLAIMER
The project that is the subject of this report was completed under contract with the Virginia Transportation Research Council, which served as lead-state coordinator and project monitor for the partner states of Connecticut, Georgia, Maine, Michigan, Minnesota, New Hampshire, New York, Rhode Island, Texas, and Virginia. The contents of this report reflect the views of the authors, who are responsible for the facts and the accuracy of the data presented herein. The contents do not necessarily reflect the official views or policies of the Virginia Transportation Research Council, the partnering states, the Illinois Center for Transportation, the Illinois Department of Transportation, the Federal Highway
Administration, or the remaining members of the Crack Sealant Consortium. This report does not constitute a standard, specification, or regulation. Any inclusion of manufacturer names, trade names, or trademarks is for identification purposes only and is not to be considered an endorsement.
EXECUTIVE SUMMARY
Crack sealing is a common pavement maintenance treatment because it extends pavement service life significantly. However, crack sealant often fails prematurely due to a loss of adhesion. Because current test methods are mostly empirical and only provide a qualitative measure of bond strength, they cannot predict sealant adhesive failure accurately. Hence, there is an urgent need for test methods based on bituminous sealant rheology that can better predict sealant field performance. This study introduces three laboratory tests aimed to assess the bond property of hot-poured crack sealant to pavement crack walls. The three tests are designed to serve the respective needs of producers, engineers, and researchers. The first test implements the principle of surface energy to measure the thermodynamic work of adhesion, which is the energy spent in separating the two materials at the interface. The work of adhesion is reported as a measure of material compatibility at an interface. The second test is a direct adhesion test, a mechanical test which is designed to closely resemble both the installation process and the crack expansion due to thermal loading. This test uses the Direct Tensile Test (DTT) machine. The principle of the test is to apply a tensile force to detach the sealant from its aggregate counterpart. The maximum load, Pmax, and the energy to separation, E, are calculated and reported to indicate interface
bonding. The third test implements the principles of fracture mechanics in a pressurized circular blister test. The apparatus is specifically designed to conduct the test for bituminous crack sealant, asphalt binder, or other bitumen-based materials. In this test, a fluid is
injected at a constant rate at the interface between the substrate (aggregate or a standard material) and the adhesive (crack sealant) to create a blister. The fluid pressure and blister height are measured as functions of time; the data is used to calculate Interfacial Fracture Energy (IFE), which is a fundamental property that can be used to predict adhesion. The stable interface debonding process makes this test attractive. This test may also provide a means to quantify other factors, such as the moisture susceptibility of a bond. In addition, the elastic modulus of the sealant and its residual stresses can be determined analytically. While the direct adhesion test is proposed as part of a newly developed performance-based guideline for the selection of hot-poured crack sealant, the blister test can be used to
TABLE OF CONTENTS
INTRODUCTION ... 1
PURPOSE AND SCOPE ... 3
METHODS ... 3
SURFACE ENERGY METHOD ... 3
Experimental Program ... 5
Summary of the Surface Energy Method ... 7
DIRECT ADHESION TEST METHOD (DAT) ... 8
Feasibility Studies ... 10
Selecting the End Pieces ... 12
Experimental Program ... 13
Variation within Laboratories ... 15
Variation between Sealants ... 17
Variation of Pmax with Substrates ... 21
Summary of the Direct Adhesion Tester ... 21
FRACTURE MECHANICS APPROACH ... 23
Peel Test ... 24
Blister Test ... 24
Theoretical Background ... 25
Apparatus and Experimental Method ... 26
Analysis Approach and Discussion ... 31
Determining IFE as a Bonding Index ... 36
Feasibility Study ... 39
Substrate Selection ... 41
Optimum Cooling Time ... 45
Orifice Size ... 48
Adhesive Thickness ... 48
Reversible Deformation ... 49
Experimental Program ... 49
EFFECT OF AGING ... 50
VARIATION WITHIN LABORATORIES ... 54
EFFECT OF SEALANT VISCOSITY ON BONDING ... 55
VARIATION OF VISCOSITY WITH TEMPERATURE ... 55
EFFECT OF ANNEALING TIME ON BONDING ... 58
EFFECT OF LOADING RATE ON BONDING ... 59
SUMMARY OF THE BLISTER TEST ... 62
FIELD COMPARISON ... 63
RESULTS AND CONCLUSION ... 66
RECOMMENDATIONS ... 67
REFERENCES ... 68 APPENDIX (A) ... A1
GLASS TRANSITION TEMPERATURE ... A1
APPENDIX (B) ... B1
GUIDELINES FOR MEASURING ADHESION OF HOT-POURED CRACK SEALANT USING A DIRECT
ADHESION TEST (DAT) ... B1
APPENDIX (C) ... C1
GUIDELINES FOR MEASURING ADHESION OF HOT-POURED CRACK SEALANT USING A BLISTER
FINAL CONTRACT REPORT
ADHESION TESTING PROCEDURE FOR HOT-POURED CRACK SEALANTS
Imad L. Al-Qadi
Founder Professor of Engineering Illinois Center for Transportation, Director University of Illinois at Urbana-Champaign
Jean-François Masson Senior Research Officer
Institute for Research in Construction National Research Council of Canada
INTRODUCTION
Approximately 60 percent of the nation’s annual transportation budget is spent on pavement maintenance. Crack sealing is one of the most common pavement maintenance treatments because it can significantly extend the pavement service life if the appropriate sealant is used and properly installed. Hot-poured, bituminous-based crack sealant failure can be divided into two general classifications: (i) the separation of the sealant from itself (cohesive fracture) and (ii) the separation of a sealant from the crack walls at the bond line between the two materials (adhesive fracture). Cohesive failure of bituminous crack sealants, which relates to bulk properties of the material, has long been characterized by
manufacturers and, therefore, this type of failure rarely occurs in cold weather conditions. However, adhesive failure, which relates to debonding near the sealant and hot-mix asphalt (HMA) interface, has not been well researched though it has been recognized as the major failure mode for bituminous crack sealants (Masson et al., 2000). Unfortunately, sealant field performance cannot be predicted because current available testing methods (ASTM D6690) are mostly empirical. The available tests generally provide a qualitative measure of the bonding based on a geometric parameter. Hence testing methods are needed that are based on the sealant’s rheology and surface characteristics, which are capable of predicting field performance. The objective of this project is to develop a laboratory testing approach to predict the adhesion of crack sealant to aggregate at service temperatures ranging from -4ºC to -40ºC.
Adhesion is a fundamental property which directly depends on interatomic and intermolecular forces between the adhesive (sealant) and HMA. It has also been shown that sealant adhesion depends on aggregate composition, with adhesion to siliceous aggregates half that obtained for limestone (Masson et al., 2000). In addition, factors such as
temperature, sealant geometry, and sealant bulk properties have all been reported to influence adhesion characteristics. In this project, all tests were conducted at a temperature ranging from -4ºC to -40ºC. To conduct a test at such low temperatures, alcohol was
selected as a fluid medium. Alcohol was selected because it has a relatively low freezing temperature, is nearly incompressible, and does not react with sealant specimens during testing or limited conditioning period
Several research studies have investigated the effect of surface energy on sealant-aggregate adhesion. Cheng et al. (2001) measured the thermodynamic surface-free energy
of aggregates using the universal sorption device. They used a surface energy approach to evaluate adhesive fracture and moisture damage characteristics within the
asphalt-aggregate system and argued that knowing the surface energy of the asphalt and aggregates would lead to the selection of the most compatible asphalt-aggregate combination with the best ability to resist adhesion failure. Bhasin et al. (2006) used the same approach to quantify the adhesive bond energy between the aggregate and asphalt. They observed significant differences in the bond energies developed between various aggregates and a given binder. This study showed that the bonding in reality is generally several orders of magnitude higher than the bond energy derived through this approach; this difference is attributed to dissipative contributions (Galerie et al., 2004). While the measured work of adhesion does not measure the real bonding, it can serve to define compatible pairs among different combinations of sealant-aggregate.
Many mechanical testing methodologies have been used to measure adhesion. Masson and Lacasse (1999) used both a small-scale and a full-scale adhesion test to measure the level of sealant adhesion to heat-treated substrates. Using a direct tension tester (DTT) to bring an assembly of adhesive/substrate to failure is very common in the adhesive industry (e.g., pull out test, butt joint test). This method has received attention because it resembles crack/joint opening and contraction. Masson and Lacasse (1999) and Zanzotto (1996) independently measured the bonding of sealants to concrete by bringing sealant-concrete assemblies to tensile failure. In both studies, bonding was defined as the energy that is required to bring the assemblies to failure. Masson and Lacasse (1999) measured energies of 200-500J/m2 at -37ºC, whereas Zanzotto (1996) obtained values of 500-1000J/m2 at -30ºC. Traditional adhesive joint strength tests (e.g., butt tensile test, pull out test, and lap shear test) continue to be used. However, due to their dependence on geometry and other drawbacks, current usage is mostly restricted to studies of a single adhesive-substrate system using a single specimen size and geometry (Jiang and Penn, 1990). Because traditional tests result in unknown stress distributions and mode-mixities at the interface, data from different geometries cannot be compared. In addition, because of the role of elastic moduli, comparison of two substrates is also uncertain. Even if it were possible to compare the aforementioned results from Masson and Lacasse (1999) and Zanzotto (1996), the comparison would not show that adhesion was greater at -30ºC than at -37ºC. Such a comparison may indicate only that the sealants extended farther at higher temperatures and that more energy was spent to stretch the sealant.
Another test, the blister test, is commonly used in the thin-film coating, polymer, microelectronics device, packaging, and polymer industries. This test is used to measure the interfacial fracture energy, which is a fundamental property of the interface, of a thin film deposited on or attached to a substrate. The blister test configuration has been widely used to predict adhesion in a variety of interlaminated structures, such as dental cements and teeth (Despain et al., 1970), thin film coatings (Dannenberg, 1961), polymer composite and microelectronic devices (Shirani and Liechti, 1998; Chu and Durning, 1992).
A major milestone of this project was the development of laboratory tests which can assess sealant-HMA adhesion in a setting that closely resembles field conditions. In this study, three tests were developed to be used by sealant producers, engineers and
contractors, and researchers. The first test uses a surface energy approach and is expected to be used by sealant producers to check the compatibility of sealants with local materials. Even a quality sealant may fail if installed at a site that has incompatible materials. The second approach is a test setup that uses the direct tension test (DTT) machine. This method is more of a qualitative approach to assess the bond between sealant and crack walls and is expected to be used by departments of transportation and consulting agencies for quality control projects. The selected parameters relate the sealant-HMA interfacial bonding to the wetting phenomenon, which is governed by sealant viscosity, filler content,
aggregate type, and surface roughness. The third test uses the concept of fracture mechanics. This test is more suited for profound studies and research projects than the other tests are. However, as equipment and training become available, it can also be used for quality control projects.
PURPOSE AND SCOPE
Hot-poured bituminous sealants are typically selected based on standard tests of an empirical nature, such as penetration, resilience, flow, and bond to cement concrete
briquettes (ASTM D3405). There is, however, no indication that the results of these standard tests pertain to field performance. In an effort to bridge the gap between a sealant’s
fundamental properties and its field performance, this study developed performance-based guidelines for selection of hot-poured crack sealants. One section of these guidelines addresses the adhesion of hot-poured crack sealant to aggregate. The goal is to develop a method that can assess sealant adhesion under conditions that closely simulate those in the field.
METHODS
To measure the adhesion of crack sealant to aggregate at service temperatures ranging from -4ºC to -40ºC (24.8ºF to -40ºF), three laboratory testing approaches were developed. The first laboratory approach examined the sealant-substrate compatibility, assessed by measuring the free energy of the bond. The second approach uses the DTT machine to predict the adhesion at the interface. The third approach uses the fracture mechanics concepts. The three approaches are presented below.
Surface Energy Method
One of the theories used to explain the adhesion phenomenon effectively is
adsorption theory (Masson and Lacasse, 2000). Adsorption theory describes wettability and is based on the measured contact angle between a liquid and a solid on a horizontal surface under thermal equilibrium. A schematic of the contact angle experiment is presented in Figure 1, where θ is the contact angle between the solid-liquid interface and the tangent of the liquid-vapor interface. When a drop of liquid is placed onto a solid surface such as an aggregate, the drop remains stationary (contact angle > 90º) or it spreads (contact angle <90º). If it spreads, the surface of the solid is wetted, and adhesion between the liquid and the solid is likely to be strong. If the drop does not spread, then adhesion is weak. The contact angle is an indicator of the affinity of a liquid for a solid. The shape of a liquid drop on a solid surface is related to the molecular interaction among the surface, the liquid, and the air surrounding them (Van Oss et al., 1988). To be at stationary status, the forces
between the three materials should be in equilibrium (Figure 1), which leads to Young’s
equation as follows:
(1) where,
sl is the solid-liquid interfacial free energy (mJ/m2);
sa is the surface energy of the substrate (mJ/m2);
la is the surface energy of the liquid (mJ/m2); and
When two dissimilar materials form an interface by being in intimate contact, a tensile force can be applied to split the materials into dissimilar parts. For a completely brittle interface, the energy expended (or work of adhesion) can be obtained using the Young-Dupré equation:
(2)
The Young-Dupré equation is basically the sum of the individual surface energies for the two materials involved. Surface energy is composed of a polar and a non-polar
component (Fowkes, 1964):
(3)
where,
l is the liquid surface energy (mJ/m2);
LW
denotes the Lifshitz-van der Waals component; and
AB
is the acid-base component.
Van Oss et al. (1988) presented the full version of the Young-Dupré equation as follows:
(4)
(5)
where,
sLW is the Lifshitz van der Waals (non-polar) component;
s+ is the acid (electron accepting);
s- is the base (electron donating);
sLW, s+, and s- are the solid surface energy components;
is the contact angle; and
lLW, l+, and l- are the liquid surface energy components.
Using the above equations, one can predict the work of adhesion, Wa, between two
materials. The condition of components at the time of wetting is very important. For example, when asphalt binder is applied to hot aggregate, it has a stronger bond than when it is
Figure 1-a. Sessile drop equipment and microscope
Figure 1-b. Contact angle of a drop of liquid on a solid
Experimental Program
The sessile drop method was used to determine both the surface energy of the hot-poured crack sealant and its wettability (contact angle) with respect to a specific substrate. The surface energy components of 13 different sealants were measured using this method. Each sealant was heated and mixed at the manufacturer’s recommended installation temperature and poured onto an aluminum sheet to form a thin, smooth surface. The sealants were cooled at room temperature to solidify and make thin plates. A
five-micrometer pipette was used to manually apply liquid drops from three probe liquids (water, formamide, and glycerol) onto the sealant plate. The image of each drop was captured by microscope within 15sec after it was applied. Knowing the surface energy components of the three probe liquids: water, formamide, and glycerol (Table 1), and their respective contact angles with a specific sealant, the Young-Dupré Equation was used to calculate the surface energy component of the sealant (Equation 4). Substituting the calculated surface energy components of the sealant in Equation 5, one can calculate total surface energy of the sealant (Table 2).
The next step was to measure the contact angle between sealant and a specific substrate. The aggregate types: quartzite, granite, and limestone, were freshly cut to 50x50x5mm plates, cleaned with acetone and distilled water, and oven dried. The sessile drop method was used to place a drop of each sealant on the aggregate surface. The contact angle between each individual pair of sealant and aggregate was captured by the microscope (Table 3). In addition, to establish aluminum as a replacement for aggregate,
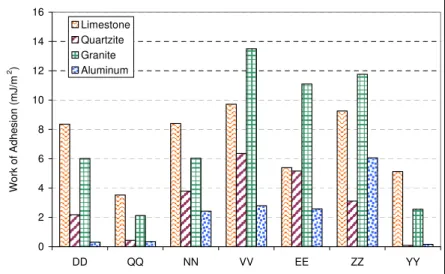
the contact angle between the same sealants and an aluminum plate, made out of 6061-aluminum, was measured separately, (Table 3). Finally, using surface energy of the sealant and its contact angle to a specific substrate, the work of adhesion, Wa, was calculated using
equation 2; the results are presented in Figures 2a and 2b.
Table 1. Surface Energy Characteristics of Probe Liquids at 20ºC, mJ/m2(after Van Oss et
al., (1988)
Probe Liquid
γ
lγ
lLWγ
l+γ
l−Water 72.8 21.8 25.5 25.5
Glycerol 64 34 3.92 57.4
Formamide 58 39 2.28 39.6
Table 2. Surface Energy (mJ/m2) and Its Components for Various Crack Sealants
Sealant LW + total AD 34.49 5.68 1.84 40.96 AE 43.99 5.21 4.36 53.53 BB 9.97 40.01 0.94 22.25 DD 18.28 4.38 0.29 20.52 EE 0.1 4.88 18.72 19.22 UU 2.39 6.32 4.75 13.35 VV 32.45 2.18 0.84 35.15 MM 45.15 12.01 4.93 60.54 NN 6.63 19.99 0.37 12.06 PP 13.98 4.4 0.6 17.22 QQ 0.01 5.39 11.6 15.83 WW 9.03 18.8 1.2 18.54 YY 2.89 10.03 2.4 12.7 ZZ 10.03 5.17 0.39 12.89
0 10 20 30 40 50 60 70 80 90 UU BB AE PP AD WW MM W o rk of Adhesi on ( m J/m 2 ) Limestone Quartzite Granite Aluminum
Figure 2-a. Work of adhesion between sealants and limestone, quartzite, granite, and aluminum 0 2 4 6 8 10 12 14 16 DD QQ NN VV EE ZZ YY W o rk of Adhesi on ( m J/m 2 ) Limestone Quartzite Granite Aluminum
Figure 2-b. Work of adhesion between sealants and limestone, quartzite, granite, and aluminum
Summary of the Surface Energy Method
The study found that work of adhesion for each pair of adhesive-substrate can be the first step to evaluate the bond. Each material possesses a unique surface energy. The compatibility of two materials can be studied using the energy they release once in contact. Knowing the surface energy of the sealant, one can approximately predict if it would be compatible with a specific HMA composition. Some sealants are more appropriate to be used with aggregates which are high in silica while some others are more suited for HMA in which calcium carbonate is the dominant component.
Table 3. Contact Angle between Various Sealants and Substrates
Sealant/Substrate Limestone Quartzite Granite Aluminum
AD 82 150 76 103 AE 143 132 120 169 BB 70 61 82 120 DD 126 153 135 170 EE 136 137 115 150 UU 84 105 99 120 VV 136 145 128 157 MM 90 133 91 110 NN 108 133 120 143 PP 112 128 115 124 QQ 141 167 150 168 WW 71 76 75 82 YY 127 173 143 171 ZZ 106 139 95 122
Direct Adhesion Test Method (DAT)
The second approach is a test using a newly developed setup incorporated in the DTT device. Since aggregate composes more than 80 percent of the HMA, it was assumed that a strong correlation exists between the adhesion at the sealant-HMA interface and the adhesion at the sealant-aggregate interface. Based on this assumption, the proposed test evaluates the adhesion at the sealant-aggregate interface. Various testing specimens were examined.
Because of the difficulty in preparing an adequate butt joint, it was suggested that the sealant be poured onto one aggregate/HMA piece and the other end be anchored to it (Figure 3). However, this approach was not appropriate, since the forces at the anchor are not well-defined. Therefore, it is not clear what mechanism is resisting failure in this case.
Figure 3. Anchorage used in adhesion test
The second specimen type was similar to the first one; but to avoid using an anchor, two cylindrical aggregates were used as end pieces. A split mold was used to pour the hot sealant between the two cylindrical HMA/aggregate blocks with hot-poured sealant
sandwiched in between. To allow for this modification in the setup, it was essential to increase the size of the specimen to account for the HMA maximum aggregate size.
However, because of the sealant’s high viscosity, the mold could not be filled appropriately, and the sealant failed to completely cover the end pieces (Figure 4). In the next trial, the mold was replaced with an insulated mold, and a vacuum was applied to fill it. At first, the mold was opaque and the sealant flow could not be tracked; so a transparent material was used in an attempt to address this difficulty. But again the sealant was too viscous (and its viscosity increased as its temperature decreased to room temperature), which caused the sealant to clog the hose (Figure 5). Due to high variability in the design of HMA, later trials use aggregate with high calcium carbonate or silica content.
Figure 4. Adhesion test using split-mold and sealant failure to covering end pieces (lower right)
Figure 5. Transparent mold and clogged hose
To address the difficulty of sealant pouring, another testing fixture was developed. The briquette assembly consists of two half-cylinder aggregates of 25-mm-in-diameter and 12-mm-long. Each aggregate is confined within an aluminum grip designed to work with the DTT sitting posts. The assembly has a half cylinder mold, open at the upper part. The mold is placed between the two aggregates on a level surface; so that sealant poured into the mold will be confined between the two end pieces. In order to ensure that adhesive failure occurs, and to define the failure’s location, a pre-debonded area is made in the form of a crack at one side of the sealant-aggregate interface. To make the crack, a 25x2mm shim is placed on the upper edge of the aggregate piece that will sit on the fixed side of the DTT. After the sealant is poured into the mold and cooled, removing this shim leaves a notch 2mm deep at the aggregate-sealant interface that will be the initial failure location.
To prepare a specimen, two specified half cylinder substrates are assembled, and the mold and the notch are sprayed with a silicon-based release agent. The assembly is wrapped with a rubber band and placed on a base plate. The heated sealant is poured into the half cylinder mold. Sealant should be poured from one corner of the mold, until the mold is full. This helps avoid the formation of air bubbles. After one hour of annealing at room
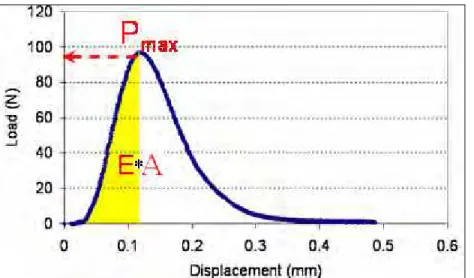
is then removed from the bath, demolded, and placed back in the bath for another 45min before testing. Using the DT device, the end pieces are pulled apart by moving one of the end pieces at a speed of 0.05mm/s (strain rate of 0.005mm/mm/s), as shown in Figures 6 and 7. Test Builder software is used to record both load and displacement of the end pieces. Maximum load, Pmax, and bond energy, E, are calculated for each pair of sealant-substrate.
Energy is defined as the area under the load-displacement curve divided by the contact cross section. The resulted Pmax and E can be regarded as indications of adhesion.
No energy is dissipated in crack initiation because of the already debonded area created by the edge notch. In addition, the failure path is defined. This approach resulted in consistent results compared to those conducted on un-notched specimens. Preliminary tests were conducted on 10 sealants using quartzite aggregate (Table 4). Tests were conducted at the lowest application temperature (-4ºC to -34ºC ±1, depending on sealant type). Each sealant-aggregate pair was brought to failure utilizing direct adhesion tester (DAT) at sealants’ recommended application temperature. Material properties of these sealants, including their surface energy, glass transition temperature, viscosity, and test temperature along with their energy to separation, are reported in Table 4. A plot of the calculated energy versus the surface energy of the sealant for each pair of sealant-aggregate shows that a sealant with lower surface energy produced higher adhesion (Figure 8). This could be due to the fact that a sealant with lower surface energy can spread and wet the surface better.
Feasibility Studies
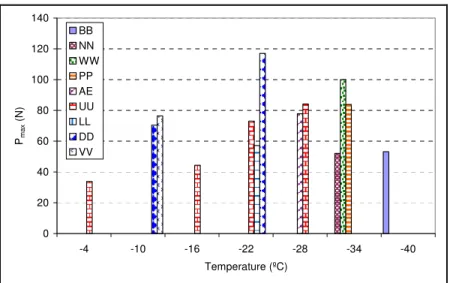
Using the setup described above, and as shown in Figure 6, several sealant-aluminum pairs were tested at temperatures ranging from -4ºC to -40ºC. Aluminum was selected as an appropriate replacement for aggregate because of its compatibility with sealant, low diffusion, controllable roughness, high resistance to extreme temperatures, and availability. It also has a similar thermal coefficient to that of aggregates. Further details on the selection of aluminum and comparison to other aggregates are presented under the third testing method. The load versus displacement of the end pieces was recorded. The Pmax
and E were calculated for each pair (Figure 7). The calculated area was then divided by the cross-section of the end piece in which failure occurred. Pmax and E are plotted in Figures 9
and 10. The test results show both candidate parameters can differentiate among sealants and temperatures.
Figure 6. Pulling end pieces apart at a constant displacement rate, using tensile force in the DT machine
Figure 7. Maximum load and area under the load-displacement curve before the peak
Table 4. Measured Parameters for 10 Crack Sealants on Quartzite (without notch) Sealant Surface energy (mJ/m2) Viscosity (Pa.s) Tg (°C) Testing Temp. (°C) Energy (J/m2) MM 60.54 1.66 -54.54 -34 3.31 VV 35.15 0.99 -30.65 -34 4.85 AD 40.96 0.35 -45.54 -34 7.29 AE 53.53 1.64 -67.69 -34 8.01 QQ 15.83 5.11 -53.45 -4 9.15 WW 18.54 2.58 -62.83 -34 12.33 PP 17.22 3 -77.91 -34 22.44 YY 12.7 1.75 -38.11 -10 25.01 NN 12.06 6.1 -59.59 -34 25.59 UU 13.35 2.53 -30.16 -10 45.44 y = 444.7x-1.1 R2 = 0.73 0 10 20 30 40 50 0 10 20 30 40 50 60 70 Surface Energy (J/m2) Bo nd in g En er g y ( J /m 2)
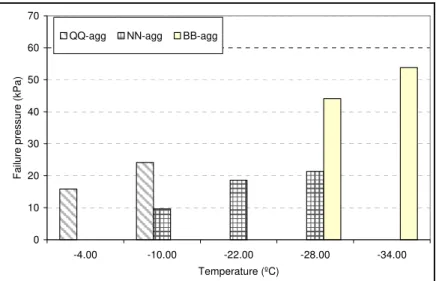
0 20 40 60 80 100 120 140 -4 -10 -16 -22 -28 -34 -40 Temperature (ºC) Pma x (N) BB NN WW PP AE UU LL DD VV
Figure 9. Required load to separate sealant from its aluminum counterpart at various temperatures 0 20 40 60 80 100 120 140 -4 -10 -16 -22 -28 -34 Temperature (ºC) Ener gy ( J /m 2 ) NN WW PP AE UU LL DD VV E
Figure 10. Energy spent to separate sealant from its aluminum counterpart at various temperatures
Selecting the End Pieces
To examine the effect of aggregate composition and topography, the study used aggregates from five states with very different geological conditions: Oklahoma, Illinois, Ohio, Wisconsin, and Pennsylvania. These states provide good representations of the variation in geological conditions in the United States.
Each aggregate was tested using X-ray diffraction (XRD) analysis (conducted at the State Geological Survey, Illinois) to determine its mineral composition (Table 5a). X-ray diffraction is a powerful, non-destructive technique for characterizing crystalline materials. While this method is quite reliable for determining carbonates (limestone, CaCO3 and
dolomite, CaMg (CO3)2), it cannot provide the total amount of SiO2 accurately because SiO2
can be in a number of minerals such as quartz, feldspar, and clay. To measure the total amount of SiO2, X-ray fluorescence (XRF) was used to measure the chemical composition
(Table 5b) of each aggregate (conducted at Actlabs, Canada). Sandstone from Pennsylvania shows the highest percentage of silica (98%).
Table 5-a. Mineral Composition of the Five Tested Aggregates (%)
Component Granite 1 Limestone 2 Limestone 3 Sandstone 4 Quartzite 5
Quartz 28.71 1.60 1.94 98.44 89.69 Potassium Feldspar 26.15 0.00 0.00 0.10 0.00 Plagioclase 33.18 0.00 0.00 0.10 0.25 Calcite 0.00 24.37 94.27 0.00 0.16 Dolomite 1.47 72.88 1.67 0.03 0.35 Hornblend 0.00 0.00 0.00 0.05 0.15 Pyrite 0.00 0.00 0.60 0.02 0.17 Illite 0.34 0.00 1.35 0.45 8.90 Kaolinite 0.00 0.00 0.00 0.54 0.04 Cholorite 0.00 0.00 0.18 0.10 0.09
1) Oklahoma; 2) Ohio; 3) Illinois; 4) Pennsylvania; 5) Wisconsin
Table 5-b. Chemical Composition of the Five Tested Aggregates (%)
Element Granite 1 Limestone 2 Limestone 3 Sandstone 4 Quartzite 5
SiO2 75.16 1.89 1.24 97.94 82.42 Al2O3 12.14 0.24 2.47 1.06 8.97 Fe2O3 2.37 0.23 0.53 0.06 3.36 MnO 0.042 0.02 0.119 0.003 0.006 MgO 0.31 11.67 0.5 0.05 0.34 CaO 0.53 27.5 53.14 0.02 0.43 Na2O 3.79% 0.01 < 0.01 0.02 0.08 K2O 4.85% 0.03 0.02 0.12 1.49 TiO2 0.2% 0.01 0.02 0.04 0.37 P2O5 0.01 0.02 0.03 0.01 0.06 Cr2O3 < 0.01 < 0.01 < 0.01 < 0.01 < 0.01 LOI 0.523 44.63 41.97 0.333 2.43 Total 99.93 86.24 100 99.65 99.95
1) Oklahoma; 2) Ohio; 3) Illinois; 4) Pennsylvania; 5) Wisconsin
The highest amount of calcium carbonate was found in the Illinois limestone at 94.3 percent. To calculate the amount of this component from the XRF method, the amount of CaO in Table 5b should be multiplied by a factor of 1.78, which is the ratio of the molecular weight of CaCO3 (100g) to CaO (56g). Using this factor, Illinois limestone having 53.14
percent CaO consists of 95 percent calcium carbonate, which is close to the result from the XRD method.
Experimental Program
All aforementioned tests were performed on non-aged sealant; however, it was shown that short-term sealant aging occurs mainly during heating in the kettle (Masson and Al-Qadi, 2004). Therefore, sealant is already aged even before exiting the wand and
rheological behavior changes after aging. Depending on its composition and percentage of polymer, ground rubber, and/or mineral filler, the sealant may become stiffer or softer after aging. If the polymer chains are degraded during aging, sealant becomes softer, while if chains coalesce sealant becomes stiffer after aging. Considering the effect of aging on the bonding, and the fact that the main part of aging occurs in the kettle, sealant adhesion should be measured for aged sealant. Hence, an adhesion threshold should be
recommended based on the test results from aged sealants. To study if an aging process affects the bonding significantly, first, an aging method able to resemble short-term aging needs to be developed, and second, bonding between aluminum and several aged sealants need to be determined and compared to unaged sealants.
As part of this project, a method and procedure for aging was developed to simulate aging and weathering of crack sealants (Masson and Al-Qadi, 2004). In this method, the homogenized sealant is cut into pieces and placed in a stainless steel pan in a heated oven until it melts and creates a 2-mm-thick film. Then it is cooled down to room temperature and placed in a vacuum oven aging (VOA) device, heated to 115ºC for 16hrs at a vacuum of 760mm of mercury. The sealant is then transferred to a regular oven, heated at 180°C to melt and stored in containers (Masson and Al-Qadi, 2004). Comparison of the chemical composition of the aged and un-aged sealants to those of field specimens proved this method is a suitable approach for aging bituminous crack sealants (Masson and Al-Qadi 2004).
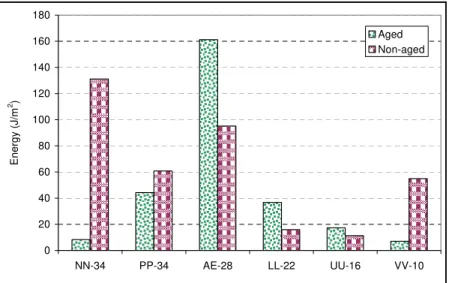
To examine the effect of aging on bonding, six sealants were aged following the aforementioned aging procedure. Bonding potential of these sealants to aluminum end pieces was measured using DAT. The bonding of the same sealants, but unaged, were also measured and compared, Figures 11 and 12. As can be seen, Pmax and E values vary with
aging. In addition, both parameters show the same pattern. For example, both parameters show lower bonding for aged sealant NN at -34ºC, and both parameters show higher bonding for aged sealant UU at -16ºC. This variation among sealants can be attributed to variation in the chemical composition of the sealant, which is highly affected by the type and content of the polymer used.
To fine-tune the test method and check the test variation, eight sealants, which are widely used in various regions in North America, were selected for final testing. These sealants have various rheological characteristics and are used in regions with low temperatures between -4 to -40ºC. Each sealant was aged in accordance with the procedure by Masson and Al-Qadi (2004). Adhesion of the aged sealants with aluminum was estimated using the adhesion test setup. Maximum load and energy to failure was calculated for each pair. Figures 13 and 14 show the test results for aged sealants at temperatures ranging from +2 to -34ºC.
0 20 40 60 80 100 120 NN-34 PP-34 AE-28 LL-22 UU-16 VV-10 Pmax (N ) Aged Non-aged
Figure 11. Required load to break the bond between aluminum and aged/ non-aged sealants 0 20 40 60 80 100 120 140 160 180 NN-34 PP-34 AE-28 LL-22 UU-16 VV-10 Ener gy ( J /m 2 ) Aged Non-aged
Figure 12. Required energy to break the bond between aluminum and aged/ non-aged sealants
Variation within Laboratories
A statistical analysis was conducted to estimate variation within laboratories. The repeatability of the adhesion test results was acceptable, with an average coefficient of variation of 19.3 percent. However, to ensure consistent test results, the steps presented under specimen preparation should be followed. In addition, pouring temperature, and consequently, viscosity of the sealant should be controlled. As discussed later in this report, sealant viscosity may significantly affect bonding. It is recommended to control temperature within ±1°C. In addition, it is preferred to pour sealant in a mold in a closed environment to minimize temperature variations while casting specimens. Another concern is the
homogeneity of the sealants; especially with products containing a high percentage of rubber and/or filler. To ensure homogeneity of the sealants, sealant preparation using ASTM D5167 is recommended. In accordance with the ASTM C670 standard, the acceptable variation should be established using precision of individual measurements. The maximum acceptable range for individual measurements is obtained by multiplying the standard
deviation of the measurements by a factor reflecting the number of replicates. For three and four replicates, this factor is 3.3 and 3.6, respectively.
To evaluate data variability between operators, two operators tested sealants LL, MM, NN, UU, VV, and AE individually. A standard analysis of variance (ANOVA) was conducted to check whether the results of the two sets of tests were statistically different. The results showed no statistical evidence that the measured Pmax was different at a level of
significance of 5 percent (Table 6). In addition, another setup, built using different manufacturer was tested to check for variation among various test setups. Statistical analysis showed no significant difference among test setups (Tables 6 and 7)
0 40 80 120 160 200 2 -4 -10 -16 -22 -28 -34 Temperature (ºC) Pma x (N)
PPA NNA AEA LLA
VVA UUA QQA ZZA
Figure 13. Measured maximum load for eight aged sealant-aluminum pairs
0 200 400 600 800 1000 1200 1400 -16 -22 -28 -34 Temperature (ºC) E ( J /m 2) PPA NNA AEA LLA
0 4 8 12 16 20 2 -4 -10 -16 -22 Temperature (ºC) E ( J /m 2 ) VVA UUA ZZA QQA
Figure 14-b. Measured energy for four aged sealant-aluminum pairs Table 6. Analysis of Variance between Two Operators
Sealant Testing Temp.(ºC) SS df MS F P-value F critical AE -28 15.84 1 15.84 0.057 0.82 7.71 LL -16 191.49 1 191.49 5.024 0.09 7.71 MM -28 414.09 1 414.09 2.488 0.19 7.71 NN -28 0.12 1 0.12 0.001 0.97 7.71 UU -10 207.89 1 207.89 0.919 0.39 7.71 VV -10 1.54 1 1.54 0.046 0.84 7.71
Table 7. Analysis of Variance between Two Setups Sealant Testing Temp. (ºC) SS df MS F P-value F critical QQ@+2 2 3.3 1 3.3 0.07 0.8 7.71 NN@-28 -NN@-28 392.06 1 392.06 1.542 0.28 7.71 LL@-16 -16 191.49 1 191.49 5.024 0.09 7.71 PP@-34 -PP@-34 95.32 1 95.32 0.972 0.38 7.71
Variation between Sealants
In the next step, a statistical analysis was conducted to examine the adequacy of determined parameters to distinguish among sealants tested at the same temperature. Characteristics of the tested materials are reported in Table 8.
The t test was used, when two sealants were compared at a specific temperature. The F test appeared to be an appropriate statistical method for multiple comparisons (more than two groups). Analysis of variances and multiple data comparison were conducted at temperatures ranging from +2ºC to -34ºC at 6ºC intervals. Analysis of variance procedures required the following assumptions:
• Each group is an independent random sample from a normal population. • The variances of the groups are equal.
Table 8. Characteristics of Seven Sealants Selected for Testing Sealant Pouring Temp. (ºC) Viscosity (Pa.s) @ application temperature Molecular weight (g/Mol) Mode I Mode II AE 189 1.639 1420 186100 VV 149 0.961 1470 184000 ZZ 193 4.156 1480 --- NN 188 6.356 1360 257700 QQ 193 4.725 1480 353700 PP 193 2.997 1440 137300 UU 193 2.533 1410 176900
To check the second assumption in which the null hypothesis is that the groups come from populations with the same variance, the Levene test at significance level of 0.05 was used. The observed significance level at all temperatures is greater than 0.05 (Table 9). Therefore, the null hypothesis would not be rejected and variances of the groups are equal.
Table 9. Levene Test Result to Examine the Equality of the Variances of the Groups
Groups Levene Statistic Sig. @T-34 2.132 0.200 @T-28 0.017 0.903 @T-22 0.274 0.628 @T-16 4.737 0.058 @T-10 3.361 0.105 @T-4 4.664 0.097
Significant differences among the sealants tested at the same temperature was examined. The null hypothesis is that all groups have the same mean values at a 0.05 significance level. The statistical test for this null hypothesis is based on the F ratio. A significant F-value indicates that not all population means are equal. For this part, the best three out of four replicates were used in the analysis. As indicated in Table 10, the
significant values for all groups with the exception of group T-22 are below 0.05, which means F is significant and the null hypothesis is rejected (Table 10). For cases in which two sealants are compared, i.e groups T-28, T-4, results show that test parameter can
distinguish between sealants in these groups. However, for cases in which more than two sealants are compared, a significant F ratio only means there is at least one group which is different from the rest. In those cases, multiple comparisons followed by a Tukey’s HSD (honestly significant difference) test are conducted to examine the ability of test parameters to differentiate between all sealants adequately. To study how much of the variation occurs between sealants, the sum of square between groups was divided by the total sum of square (Equation 6). Table 11 presents the percentage difference among sealants tested at each temperature.
(6) where,
DS is the variation among sealants at each temperature;
SSb is the sum of squares between groups; and
SSt is the total sum of square, (i.e. SSb +SSw).
Multiple comparisons were then conducted to determine which means are
significantly different from the others. Tukey’s HSD procedure allows for a comparison of the possible pairs of means. For example, if there are four sealants, six possible paired
comparisons (comparisons between individual means) can be performed. Table 12 shows the homogeneous subset at -34, -16, and -10ºC.
Table 10. ANOVA Results Comparing Sealant Mean Values Using Pmax
Temperature (ºC) Sum of Squares df Mean Square F Sig. -34 Between Groups 10,589.583 2 5,294.791 131.037 0.0000 Within Groups 242.440 6 40.407 Total 10,832.023 8 -28 Between Groups 2,273.629 1 2,273.629 14.497 0.0190 Within Groups 627.330 4 156.832 Total 2,900.958 5 -22 Between Groups 12.801 1 12.801 0.022 0.8894 Within Groups 2,331.242 4 582.810 Total 2,344.043 5 -16 Between Groups 7,031.484 2 3,515.742 30.077 0.0007 Within Groups 701.341 6 116.890 Total 7,732.825 8 -10 Between Groups 2,607.818 2 1,303.909 14.045 0.0055 Within Groups 557.032 6 92.839 Total 3,164.850 8 -4 Between Groups 2,325.271 1 2,325.271 89.707 0.0007 Within Groups 103.682 4 25.921 Total 2,428.953 5
Table 11. Sealant Variation Ratio at Each Temperature for Pmax
Temperature (ºC) DS (%) -34 97.76 -28 78.38 -16 90.93 -10 82.40 -4 95.73
Table 12-a. Homogenous Subsets at -34ºC for Pmax
Sealant N Subset for alpha = 0.05
1 2 3
NN 3 45.537667
PP 3 84.490667
AE 3 129.487333
Sig. 1.000 1.000 1.000
Table 12-b. Homogenous Subsets at -16ºC for Pmax
Sealant N Subset for alpha = 0.05
1 2 3
UU 3 36.722667
LL 3 65.289333
VV 3 104.892000
Sig. 1.000 1.000 1.000
Table 12-c. Homogenous Subsets at -10ºC for Pmax
Sealant N Subset for alpha = 0.05
1 2
VV 3 23.8077
UU 3 49.7580
ZZ 3 65.0467
Sig. 1.000 0.207
At -34 and -16ºC, three sealants are categorized in three separate subsets, which means all three sealants are different. However, at -10ºC, sealants UU and ZZ at confidence level of 0.05 do not show significant difference. In further examination, the number of
replicates was increased, and statistical analysis was repeated. Table 13 shows the test of homogeneity of variances, in which the observed significance level is 0.245 which is greater than 0.05; hence, the groups’ variances are equal. The ANOVA results in Table 14 show that the F ratio is significant, which suggests the groups have different mean values. Finally, Table 15 shows the homogenous subsets at -10ºC. As can be seen at significance level 0.05, the three sealants are different; hence, the test parameter can adequately differentiate among sealants at each temperature. With the exception of sealants tested at -22ºC,
significant differences were found among sealants.
Table 13. Levene Test Result to Examine Sealant Equality of Variances at -10ºC
Levene Statistic df1 df2 Sig.
1.516 2 19 0.245
The fact that no significant difference was observed between the sealants tested at -22ºC can be attributed to the inherent similarity of the two sealants tested at this
temperature.
Statistical analysis conducted for the second parameter, energy, led to the ANOVA table and homogenous subsets in Tables 16 and 17, respectively. As can be seen, energy can also distinguish among sealants tested at each temperature with the exception of -10ºC. It should be noted though; this parameter could not differentiate among sealants as clearly
as Pmax did. For instance at -34 and -16ºC, it only categorizes the sealants into two subsets,
and fails to distinguish between sealants NN and PP at 34ºC and sealants LL and VV at -16ºC.
In general, statistical analysis showed both parameters can distinguish between sealants to some extent; however, Pmax was found to be a more sensitive parameter to
sealant variation and able to clearly differentiate among sealants.
Table 14. ANOVA Results Comparing Sealants Tested at -10ºC Using Pmax
Sum of
Squares df Mean Square F Sig.
Between Groups 8,930.900 2 4,465.450 26.464 0.000
Within Groups 3,205.992 19 168.736
Total 12,136.892 21
Table 15. Homogenous Subsets at -10ºC for Pmax
Sealant N Subset for alpha = 0.05
1 2 3
VV 6 51.6967
UU 13 79.6402
ZZ 3 23.8077
Sig. 1.000 1.000 1.000
Variation of Pmax with Substrates
The same eight sealants were tested with four different substrates: limestone, granite, quartzite, and aluminum. Figure 15 shows that substrate composition and surface property affect the interfacial bonding significantly. While sealant PP adheres best to quartzite; sealants NN, AE, UU, LL, and VV adhere better to granite; and sealants QQ and ZZ adhere better to limestone.
Summary of the Direct Adhesion Tester
This study concluded that the Direct Adhesion Tester (DAT) is an appropriate qualitative method to evaluate interfacial bonding at the application temperature. The test setup and specimen preparation are developed to simulate the load applied at the interface during crack contraction. Although, the selected displacement rate, 0.05 mm/s, may not resemble field conditions, it can provide a uniform test method and consistent test results provided the test method and specifications are followed. Two parameters, maximum load (Pmax) and energy (E) were considered as a measure to predict adhesion. To check test
repeatability, a statistical analysis was conducted. No difference was found between operators, nor between test setups. Further, statistical analysis showed both parameters can distinguish between sealants adequately. As a follow up to this study, round robin testing needs to be performed to establish precision and bias for this test method. This test may be used to qualitatively evaluate the effect of other factors such as annealing time, surface roughness, crack surface treatment, sealant viscosity, short and long-term aging, and water exposure.
Table 16. ANOVA Results Comparing Energy Values
Temperature (ºC) Sum of
Squares df Mean Square F Sig.
-34 Between Groups 5,003,440.996 2 2,501,720.498 100.705 0.000 Within Groups 149,052.427 6 24,842.071 Total 5,152,493.423 8 -28 Between Groups 29,744.001 1 29,744.001 5.008 0.089 Within Groups 23,757.383 4 5,939.346 Total 53,501.384 5 -22 Between Groups 936,090.588 1 936,090.588 6.267 0.067 Within Groups 597,518.335 4 149,379.584 Total 1,533,608.923 5 -16 Between Groups 235.152 2 117.576 18.394 0.003 Within Groups 38.353 6 6.392 Total 273.504 8 -10 Between Groups 575.232 2 287.616 2.755 0.142 Within Groups 626.364 6 104.394 Total 1,201.597 8 -4 Between Groups 44.442 1 44.442 31.106 0.005 Within Groups 5.715 4 1.429 Total 50.157 5
Table 17-a. Homogenous Subsets at -34ºC for the Bond Energy
Sealants N Subset for alpha = .05
1 2
NN 3 8.281458
PP 3 49.039113
AE 3 1,609.949193
Table 17-b. Homogenous Subsets at -16ºC for the Bond Energy
Sealants N Subset for alpha = .05
1 2 LL 3 5.246706
VV 3 8.301916
UU 3 17.289782
Sig. 0.364 1.000
Table 17-c. Homogenous Subsets at -10ºC for Energy Sealants N Subset for alpha = .05 1 ZZ 3 1.3192 VV 6 8.4578 UU 13 109.8665 Sig. 0.134 0 50 100 150 200 250 300 350 400 PP A-34 NNA -34 NNA -28 AEA-2 8 AE A-22 LL A-22 LLA -16 VV A-22 VV A-16 VV A-10 UUA -16 UUA -10 ZZ A-10 ZZ A-4 QQ A-4 QQA +2 P ma x (N) Aluminum Limestone Granite Quartzite
Figure 15. Measured load for various substrate pairs
Fracture Mechanics Approach
A weak bond results in cracks or delamination under loading; hence, a natural approach for assessing the resistance to delamination is to use fracture mechanics. Therefore, the third approach used the concept of fracture mechanics. Since fracture tests take into account both the specimen geometry and the elastic properties of the two adhering materials; the interfacial fracture energy (IFE) can be derived independent of the geometry.
Until now, many mechanical testing methodologies have been designed to evaluate IFE. Among these, the peel test, the double cantilever beam test, the indentation test, and the blister test appeared to have the most potential for application to a sealant-aggregate system. The conventional peel test is one of the well-received methods. However, the peel test has many drawbacks, which have been discussed in detail by Kim and Kim (1988). The main drawback is that most of the energy is dissipated or stored in deformation of the test specimen, and little energy contributes to fracture. Moreover, extracting IFE from a peel test
high bending angle and consequently the large amount of energy dissipated in plastic deformation (Wan and Mai, 1995). Also, because of the direct mechanical contact via a clamp, this test is not appropriate for viscoelastic adhesives such as bituminous material which is loading-history dependent. In addition, using a peel test on a rubber-glass system, Gent and Lewandowski (1987) showed that apparent IFE is very sensitive to peel rate. They observed that increasing the peel rate by tenfold led to an order of magnitude increase in IFE. They also observed that IFE measurements from blister tests are consistently lower than those from peel tests. They attributed that to the high energy dissipated when adhesive is bent sharply away from the substrate at 90º. After examining the feasibility of different methods to experimentally evaluate the IFE, the blister test was found to be promising.
Peel Test
The peel test is a common test in the polymer, paint, and microelectronics industries. Due to its relative simplicity, the peel test is a well-received method to measure adhesion of mainly deformable adhering layers. In the test, a thin flexible strip bonded to substrate is peeled away from the substrate at some angle to the substrate. The force applied to separate the adhesive from the substrate is called peel force. If there is no plastic deformation or residual stress involved, adhesion can be calculated as follows:
(7)
where,
a is adhesion;
is peel angle; and
P is peel force per unit width of the film.
However, in order to extract the intrinsic adhesion in the presence of plastic deformation, one needs to consider the energy dissipated during peeling. The
aforementioned Equation 5 is unable to define a unique geometry-independent value, which can represent the adhesion, from the experimental data. The dominant component of many peel tests is energy dissipated in plastic bending of the peeling arm, and only a small portion is used to break the bond (Gent and Lewandowski, 1987). Later studies implemented a detailed elastoplastic analysis of steady state peeling. The film was modeled as a beam on a rigid substrate (Kim and Kim, 1988). An energy balance along with beam theory was used to extract the interfacial fracture energy from the experimental data (Kim and Kim, 1988). Later, finite element analysis of the peel test showed the singularity is limited to the crack tip and the dominant mode of deformation is bending. Several researchers tried to correlate the peel force and IFE; however, all specimens mentioned in their studies suffered a large yielding not only around the crack tip but also within the film thickness. Also, the plastic dissipation energy masked the component of IFE.
Blister Test
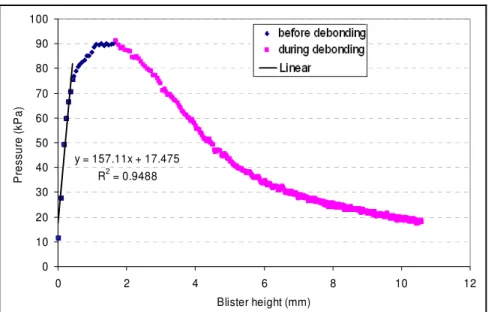
The blister test appears to be self-contained, practical, and repeatable. Interfacial fracture energy, which is a geometry-independent engineering term, can be extracted easily through this test. Having IFE as a system parameter and Young’s modulus of the adhesive material, one can predict adhesive failure in complex adhesive joints by stress analysis and energy balance of the geometry. This test was first developed by Williams (1969) and later modified by Burton et al. (1971) by incorporating aspects of a test first suggested by
Dannenberg (1961). The test method starts with a torus-shaped disk of substrate covered with a layer of adhesive on top. When a liquid or gas is injected from below into the center of the annular disk, the adhesive lifts off the disk or substrate. A blister forms and its radius stays fixed until a critical pressure is reached. At this critical pressure value, the radius of the blister increases in size, signifying the initiation of the debonding process at the interface.
The intrinsically stable interface debonding process makes this test attractive and allows calculation of a fundamental property of the interface: the IFE. This parameter is defined as the energy required to separate a unit area of the interface (Bennett et al., 1974), which is found to be an inherent property of the interface and independent of the geometry (Penn and Defex, 2002). However, it is also important to note that it may depend on surface preparation (Bennett et al., 1974). Therefore, the surface preparation needs to remain constant if IFE is to be used to predict adhesion for various geometries. In addition to providing the IFE, the blister test also can provide the elastic modulus and residual stress of the adhesive layer. These features are unique to this test and make the test even more useful.
Theoretical Background
Fracture mechanics have already been used in the failure analysis of many materials, including HMA. Interfacial fracture energy (or bonding) depends on the thermodynamic work of adhesion, fracture mechanics, and rheology (Masson and Lacasse, 2000). In 1921, Griffith proposed an energy criterion of failure which serves as the basis of classical linear elastic fracture mechanics (LEFM) and of the more general elastic fracture mechanics (EFM, in which linearity is not required). This criterion is a statement of the principle of energy balance: a crack will propagate if the energy available is greater than or equal to the energy required to extend the crack by a unit surface area. Griffith showed that this energy for one material is the sum of the surface energies of each of the newly developed surfaces.
Williams (1969) explained that IFE is the difference between the surface energy of the bond and the sum of the surface energies of the newly developed surfaces. However, in reality, because the crack in most materials is rough and tortuous, and micro-cracking, frictional slip, and plasticity are involved in a sizable zone around the fracture tip, the energy required for unit crack propagation is much more than this value. This crack propagation energy is the sum of energy dissipated through a reversible component (thermodynamic work of adhesion) and a deformation component including viscous and plastic deformation which depends on the deformation rate. Williams applied fracture mechanics in the analysis of both thin plates with small deflections and very thick disks. Later, using a Winkler elastic foundation, he analyzed the adhesive layer to calculate the energy stored in the adhesive layer (Williams and Kelley, 1971) and showed that the IFE could be expressed in terms of the critical pressure and height of the dome. Gent and Lewandowski (1987) compared two different adhesives, elastic and elasto-plastic, and reported that the elastic adhesive exhibited a closer relationship to theoretically calculated IFE. However, very thin adhesive films (even ductile adhesive) should behave nearly elastically, because a thinner adhesive film has less material to dissipate energy (Hbaieb and Zhang, 2005).
Malyshev and Salganik (1965) conducted experiments using a point loaded blister test. They observed that the force applied to debond the film remained constant, while the height of the dome increased in proportion to the square of the radius of the orifice. Later, Jones (1969) used uniform pressure as the driving force through a pressurized blister test to improve the sensitivity of the test. During the experimental test, he observed that the same total force induced a smaller dome. Williams (1969) conducted some experiments using a pressurized blister test and observed that a bigger orifice resulted in lower failure pressure. In 1983, Hinkley examined the case of very thin films behaving like membranes; he found