1
Early Earth Differentiation Investigated Through
142Nd,
182W, and Highly
1
Siderophile Element Abundances in Samples From Isua, Greenland
2 3
H. Rizo*1,2,3, R.J. Walker3, R.W. Carlson2, M. Touboul4, M.F. Horan2, I.S. Puchtel3, M. Boyet5, 4
M.T. Rosing6 5
6
1
GEOTOP, Université du Québec à Montréal, Montréal, Québec H3C 3P8, Canada 7
2
Department of Terrestrial Magnetism, Carnegie Institution for Science, Washington DC 20015, 8
USA 9
3
Department of Geology, University of Maryland, College Park, MD 20742, USA 10
4
Laboratoire de Géologie de Lyon, Ecole Normale Superieure de Lyon, 69007 Lyon, France 11
5
Laboratoire Magmas et Volcans, Université Blaise Pascal-CNRS-IRD-OPGC, 5 rue Kessler, 12
63038 Clermont-Ferrand, France 13
6
University of Copenhagen, DK-1350 København K2, Danemar 14
15 16 17 18
* Corresponding author at: GEOTOP, Université du Québec à Montréal, Montréal, Québec 19
H3C 3P8, Canada. E-mail address: hanika.rizo@uqam.ca 20 21 22 23 24 25 26 27 Submitted: June 26th 2015 28 Revised: November 25th, 2015 29 30 31
© 2015. This manuscript version is made available under the Elsevier user license http://www.elsevier.com/open-access/userlicense/1.0/
2 32
Abstract 33
34
We report new data for W concentrations, stable W isotopic compositions, high-precision 35
182
W/184W ratios, highly siderophile element (HSE) abundances and 187Re-187Os isotopic 36
systematics in a suite of 3.8 Ga to 3.3 Ga mafic and ultramafic rocks from the Isua supracrustal 37
belt, and the Paleoarchean terrane in the northwestern part of the belt. These data are compared 38
with published data for 146Sm-142Nd systematics in the same samples. The samples from the Isua 39
supracrustal belt show well resolved excesses of 182W/184W of up to ~21 ppm, consistent with 40
previous W isotopic data reported by Willbold et al. (2011). While there is abundant evidence 41
that W was mobilized in the crust accessed by the Isua supracrustal suite, the isotopic anomalies 42
are interpreted to primarily reflect processes that affected the mantle precursors to these rocks. 43
The origin of the 182W excesses in these rocks remains uncertain. The Isua mantle source could 44
represent a portion of the post-core-formation mantle that was isolated from late accretionary 45
additions (e.g., Willbold et al., 2011). However, the combined 182W, Re-Os isotopic systematics, 46
and HSE abundances estimated for the source of the Isua basalts are difficult to reconcile with 47
this interpretation. The W isotope variations were more likely produced as a result of 48
fractionation of the Hf/W ratio in the mantle during the lifetime of 182Hf, i.e., during the first 50 49
Ma of Solar System history. This could have occurred as a result of differentiation in an early 50
magma ocean. The Isua suite examined is also characterized by variable 142Nd/144Nd, but the 51
variations do not correlate with the variations in 182W/184W. Further, samples with ages between 52
3.8 Ga and 3.3 Ga show gradual diminution of 142Nd anomalies until these are no longer resolved 53
from the modern mantle isotopic composition. By contrast, there is no diminishment of 182W 54
variability with time, suggesting different mechanisms of origin and retention of isotopic 55
variations for these two extinct-radionuclide isotope systems. The presence of 182W isotopic 56
anomalies in rocks as young as 3.3 Ga, implies that early-formed, high Hf/W domains survived 57
for more than 1 Ga in the convective mantle. 58
59 60
Keywords: Isua supracrustal belt, early Earth differentiation, 182W, 142Nd, highly siderophile 61
elements 62
3 1. Introduction
63 64
The earliest history of the Earth is veiled in mystery due to the scarcity and degree of 65
reworking of early Archean and especially Hadean rocks and minerals. Nevertheless, short-lived 66
isotope systems can provide important information about Earth’s primary differentiation and 67
early chemical evolution. The Hf-W isotope system (182Hf → 182W, t½ = 8.9 Ma, Vockenhuber et
68
al., 2004) is particularly valuable for studying events that occurred during the first ~50 Ma of 69
Solar System history. This system is an ideal tracer of metal-silicate segregation, because W is 70
moderately siderophile, while Hf is strongly lithophile. The Hf-W system has been commonly 71
applied to study core formation processes, where core formation led to the creation of high (bulk 72
silicate Earth) and low (core) Hf/W ratio domains within the Earth. Comparing the 182W/184W 73
ratio of Earth’s mantle to that of chondritic meteorites can therefore provide important 74
information about the timing of the formation of Earth’s core. The observation that the 182W/184W 75
ratio of Earth’s mantle is on average ~200 ppm higher than that of chondrites has been attributed 76
to primary core-mantle segregation during the first ~30 million years of Solar System history 77
(Yin et al., 2002; Kleine et al., 2002; Kleine et al., 2009; Schoenberg et al., 2002). Tungsten is 78
also more incompatible than Hf in most silicate minerals, so major variations in Hf/W ratios also 79
likely resulted from crystal-liquid fractionation processes occurring in the silicate Earth (e.g., 80
Righter and Shearer, 2003; Brown et al., 2014). If fractionation between W and Hf occurred 81
while 182Hf was extant, W isotopic heterogeneities in the mantle should have been created. 82
Eoarchean rocks from both the Isua supracrustal belt (southwest Greenland) and the 83
Acasta gneisses (Northwest Territories, Canada) were among the first terrestrial rocks to be 84
analyzed for W isotopic composition (Moynier et al., 2010; Iizuka et al., 2010). The 182W/184W 85
ratios measured in these rocks, with the ±20-30 ppm uncertainty typical of these studies, were 86
indistinguishable from the modern mantle. Recent improvements in analytical techniques have 87
pushed the precision of 182W/184W ratio measurements below ±5 ppm (Willbold et al., 2011; 88
Touboul and Walker, 2012). Measurements made by these high-precision techniques have 89
revealed that ancient rocks from the Isua supracrustal belt, the Acasta gneisses, the Nuvvuagittuq 90
greenstone belt, as well as late Archean komatiites from Kostomuksha, have 182W excesses of 5 91
to 15 ppm compared to the modern mantle (Willbold et al., 2011; Touboul et al., 2012; Touboul 92
et al., 2014; Willbold et al., 2015). The causes of the 182W enrichments are still debated, but 93
4
currently center on two possibilities. One is that these samples were derived from portions of the 94
mantle that, following completion of core segregation, remained isolated from late accretionary 95
additions of materials with chondritic W isotopic compositions (Willbold et al., 2011). The 96
addition of ~0.5 wt.% of chondritic material to the silicate portion of the Earth following 97
cessation of core formation has frequently been called on for establishment of chondritic relative 98
abundances of the highly siderophile elements (HSE) in the mantle (Chou et al., 1983; Kimura et 99
al., 1974). This process is commonly termed late accretion. Because the 182W/184W ratio of 100
chondrites is ~200 ppm lower than Earth’s modern accessible mantle, this amount of late addition 101
of chondritic materials would have lowered the 182W/184W ratio of the bulk mantle by ~10-20 102
ppm. Consequently, mantle sources isolated from these late additions would be enriched in 182W 103
by that amount, compared to the mantle that fully incorporated late accretionary components. In 104
addition to a more radiogenic W isotopic composition, these isolated mantle sources would also 105
be depleted in HSE. The only published data for which 182W excesses and HSE abundances have 106
been measured are those from Kostomuksha and Nuvvuagittuq, yet these rocks do not appear to 107
be derived from mantle sources that were significantly depleted in HSE relative to the modern 108
mantle (Puchtel and Humayun, 2005; Touboul et al., 2012; Touboul et al., 2014). 109
Another possible cause for terrestrial 182W anomalies is fractionation of the Hf/W ratio in 110
the mantle as a result of crystal-liquid differentiation in a terrestrial magma ocean, while 182Hf 111
was still extant. This possibility was proposed to explain 182W enrichment in the 2.8 Ga 112
Kostomuksha komatiites (Touboul et al., 2012). For this scenario, the differentiation must take 113
place within ~30 Ma of the formation of the Solar System in order to result in the observed 114
enrichment in 182W. Touboul et al. (2012) considered both metal-silicate partitioning in a lower 115
mantle magma ocean, and silicate solid-liquid partitioning in a whole mantle magma ocean, to 116
create isotopically enriched mantle domains that could be tapped at a later time. In the case of the 117
Kostomuksha komatiites, the resulting high 182W/184W domain must have survived for at least 118
~1.7 Ga, in order to be sampled at 2.8 Ga. 119
If terrestrial W isotopic variability is due to early magma ocean differentiation, then a 120
correlation between 182W/184W and 142Nd/144Nd ratios might be expected. The abundance of 142Nd 121
was enhanced through the short-lived decay of 146Sm (t½ = 103 Ma). Magma ocean
122
differentiation will fractionate the Sm/Nd ratio in the same way as the Hf/W ratio. If the 123
fractionation occurred during the lifetime of 182Hf, it also occurred during the lifetime of 146Sm. 124
5
In comparison to the 182Hf-182W system, the 146Sm-142Nd system involves two lithophile elements, 125
and therefore, is only sensitive to silicate differentiation events. The excesses and deficits in 126
142
Nd relative to modern terrestrial Nd standards detected in Archean rocks from southwest 127
Greenland (Bennett et al., 2007; Boyet et al., 2006; Caro et al., 2006; Rizo et al., 2011; Rizo et al., 128
2012; Rizo et al., 2013), suggest that these samples were derived from incompatible element 129
enriched and depleted portions of the mantle that were differentiated in the Hadean. Further, the 130
Sm-Nd systematics of the Isua supracrustal belt rocks suggest that early-formed chemical 131
heterogeneities in the mantle source(s) of these rocks were mixed away by ~3.3 Ga (Rizo et al., 132
2013). If both 182W/184W and 142Nd/144Nd ratios reflect differentiation of an early terrestrial 133
magma ocean, then variability of 182W/184W ratios from the rocks of the Isua supracrustal belt 134
should also diminish with time. 135
A third possibility to explain variation in 182W/184W ratios that has not yet been 136
considered stems from the possibility of coupled geochemical reactions and analytical artifacts. 137
Geochemical reactions during metamorphic mobilization of W can potentially cause mass 138
dependent fractionation of W isotope ratios. Instrumental mass fractionation during a mass 139
spectrometric measurement is normally corrected assuming an exponential mass dependence to 140
the fractionation. If a sufficiently large natural mass fractionation occurred that followed another 141
mass dependent fractionation law (e.g., linear, equilibrium, Rayleigh), the exponential correction 142
of the measured W ratios could potentially produce apparent 182W/184W variations that would 143
reflect an analytical artifact, rather than a geologically meaningful relation to 182Hf decay. In 144
contrast to Nd, there are an insufficient number of isotopes of W to assess this possibility by 145
examining other W isotopic ratios, so it is necessary to assess the magnitude of mass dependent 146
fractionation of W in samples. 147
Here, we report W concentrations, stable W isotope compositions, high-precision 148
182
W/184W ratios, and HSE abundances, including 187Re-187Os isotopic systematics, in a suite of 149
3.8 Ga to 3.3 Ga mafic and ultramafic rocks from the Isua supracrustal belt, and the Paleoarchean 150
terrane in the northwestern part of the belt. All of the mafic samples investigated here have been 151
previously analyzed for 146Sm-142Nd systematics (Rizo et al., 2011; Rizo et al., 2012; Rizo et al., 152 2013). 153 154 2. Geological setting 155
6 156
The samples studied here come from the 3.3 to 3.8 Ga mafic and ultramafic units from the 157
Isua area of southwest Greenland. Additionally, one scheelite (CaWO4) sample from the same
158
area was studied. The mafic samples are the same as discussed in Rizo et al. (2011; 2012; 2013). 159
Consequently, only a brief description of the geological setting for the samples is given here. 160
More details can be found in Nutman and Friend (2009), where complete geological descriptions 161
of all lithologies of the Isua supracrustal belt and associated gneisses are given. 162
The Isua supracrustal belt is located in the Nuuk region of southwest Greenland, and is 163
composed of metamorphosed mafic, ultramafic, and felsic igneous rocks and sedimentary units. 164
The Amitsoq gneisses that intruded the belt at ~3.7 Ga (Baadsgaard et al., 1986) provide a 165
minimum age for the supracrustal rocks. The precursors to the mafic units (now amphibolites) 166
have been characterized petrologically and geochemically as boninites, tholeiites and picrites 167
(Gill et al., 1981; Polat et al., 2002; Rosing et al., 1996; Polat and Hofmann, 2003). The ~ 3.7-3.8 168
Ga spatially, and presumably temporally, associated ultramafic units have been suggested to 169
represent mantle residues (Friend and Nutman, 2011). A recent study, however, suggested that 170
the protoliths of these rocks were instead igneous cumulates, formed by accumulation of olivine, 171
spinel, plagioclase and orthopyroxene from tholeiitic and boninitic magmas (Szilas et al., 2014). 172
The mafic Ameralik dykes intruded both the supracrustal rocks and the Amisoq gneisses at ~ 3.4 173
Ga. A Paleoarchean terrane devoid of Ameralik dykes, and composed of mafic rocks and felsic 174
gneisses, is juxtaposed to the northwest fringe of the Isua supracrustal belt. Mafic rocks from this 175
terrane have been geochemically characterized as tholeiites. While the intrusion of ~ 3.1 Ga felsic 176
sheets (Nutman and Friend, 2009) constrains the minimum age for these rocks, Sm-Nd and Lu-Hf 177
isochrons for these rocks suggest an age of ~ 3.3 Ga for their emplacement (Rizo et al., 2013). 178 179 180 181 3. Analytical techniques 182 183 3.1. Tungsten concentrations 184 185
7
Tungsten concentrations of the mafic and ultramafic samples and the scheelite from the 186
Isua supracrustal belt, as well as of the basalt standard BIR-1, the MORB glass standard VE-32, 187
and the Hawaiian basalt standard BHVO-1, were determined by isotope dilution. A calibrated 188
tracer solution containing highly enriched 186W was added to the sample powders (~200 mg) at 189
the outset of the digestion procedure. Separate aliquots of sample powder were used for the 190
isotope dilution and isotope composition measurements. Sample dissolution and sample-spike 191
equilibration were achieved in Savillex vials with a 5:1 mixture of concentrated HF:HNO3, on a
192
hotplate at ~120°C for three days. Samples were then dried down twice and re-dissolved in 2 ml 193
of concentrated HNO3, followed by two successive dry downs and re-dissolutions in 5 ml of 6M
194
HCl. All the samples were completely dissolved, except for the scheelite sample. After the 195
dissolution, a white precipitate was observed in the scheelite sample. This residue was probably 196
tungstic acid (H2WO4), which is a common precipitate observed during conventional acid
197
digestion of scheelites (Chu et al., 2012). Chu et al. (2012) concluded that formation of this 198
precipitate does not cause mass fractionation of Nd, so we consider it unlikely that W isotope 199
ratios were modified by these processes. 200
The W fraction was separated using an anion-exchange column filled with 1 ml of AG1-201
X8 resin. Total blanks were between 0.3 to 0.4 ng, which represent a maximum of 5% for the 202
samples with the lowest W concentrations. Tungsten concentrations were determined using the 203
Thermo iCap Q ICP-MS at the Department of Terrestrial Magnetism (DTM) of the Carnegie 204
Institution for Science. Instrumental mass bias effects on W were corrected through sample-205
standard bracketing with an Alfa Aesar W standard and using an exponential law and a value for 206
186
W/184W of 0.92767. 207
The accuracy of the W concentration measurements was monitored via analysis of the 208
standards BIR-1, VE-32, and BHVO-1 (Table 1). The BIR-1 mean W concentration for 3 209
different dissolutions of 6.9 ± 1.7 ppb (2σm, n=3) is consistent with the mean values of 6.0 ppb
210
and 6.1 ppb of Babechuk et al. (2010), and 7.2 ppb of König et al. (2011). The VE-32 W 211
concentration was measured at 56.0 ± 4.0 ppb (2σm, n=2), consistent with the value of 56.8 ppb
212
of Arevalo and McDonough (2008). BHVO-1 gave a mean value of 274 ± 7 ppb, which is 213
identical within errors to the compiled value of 270 ppb reported in Govindaraju (1994). External 214
precision as determined from multiple measurements of the same sample is typically better than ± 215
10% (2r.s.d.). 216
8 217
3.2. Tungsten stable isotopic compositions 218
219
The stable isotope compositions of W in six Isua mafic samples (00-007, 00-010, 00-029, 220
00-039, 00-042 and 460257, Table 2) were measured using the Nu Plasma HR at DTM. 221
Tungsten solutions from samples and the Alfa Aesar standard were prepared in 0.4 M HNO3 acid
222
to each have ~200 ppb W. Solutions were aspirated into the plasma using an MCN 6000 223
desolvating nebulizer. Instrumental mass fractionation was monitored using the Alfa Aesar W 224
standard solution, which was analyzed before and after each sample. Fractionation of the standard 225
over the total course of these measurements (7.5 hours) was 0.2‰ per AMU. No instrumental 226
fractionation correction was applied to the samples or the standards. Internal precision of the 227
analyses was, on average, 0.02, 0.1 and 0.02 ‰ (2σ) on the 182W/184W, 183W/184W and 186W/184W 228
ratios, respectively. 229
230
3.3. Re-Os isotopic compositions and highly siderophile element abundances 231
232
Enriched tracer solutions of 185Re, 190Os, and mixed 191Ir-99Ru-194Pt-105Pd spikes and ~1g 233
of sample powder were sealed in borosilicate Carius tubes with 4ml of concentrated HCl and 5ml 234
of concentrated HNO3. The Carius tubes were placed in an oven at 270°C for four days. Osmium
235
was extracted from the acid solution into carbon tetrachloride (Cohen and Waters, 1996), then 236
back-extracted into 4ml of concentrated HBr, and further purified using a micro-distillation 237
technique (Birck et al., 1997). Rhenium, Ir, Ru, Pt and Pd were separated and purified using 238
anion exchange column chromatography (Rehkämper and Halliday, 1998). 239
Osmium isotope analyses of the ultramafic samples were performed at DTM on a Thermo 240
Fisher Triton thermal-ionization mass spectrometer (TIMS) using OsO3- ions. Ion beams were
241
quantified via peak hopping using a single electron multiplier. Typical ion intensities for 192OsO3-
242
were ~ 200,000 cps. Instrumental mass bias effects on Os were corrected using an exponential 243
law and a value for 192Os/188Os of 3.083. The internal precision for 187Os/188Os of all analyses 244
was better than ±0.5% (2s.d.). The Os blank contribution was between 1.2 and 2.0 pg. Possible 245
185
Re was monitored at mass 233 during each analysis. The signal at this mass never exceeded 5 246
cps and no corrections on mass 235 (187OsO3-) were made. Two sessions of analyses gave values
9
for 187Os/188Os of the DTM internal J-M Os standard of 0.17374 ± 4 and 0.17399 ± 6, which are 248
in good agreement with the previous published value of 0.173927±5 measured on Faraday cups 249
(e.g. Luguet et al., 2008). Concentrations of Os were determined with an uncertainty better than 250
0.3% (2 r.s.d.). Osmium isotopic compositions of the mafic samples were measured at the 251
University of Maryland (UMd) using a NBS mass spectrometer. Run conditions were identical to 252
those described above for the Triton analyses. For this instrument, two analyses of 150 pg of the 253
UMd Os standard gave values for 187Os/188Os of 0.1139 ± 2 and 0.1140 ± 2, which are both 254
consistent with the accepted value of 0.11376 ± 11 (e.g. Puchtel et al., 2014). 255
Rhenium, Ir, Ru, Pt and Pd concentrations were determined on either a Thermo iCap Q 256
ICP-MS at DTM or a Nu Plasma instrument with a triple electron multiplier configuration in a 257
static mode at the UMd. The concentrations for all the HSE using the iCap Q were determined 258
with < 5% (2 r.s.d.) uncertainties, except for Re of samples 050004 and 879300, which were 259
determined with a precision of 16% and 15%, respectively. The instrumental mass fractionation 260
of these analyses was corrected using the standard-sample bracketing method (one standard 261
measured before and after every sample). Highly siderophile element concentrations were 262
determined with ±2% of uncertainty on the Nu Plasma for Ru, Pt, and Pd, and ±0.5% for Re and 263
Ir. The accuracy of the data on this instrument was assessed by comparing the results for the 264
reference materials UB-N and GP-13 obtained during the ongoing analytical campaign (Puchtel 265
et al., 2014). Concentrations of all HSE and Os isotopic compositions obtained at the UMd were 266
in good agreement with the data for these standards reported by other laboratories (Puchtel et al., 267
2014). Diluted spiked aliquots of iron meteorites were run during each analytical session as 268
secondary standards. The results from these runs agreed within 0.5% for Re and Ir, and within 269
2% for Ru, Pt, and Pd, with fractionation-corrected values obtained from measurements of 270
undiluted iron meteorites using Faraday cups of the same instrument with a signal of >100 mV 271
for the minor isotopes. 272
Total analytical blank determined during the course of the analytical campaign averaged 273
(pg, 2σ): 2 ± 1.5 (Re), 1.6 ± 0.5 (Ir), 56 ± 10 (Ru), 47 ± 5 (Pt), 4 ± 0.5 (Pd). These correspond to 274
blank contributions of less than 0.7%, except for Re (< 7% for all samples, except for samples 275
050004 and 879300 which have less than 9 pg Re, and for which blank contributions were ~25% 276
and ~ 22%, respectively). 277
10 3.4. Tungsten isotopic composition
279 280
Sample dissolution and chemical separation protocols followed for W isotopic 281
measurements are described in detail in Touboul and Walker (2012). Appropriate amounts of 282
sample powder sufficient to extract ~1.5 μg of W (1.5 to 7g) were digested in a 5:1 mixture of 283
concentrated HF:HNO3 in Savillex vials placed on a hotplate at 120°C for four days. After
284
evaporation to dryness, the samples were taken up in ~ 10ml of concentrated HNO3 and dried
285
down. This step was repeated twice. The samples were then re-dissolved in ~ 20ml of 6M HCl 286
and placed in a closed Teflon vessel on a hotplate at 120°C overnight. If undissolved sample was 287
visible, the residue was re-dissolved in concentrated HF:HNO3. Once clear sample solutions were
288
obtained, they were evaporated to dryness. Tungsten was then separated from the bulk rock by 289
first using cation exchange chromatography, followed by a three-step anion exchange separation 290
procedure. Tungsten yields for each sample were assessed at the end of the chemical purification. 291
A small aliquot of each purified sample was taken and their W concentrations determined using 292
the Thermo iCap Q ICP-MS by comparison of signal intensity to a W standard solution of known 293
concentration. Yields were always better than 80%. Total blanks were measured systematically 294
and never exceeded 10 ng, representing less than 1% of the total amount of W processed for each 295
sample, and were therefore negligible. 296
Tungsten isotopic compositions were analyzed as W oxide (WO-3) using the Thermo-297
Fisher Triton thermal-ionization mass spectrometer at DTM. Samples were loaded onto zone-298
refined Re filaments, previously outgassed at ~ 2A under a vacuum. Each measurement consisted 299
of data acquisition for 42 blocks of 30 ratios each (8s integration time), while using amplifier 300
rotation. Baselines were measured every block by beam deflection for 30 cycles (each of 1.05 s). 301
Measurements were performed using 2 steps of static acquisition, where Faraday cups were set 302
for peak coincidence with a first step having 183W in the axial cup, and then the zoom lens was 303
adjusted to achieve peak-cup coincidence for the second step that placed 185W in the axial cup. 304
During measurements, isobaric interferences for W were always monitored and were below 305
detection limit for Ta, and never exceeded 0.25 for the 185Re/182W ratio and 0.007 for 188Os/182W. 306
Tungsten isotope ratios were corrected for instrumental mass fractionation using an exponential 307
law and 186WO3/183WO3=1.994902 as normalizing ratio (oxide ratio calculated from metal ratios
308
from Lee and Halliday, 1997, using an oxygen isotopic composition of 17O/16O = 0.0003749 and 309
11
18
O/16O = 0.0020439 (Nier, 1950). After this correction, the 182W/184W vs. 183W/184W ratios of the 310
samples and the standards showed a positive correlation (R2=0.9875 and R2=0.9917, respectively, 311
Figure S1, Supplementary material), with slopes that are identical within errors (2.225±0.077 312
(2σ) and 2.238±0.078 (2σ), respectively). This observation is consistent with Touboul and 313
Walker (2012). They suggested that this correlation results from the effects of mass dependent 314
oxygen isotope fractionation on the W ratios. The second-order correction for oxygen isotope 315
fractionation was performed using the slope resulting from the 182W/184W vs. 183W/184W 316
correlation of the standards (2.238) and a ratio of 183W/184W= 0.416729. More details of the 317
correction method can be found in Touboul and Walker (2012). The Alfa Aesar W standard was 318
measured on a regular basis during the different analytical sessions and gave an average value for 319
the 182W/184W ratio of 0.864766 ± 0.000004 (± 4.6 ppm, 2σ, n= 6) for session B494, 0.864767 ± 320
0.000003 (± 3.5 ppm, 2σ, n= 4) for session B504, 0.864771 ± 0.000004 (± 5 ppm, 2σ, n= 3) for 321
session B530 and 0.864770 ± 0.000004 (4.8 ppm, 2σ, n= 9) for session B554. The 182W isotope 322
ratios are hereafter expressed in μ-units and calculated relative to the average value obtained for 323
each session of the Alfa Aesar W standard (μ182W = (182W/184W)sample/(182W/184W)standard -1)×106).
324 325
4. Results 326
327
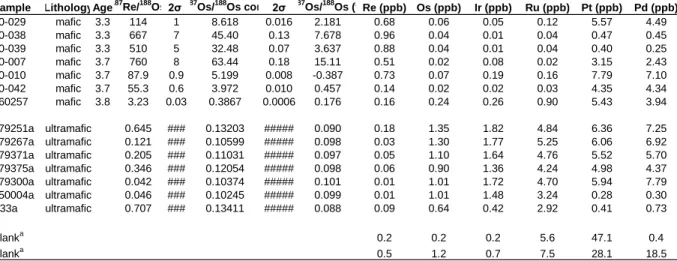
4.1. Re-Os and HSE abundances 328
329
Rhenium-osmium isotopic data for the mafic and ultramafic samples are provided in 330
Table 3 and shown in Figure 1. On the Re-Os isochron diagram the data for most mafic samples 331
plot between the 3.3 Ga and 3.8 Ga reference isochrons (Figure 1A), except for mafic sample 00-332
007, which plots well above these reference isochrons. All mafic rocks combined, excluding 00-333
007, define a trend with a positive slope corresponding to an age of 3.85±0.27 Ga and an initial 334
187
Os/188Os = 0.1±1.7 (MSWD = 354). The large uncertainty on the initial Os isotopic 335
composition reflects the high Re/Os ratios of the mafic samples and the scatter about the 336
regression line. Although there is considerable scatter, these data suggest that the Re-Os isotopic 337
systematics of most of these rocks have been generally closed since the Eoarchean. Given that Re 338
is typically the most mobile of the HSE, these results also suggest that the abundances of the 339
other HSE present in these rocks have been little affected by post Eoarchean processes. 340
12
By contrast, the ultramafic samples do not plot within uncertainties of the 3.3-3.8 Ga 341
reference isochrons (Figure 1B), despite the fact that they likely formed within that time interval. 342
These samples define a scattered correlation on the Re-Os isochron diagram corresponding to an 343
age of 2.82±0.33 Ga, an initial 187Os/188Os of 0.1011±0.0023, and an MSWD = 256. The scatter 344
is reduced somewhat if the data for sample 879375a is excluded from the regression 345
(MSWD=32) but the age (2.80 ± 0.16 Ga) and initial 187Os/188Os (0.1007 ± 0.0011) are not 346
significantly different from those determined using the data for all ultramafic samples. The age of 347
~ 2.8-2.9 Ga corresponds to a well-known metamorphic episode within the Isua supracrustal belt 348
(Blichert-Toft and Frei, 2001; Frei et al., 2001; Gruau et al., 1996; Rollinson, 2009; Rizo et al., 349
2011), suggesting that the Re-Os systematics in the ultramafic rocks were affected by this 350
metamorphic event. Nevertheless, the initial 187Os/188Os of the isochrons for the ultramafic rocks 351
of 0.1007 ± 0.0011 is similar, within errors, to the initial 187Os/188Os ratio of olivine and spinel 352
separates from ~3.8 Ga peridotites from southwest Greenland (0.1021±0.0002 and 353
0.1009±0.0002, respectively, Bennett et al., 2002). These 187Os/188Os ratios are also identical 354
within errors to the chondritic 187Os/188Os ratio at 3.7-3.8 Ga. As with the mafic rocks, the HSE 355
abundances of the ultramafic rocks may primarily reflect their Eoarchean abundances, but the 356
evidence of open-system behavior of the Re-Os systematics requires some level of caution in 357
interpreting these concentrations. 358
Abundances of the HSE in whole rock mafic and ultramafic samples from the Isua 359
supracrustal belt are reported in Table 3 and presented in Figure 2. The mafic rocks show strong 360
depletions in the Ir-group platinum-group elements (IPGE: Os, Ir, Ru), and relative enrichments 361
in the Pt group PGE (PPGE: Pt, Pd), as well as Re. Most of the ultramafic samples show 362
positively sloped HSE patterns with slight enrichment in the more incompatible HSE (Pt, Pd), 363
although with significant depletions in Re. Two samples, S33 and 050004, show more irregular 364
patterns, with relative enrichments in Ru, and strong depletions in Pt. 365
366
4.2. Tungsten concentrations and isotopic compositions 367
368
The W concentrations for the mafic, ultramafic and scheelite samples from the Isua 369
supracrustal belt, and the standards BIR-1, BHVO-1 and VE-32 are presented in Table 1. 370
Collectively, mafic and ultramafic samples from Isua have W concentrations that range from 123 371
13
to 943 ppb, except for mafic samples 460217 and 460219 that have much higher concentrations 372
of 2.6 ppm and 3.1 ppm, respectively. The measured W concentration in the scheelite was 190 373
ppm, but this concentration is likely not representative of the material because of the strong 374
possibility that considerable W was removed into the precipitate following the digestion. 375
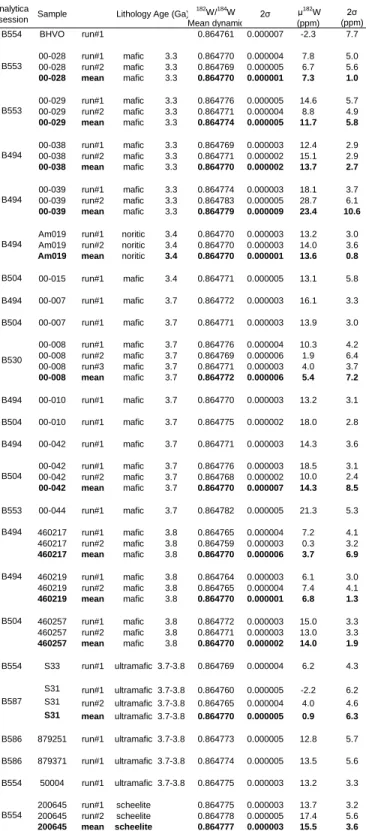
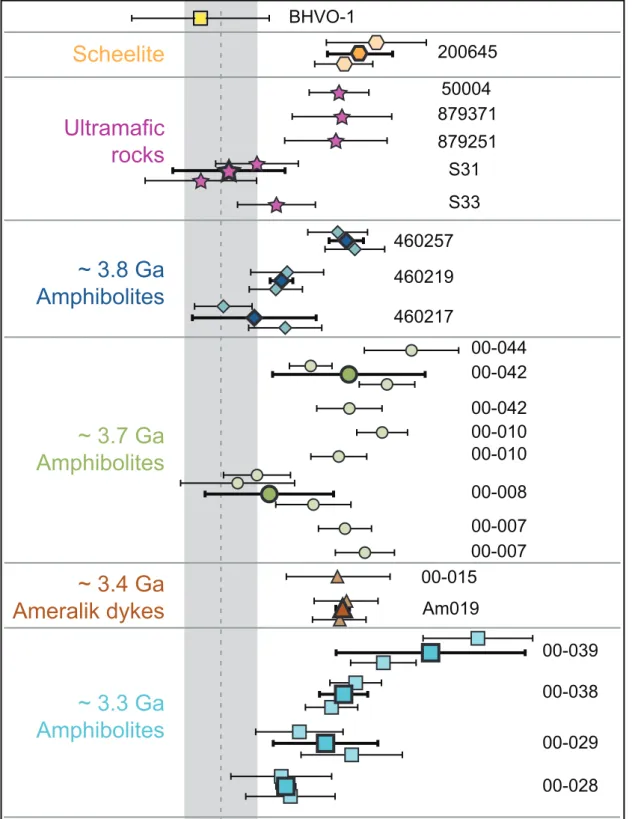
The W isotopic data for the mafic, ultramafic and scheelite samples from the Isua 376
supracrustal belt, the BHVO-1 rock standard and the Alfa Aesar W standard solution are 377
presented in Table 4 and Figure 3. Tungsten ratios were acquired using one to three 378
measurements from a single filament loading. The external reproducibility for the 182W/184W 379
mean of the single filament loadings of the samples was, in general, better than ±5 ppm (2SD), 380
which is similar to the external reproducibility of the standard. The measured 182W/184W ratio in 381
the BHVO-1 standard is identical to the mean value of the Alfa Aesar standard within error 382
(μ182
W=0). Most of the ~3.3 Ga (n=4), ~3.4 Ga (n=2), ~3.7 Ga (n=5) and ~3.8 Ga (n=2) mafic 383
samples, as well as the scheelite and three ultramafic samples, show well resolved excesses of 384
182
W, compared to the standard. The samples with the poorest external reproducibility were 385
samples 00-039 and 00-044, which yielded μ182W = +23 ± 11 ppm and 14 ± 9 ppm, respectively. 386
The resolvable positive μ182
W anomalies for the different age groups range from +7 to +21 ppm 387
(Fig. 3). The results for three samples (00-007, 00-010 and 00-042) were duplicated, and 388
processed via two separate digestions each. Tungsten from these duplicated dissolutions gave 389
μ182
W values that were indistinguishable within ±5 ppm. The μ182W results for most samples are 390
in good agreement with previously reported excesses of +9 to +15 ppm for 7 samples from the 391
Amitsoq gneiss complex, where W isotope data were obtained by MC-ICP MS (Willbold et al., 392
2011). Samples 460217, 460219 (3.8 Ga amphibolites), and S31 and S33 (ultramafic rocks), 393
however, have W isotopic compositions that are indistinguishable from the standard. Overall, 394
there appears to be no diminution in the magnitude of 182W enrichment with decreasing age (Fig. 395
4), in contrast to published data for 142Nd (Rizo et al., 2013). 396
397
5. Discussion 398
399
5.1. Natural mass fractionation and the genesis of 182W anomalies 400
14
Mass-dependent isotope fractionation can be caused by equilibrium and kinetic chemical 402
reactions. This fractionation is important to consider when attempting to measure very small 403
differences in non-mass dependent isotopic ratios, such as 182W/184W. Mass independent 404
anomalies are normally calculated after correction for instrumental mass fractionation during 405
analysis, on the assumption that the mass dependency of the instrumental fractionation follows an 406
exponential law (e.g., Russell et al., 1978; Hart and Zindler, 1989). By contrast, there is no reason 407
to believe that chemically induced mass fractionation follows the same laws (Russell et al., 1978). 408
Application of exponential mass fractionation corrections to samples that are initially fractionated 409
following some other mass dependency can create apparent anomalies that deviate in magnitude 410
away from the isotope pair used for mass fractionation correction (e.g., Hart and Zindler, 1989; 411
Upadhyay et al., 2008; Andreasen and Sharma, 2009; Carlson, 2014). 412
The magnitude of isotope fractionation for high atomic number elements, such as W, is 413
expected to be limited due to the small relative mass differences between the W isotopes. 414
Nevertheless, Irisawa and Hirata (2006) showed that, while igneous samples displayed no mass 415
dependent fractionation of W isotopes, mass dependent fractionations of 0.05 and 0.15 per mil 416
per amu were observed in an ore and a sediment sample, respectively. They also showed mass 417
dependent fractionation of W isotopes resulting from ion exchange chromatography when 418
recovery was less than 70%. They suggested that low temperature precipitation and/or 419
evaporation-condensation processes during sample formation could cause the observed 420
fractionations. Such processes must be considered possible for the rocks from the Isua 421
supracrustal belt, especially given the presence of scheelite in the vicinity of some of the rocks 422
studied. 423
The samples studied here have positive average μ182W anomalies of +15 ppm. We have 424
modeled the amount of mass dependent fractionation necessary to produce these μ182W 425
anomalies, using linear, power, Rayleigh and equilibrium mass fractionation laws. Figure 5 426
shows W isotope anomalies created by an exponential correction of W that has been naturally 427
fractionated through the different mass dependencies. This model indicates that a sample that has 428
undergone a linear- or power-law mass dependent fractionation of 0.65 per mil per AMU will 429
result in apparent μ182W anomalies of +15 ppm, after the correction of the W ratios with the 430
exponential law, as used for the TIMS measurements. By contrast, the model also shows that a 431
15
rock that has undergone mass dependent fractionation following Rayleigh or equilibrium laws 432
will yield negative apparent μ182
W anomalies after exponential correction. 433
The results for the measured stable W isotopic composition by MC-ICPMS for 6 samples 434
from the Isua supracrustal belt are shown in Figure 6. The absence of instrumental fractionation 435
correction accounts for the observed correlation between the different W isotope ratios. 436
Compared to the Alfa Aesar standard, the mean δ182W, δ183W and δ184W values (where is the 437
per mil deviation of the isotopic ratio from the standard) for the 6 samples are 0.0±0.1. Thus, we 438
conclude that the μ182W anomalies measured by TIMS on the Isua samples are not due to mass 439
dependent fractionation of W stable isotopes. 440
441
5.2. Tungsten concentrations and 182W/184W 442
443
To constrain the 182W/184W ratio of the mantle source(s) of the mafic and ultramafic 444
samples from the Isua supracrustal belt, we first consider whether the W now present in these 445
rocks is representative of the W present in the rocks at the time their igneous protoliths formed. 446
Experimental and empirical evidence indicates that W behaves as a highly incompatible element 447
in silicate melts, closely following the behavior of U, Th and Nb (Arevalo and McDonough, 448
2008; König et al., 2011). However, for the mafic samples analyzed in this study, there is no 449
correlation between W and U, Th, Nb or MgO concentrations, despite the fact that U is correlated 450
with Th and with Nb (Fig. S2, Supplementary material). This observation suggests that the W 451
concentrations of the Isua rocks do not follow a simple magmatic differentiation trend. Consistent 452
with this, many of the mafic samples analyzed here have higher W concentrations than would be 453
expected for basalts derived from a mantle source characterized by W concentrations similar to 454
those estimated for the bulk silicate Earth (BSE: ~12-13 ppb; Arevalo and McDonough et al., 455
2008, König et al., 2011). The magnitude of W enrichments, compared to Th and Nb, are listed in 456
Table 1. Partial melting and simple crystal-liquid fractionation calculations using a partition 457
coefficient value for W of 0.02 (Shearer and Righter 2003), suggest that a magma generated by 458
10% partial melting of a source containing ~13 ppb of W would have ~100 ppb W. The W 459
concentration of such a primitive magma could potentially increase, due to fractional 460
crystallization, to as high as ~ 180 ppb for 40% fractional crystallization. Therefore, of the mafic 461
16
samples, only 460257, 460203, 00-014 and 00-015 have W concentrations within the range 462
expected for typical melts of a mantle source with BSE-like W concentrations. 463
The ultramafic samples studied here have concentrations between ~150 and ~950 ppb, 464
although five out of seven samples have concentrations <250 ppb. Regardless of the origin of 465
these rocks (mantle residues or cumulates from ultramafic liquids), most of these concentrations 466
are also too high to have been derived from normal mantle via common igneous fractionation 467
processes. Comparably high W concentrations have been measured in some non-contaminated 468
and highly melt-depleted upper mantle peridotites, suggesting that W can sometimes be retained 469
in an Os-Ir-Ru alloy phase (Babechuk et al., 2010). Consistent with this, high concentrations of 470
W have been documented for some Os-Ir-Ru alloys (Barkov et al., 2006), although, these alloys 471
are interpreted to have formed during secondary metasomatic alteration. Other Os-Ir-Ru alloys 472
that have been analyzed for W, however, have concentrations that are low (Walker et al., 2005). 473
The high concentrations of W present in many of the Isua samples suggest addition of W 474
to mafic and ultramafic precursors from processes other than partial melting and/or fractional 475
crystallization. One possible explanation for the higher than expected W concentrations in some 476
of the supracrustal rocks is by fluid-rock interaction in the mantle source region, given that there 477
is compelling evidence that W can be highly mobile under hydrous conditions (Seiler et al., 2005; 478
Arnórsson and Ókarsson, 2007; König et al., 2008). For example, Touboul et al. (2014) proposed 479
that high W concentrations in some Nuvvuagittuq supracrustal rocks were the result of the 480
hydrous transfer of fluid mobile elements, including W and Ba, from recycled crust into the 481
mantle sources of the rocks. For the Isua suite, however, there is a lack of correlation between W 482
and other highly fluid-mobile elements, such as Ba or Rb (Fig. S2, Supplementary material). 483
Another possible explanation comes from the observation that certain Isua mafic rocks 484
were metasomatised via LREE-enriched fluid phases expelled from the surrounding tonalities 485
(Rizo et al., 2012). Tonalitic gneisses from the Gothabsfjord region were analyzed by Willbold et 486
al. (2011) for W isotopic composition and they reported μ182W values of +16 and +20 ppm. 487
Therefore, the interaction of W-rich fluids, derived from tonalitic materials, with the mafic rocks 488
would increase the W concentration of the mafic rocks and impart the W isotopic composition of 489
the surrounding tonalites. 490
The mobility of W in the Isua region is also shown by the occurrences of scheelite in the 491
southern part of the Isua supracrustal belt (Appel, 1986). The one scheelite sample analyzed here 492
17 (200645) has a μ182
W value of +16 ± 4, which is the same within analytical uncertainty as the 493
μ182
W value obtained for samples with the lowest W concentrations (+14.0 ± 1.9 for mafic 494
sample 460257, +13 ± 6 for mafic sample 00-015, +13 ± 6 for ultramafic sample 879251 and +14 495
± 6 for ultramafic sample 789371). This raises the possibility that the W that precipitated to form 496
the scheelite was mobilized from either the tonalites or from the mafic and ultramafic rocks. 497
The Isua samples were subjected to a widely recognized, late-stage 2.8-2.9 Ga 498
metamorphic event (Blichert-Toft and Frei, 2001; Frei et al., 2001; Gruau et al., 1996; Rizo et al., 499
2011; Rollison, 2003), and post-formation Ca-metasomatism particularly affected the ultramafic 500
rocks (Rosing, 1989). As noted, the Re-Os systematics for the ultramafic samples yield a slope 501
corresponding to an age of ~2.8 Ga, consistent with the age of this metamorphic event. 502
Modification of W concentrations by fluids rich in W during these alteration episodes could be 503
responsible for the unusually high W concentrations in some samples. These episodes could also 504
have modified the 182W/184W ratios of the samples, if the fluids had different W isotopic 505
compositions than the precursor igneous rocks. For example, samples S31 and S33 have the 506
highest W concentrations among the ultramafic rocks (566 and 873 ppb, respectively), and are 507
characterized by only modestly enriched μ182W values of +5.8 and +4.7, respectively. Both 508
samples also have the highest CaO contents (respectively, 3 and 8 wt.%, Table S1 Supplementary 509
material), the origin of which could have been Ca-rich fluids percolating through the rocks. 510
Further, samples 460217 and 460219, which have the highest W concentrations of the mafic suite 511
examined here (2.6 ppm and 3.1 ppm, respectively), do not show any resolvable 182W anomalies 512
compared to the standard. Collectively, the weak trend in W isotopic composition vs. W 513
concentration in the high W concentration samples suggests that the high W concentration in the 514
mafic and ultramafic rocks could have been caused by interactions with W-rich fluids that had 515
“normal” (μ182
W=0) terrestrial W isotopic compositions. For the rest of the samples, however, 516
there is no clear correlation between W concentration and 182W/184W ratios (Fig. S3, 517
Supplementary material). 518
We conclude that there is ample evidence for mobilization of W-rich fluids in the rocks of 519
the Isua Supracrustal Belt. The observations, however, are somewhat contradictory. Given the 520
radiogenic nature of the scheelite, it appears that at least some fluids carried a 182W-rich signature. 521
The most likely source of the mobilized W was the tonalites, or the mafic and ultramafic rocks. 522
The fact that some rocks, with W concentrations that can be attributed to their igneous precursors, 523
18
are characterized by the same isotopic composition suggests that this signature originated in the 524
mantle. The mafic and ultramafic rocks characterized by high W concentrations, but low to 525
normal 182W values, appear to have equilibrated with another fluid carrying a normal W isotopic 526
composition. The origin of this fluid remains enigmatic, but could represent a crustal component 527
that is not sampled by the suite examined. 528
529
5.3. Radiogenic decay of 182Hf as the cause of 182W anomalies 530
531
Elevated 182W/184W ratios have now been reported for the Kostomuksha komatiites 532
(Touboul et al., 2012), the Nuvvuagittuq supracrustal rocks (Touboul et al., 2014), the Acasta 533
gneisses (Willbold et al., 2015), and this study confirms the report by Willbold et al. (2011) of 534
182
W excesses in samples from the Isua supracrustal belt. These excesses could have been 535
produced by exogenous additions to the Earth (Willbold et al., 2011, Willbold 2015), by 536
endogenous ingrowth of 182W in the silicate Earth (Touboul et al., 2012), or both. We consider 537
both categories of processes that may have led to the 182W excesses in the Isua suite, in 538
conjunction with accompanying 142Nd, 187Re-187Os and HSE data. 539
540
5.3.1 Sluggish mixing of late accretionary additions into the mantle. 541
542
Willbold et al. (2011) concluded that the Isua rocks they examined were derived from a 543
mantle source that was missing a substantial portion of its late accretionary component. They 544
noted that removal of ~0.5 wt% (of Earth’s total mass) of a chondritic component from the 545
mantle would result in a W isotopic composition in the mantle that would be enriched in 182W 546
compared to the modern mantle to the approximate level observed in the Isua rocks (~ 15 ppm). 547
Minor late accretionary additions to the mantle can have such an effect on its W isotopic 548
composition because chondrites are characterized by W concentrations that are approximately a 549
factor of 10 higher than the BSE, and the W isotopic composition of chondrites is highly-depleted, 550
with μ182
W values of ~-200 (Kleine et al., 2002). Portions of the mantle lacking a major portion 551
of the ~0.5 wt.% late addition would have HSE abundances that would be significantly lower 552
compared to those found in the modern mantle. This interpretation is also generally consistent 553
with a gradual downward mixing of late accreted materials into the mantle, as suggested by the 554
19
apparent increase in the concentrations of Pt in 3.5 to 2.9 Ga komatiites (Maier et al., 2009). This 555
model predicts that there should be no correlation between μ182W and μ142Nd in the mantle 556
source of the Isua rocks, because the Nd concentrations (~0.6 ppm and ~ 1 ppm, respectively) 557
and isotopic compositions of chondrites and Earth are so similar, so the late accretionary addition 558
would have negligible effect on 142Nd. 559
By contrast, a model invoking the sluggish mixing of late accretionary additions within 560
the mantle predicts that there should be a negative correlation between mantle source abundances 561
of HSE and μ182
W. Thus, if the positive μ182W values of the Isua rocks reflect a deficit of the late 562
accretionary component, the rocks should also be characterized by lower HSE contents compared 563
to modern analogs. 564
The behavior of HSE during mantle melting is strongly controlled by the mineralogy and 565
oxygen fugacity of the source rocks, as well as the degree of crystallization (particularly of 566
sulfides) en route to the surface. This makes it difficult to precisely estimate the HSE abundances 567
in the sources of ancient, relatively evolved, mantle-derived rocks. One approach is to compare 568
the total HSE abundances in the ancient samples to those of modern rocks with similar origin and 569
similar degree of fractionation (e.g., similar MgO contents). A more quantitative approach is to 570
compare Pt concentrations between the ancient rocks and their modern equivalents. Platinum is 571
perhaps the most useful of the HSE with which to assess absolute mantle source concentrations 572
because it has a distribution coefficient near one during partial melting of the mantle, as well as 573
during crystal-liquid fractionation (e.g., Walker, 2014). 574
Absolute and relative abundances of the HSE in the Isua mafic rocks are similar to those 575
in modern mid-ocean ridge basalts, oceanic island basalts, and continental flood basalts (e.g., 576
Bézos et al., 2005; Rocha-Junior et al., 2012; Day, 2013)(Fig. 2). The Pt concentrations of the 577
mafic rocks (excepting low Pt samples 00-038 and 00-039) range from 40 to 100% of the 578
estimate for the Pt concentration of the modern BSE (7.6 ppb; Becker et al., 2006), with an 579
average for the five samples of 70%. If the precursor rocks are assumed to have been basaltic, 580
and Pt was slightly compatible during mantle melting, the mantle source concentration was likely 581
to have been >70% of the modern bulk silicate Earth. For the mafic rocks, there is no correlation 582
observed between the Pt abundance and age of these rocks. 583
The concentrations of the HSE in the ultramafic rocks are generally lower than typical 584
mantle lherzolites. With the exception of the Re depletions, however, the HSE patterns of the 585
20
ultramafic rocks are broadly similar to some mantle harzburgites and dunites, as well as some 586
early Archean komatiites (e.g., Büchl et al., 2002; O’Driscoll et al., 2012; Puchtel et al., 2014). 587
Samples S33 and 050004 show more irregular patterns, with relative enrichments in Ru, and 588
strong depletions in Pt that are similar to some modern harzburgites. These types of patterns have 589
been interpreted to reflect either sulfide break down during emplacement, or late stage mobility 590
of sulfide (Fischer-Gödde et al., 2011). Except for the latter two samples, the Pt concentrations in 591
the ultramafic rocks range from 60 to 80% of the bulk silicate Earth estimate for Pt, and average 592
66% (n=5). As with the mafic rocks, this estimate represents the lower limit for the Pt 593
concentrations in the source of the ultramafic rocks. 594
If the magmatic precursors to these Eoarchean rocks were produced by mantle melting 595
processes similar to today, and their HSE abundances are reflective of the concentrations in the 596
precursor rocks, then the HSE data for the mafic and ultramafic rocks appear to be broadly 597
similar to possible modern analogs. Thus, the Isua suite does not appear to have been derived 598
from a mantle source that was strongly depleted in HSE. Further, Re-Os systematics of the Isua 599
ultramafic rocks are consistent with a source that incorporated a major complement of late 600
accretionary component. Since the partition coefficient of Os between metal and silicate is higher 601
than that for Re, the mantle following core formation but before the addition of late accreted 602
materials would have evolved with a much higher Re/Os ratio than the mantle that incorporated 603
these materials. A mantle source that differentiated at ~4.5 Ga that had not yet received its late 604
accretionary component, and that is sampled at ~ 3.8 Ga, would be estimated to have a 605
187
Os/188Os ratio of ~0.15 (Walker et al., 2009). The 187Os/188Os of the Isua ultramafic rock 606
source is ~ 0.10 and overlaps with the chondritic value, suggesting that at least the source of the 607
ultramafic Isua lavas was overprinted by chondritic material. Combined HSE abundances, Re-Os 608
systematics and μ182W values for the Isua suite are, therefore, difficult to reconcile with the 609
model proposed by Willbold et al. (2011). 610
611
5.3.2 Multiple core formation events during Earth growth 612
613
An alternative explanation for Isua’s elevated 182W/184W ratio is that its mantle source 614
records an older age of core formation than does the average modern mantle. During Earth 615
accretion, discrete mantle domains may have formed with different Hf/W ratios after each core-616
21
forming event following an accretionary impact large enough to instigate an episode of metal-617
silicate separation. The siderophilic nature of W may have been affected differently in each of 618
these events because of the different pressures, temperatures and possibly O fugacities involved 619
(e.g. Wade and Wood, 2005). The variability in both Hf/W ratios and the timing of the multiple 620
core-forming events in the heterogeneous mantle would have led to variations in 182W/184W, if the 621
domains were generated while 182Hf was still extant. If late accretion then followed these primary 622
accretionary events, HSE (and W with chondritic μ182W) would subsequently get mixed into this 623
isotopically “grainy” mantle without mixing out all of the W isotopic heterogeneity. This 624
alternative model allows the formation of mantle domains with broadly “normal” HSE 625
abundances, but variable μ182W values. As with the previous model discussed, this process would 626
not be expected to produce a correlation between 182W and 142Nd. 627
This alternative model assumes that impact-related or convection-induced large scale 628
mixing in the mantle did not erase the discrete events of metal-silicate separation that occurred as 629
the Earth grew by accretion. The likelihood of survival of such heterogeneities is unknown, but 630
the presence of short-lived isotopic anomalies in late Archean rocks suggests that such 631
heterogeneities are not easily mixed away (Touboul et al., 2012, Debaille et al., 2012). This 632
model also requires that some mantle domains evolved to 182W/184W ratios that were substantially 633
higher than estimates for the BSE, prior to late accretion. Figure 7 shows μ182W versus the Ir 634
contents of a high 182W/184W mantle domain, such as that of Isua, and the effects that late 635
accretion would have had on this reservoir. For such a mantle reservoir to end up with modern 636
mantle Ir abundances (3.5 ppb) through late accretion, its μ182W would have to have been +23 to 637
+31 ppm before the late accretionary component was added. These values are similar to the 182W 638
excesses of 20 to 25 ppm recently identified for the lunar mantle relative to the modern terrestrial 639
mantle (Touboul et al., 2015; Kruijer et al., 2015). 640
641 642 643
5.3.3. Early silicate differentiation in the mantle 644
645
Another way to generate variable 182W/184W in the mantle is by silicate crystal-liquid 646
fractionation during the lifetime of the parent isotope 182Hf. In this case, the Hf/W and resulting 647
22
182
W/184W ratios in differentiated portions of the mantle may not be correlated with HSE 648
abundances. An important distinction between this way of generating variations in 182W/184W 649
compared with those induced by the sluggish mixing of late accretionary additions, is that silicate 650
differentiation in the mantle would likely also have affected Sm/Nd, and with time the 651
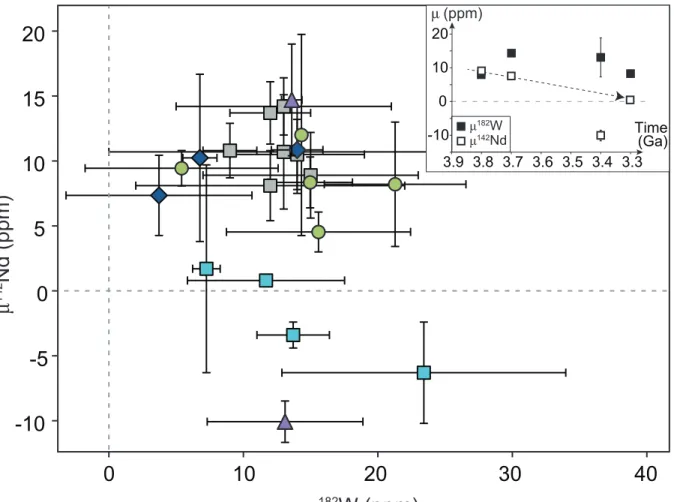
142
Nd/144Nd ratio. When considering both isotopic systems collectively, the daughter elements, 652
Nd and W, are more incompatible than the parent elements, Sm and Hf. Therefore, a positive 653
correlation between μ182W and μ142Nd would be expected in the differentiated reservoirs, unless 654
the systems were somehow decoupled by subsequent processes. 655
The 3.7-3.8 Ga Isua samples analyzed here show both 182W and 142Nd excesses of 656
between +5 and +21 ppm and between +9 and +15 ppm, respectively (Fig. 4). This is consistent 657
with the idea of coupled Hf/W and Sm/Nd fractionation. The μ182W and μ142Nd values in the Isua 658
mantle source reflect the time of the fractionation event and the degree of Hf/W and Sm/Nd 659
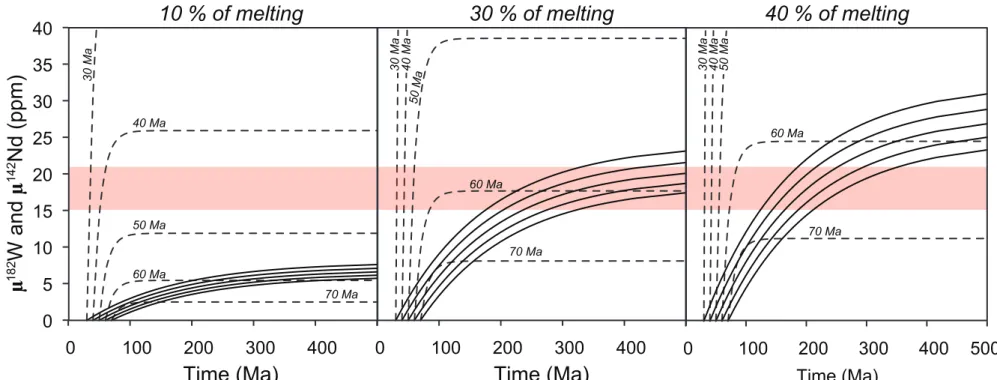
fractionation. Figure 8 shows evolution curves of μ182W and μ142Nd values of a mantle residue 660
that differentiates between 30 Ma to 70 Ma after Solar System formation, and after 10%, 30% 661
and 40% of melt extraction. Because of the differences in partition coefficients (e.g., DHf/DW = ~
662
4.2 while DSm/DNd = ~1.3, Corgne et al., 2005), silicate differentiation events will fractionate the
663
Hf/W ratio more strongly than that of Sm/Nd, leading to considerably higher μ182W than μ142
Nd 664
values in the fractionated reservoirs, if the fractionation occurred early, when 182Hf was 665
comparatively abundant. A mantle residue differentiated prior to ~60 Ma after Solar System 666
formation would be expected to have much higher 182W/184W excesses compared to 142Nd/144Nd. 667
For example, a mantle residue differentiated 30 Ma after Solar System formation, would evolve 668
to values of μ182W= +57 and +254 ppm and μ142Nd= +8 to 31 ppm, for 10% and 40% of melt 669
extraction, respectively. By comparison, differentiation after 182Hf is extinct will lead to an 670
absence of W isotopic variation, although it could still create variability in 142Nd, if the event 671
occurred while 146Sm remained extant. The source of the Isua samples is characterized by 672
maximum μ182W and μ142
Nd values of +21 ppm, and 15 ppm, respectively. A mantle residue after 673
~30% of melt extraction that occurred ~60 Ma after Solar System formation would result in a 674
mantle reservoir that would evolve to W and Nd isotopic compositions similar to the most 675
radiogenic values seen in the Isua samples. 676
Arguing against silicate crystal-liquid fractionation as the cause of the W anomalies is the 677
observation that the Nd data show a decreasing excess in 142Nd with time, whereas the W isotopic 678
23
data show no correlation with the age of the samples (Fig. 4). As a result, the data do not define 679
the expected positive correlation between the Nd and W isotopic compositions. Most perplexing 680
is the ~3.4 Ga Ameralik dyke sample 00-015 that is characterized by a negative μ142Nd value of -681
10, yet by a positive μ182W value of +13. The negative μ142Nd value must reflect an ancient, 682
incompatible element enriched source, yet the positive μ182W value is suggestive of a high Hf/W 683
ratio that may be reflective of incompatible element depleted melt residues or cumulates. This 684
sample is also characterized by a relatively low W concentration of 175 ppb, consistent with a 685
mantle composition with no overprinting via W-rich fluids. 686
The declining 142Nd/144Nd with time in Isua rocks has been interpreted as reflecting the 687
mixing away of early-formed chemical heterogeneities in the SW Greenland mantle (Bennett et 688
al., 2007; Rizo et al., 2013). Yet this process would seemingly also mix away W isotopic 689
heterogeneity. One possible explanation for the lack of correlation between W and Nd isotopic 690
compositions in the Isua samples may be different times of formation of their source regions in 691
the mantle. Figure 9 shows a possible model for the evolution of the Isua mantle source. As 692
discussed earlier, the Isua suite appears to have been derived from a mantle source that had 693
similar HSE abundances to the modern mantle. For this observation to be in agreement with the 694
variations that characterize the samples in 182W/184W, the late accreted material that brought the 695
HSE to the Isua mantle source had to arrive before the differentiation of this mantle (Fig. 9A and 696
B). A first, large-scale differentiation event during the lifetimes of both 182Hf and 146Sm (< 60 697
Ma) would have produced incompatible element depleted mantle reservoirs with positive μ182W 698
and μ142Nd, as well as incompatible element enriched mantle reservoirs, with negative μ182W and 699
μ142
Nd (Figure 9B). If this occurred after substantial late accretion, the HSE abundances in both 700
depleted and enriched reservoirs would have been broadly comparable to the modern mantle. A 701
second differentiation event is envisioned to have affected only the depleted reservoir (Figure 702
9C). Coupled 147Sm-143Nd and 146Sm-142Nd systematics suggest that the source of Isua 703
differentiated 100-150 Ma after Solar System formation (Bennett et al., 2007; Caro et al., 2006; 704
Rizo et al., 2012). Given this time constraint, and the difference in half-lives of 182Hf and 146Sm, 705
this second differentiation event would have occurred after 182Hf was no longer extant, but while 706
146
Sm was still extant. This event would, therefore, be recorded in Nd isotopic composition, but 707
not in W. 708
24
Possible differentiation mechanisms for this second event could include the formation of 709
an early basaltic crust, which would be enriched in incompatible elements and would have had 710
negative μ142Nd, but positive μ182W. The extraction of this crust would have left a depleted 711
mantle with positive μ142Nd and μ182W. Other possible mechanisms for the differentiation events 712
invoked in the model shown in Figure 9 is differentiation resulting from melting, followed by 713
crystal-liquid fractionation of the mantle after giant impacts. The high 3He/22Ne of the present-714
day mantle has been interpreted to reflect the outcome of multiple magma ocean events during 715
the growth of Earth (Tucker and Mukhopadhyay, 2014). 716
The model presented in Figure 9 can potentially explain why the early rock record of the 717
Earth seems to be dominated by a component characterized by elevated μ182W. However, only a 718
relatively small number of samples have been analyzed for both 142Nd and 182W, so conclusions 719
based on the current available data must be considered tentative. All of the models described 720
above would also imply that the major episodes of Earth formation and differentiation took more 721
than 50 Ma to complete. For the model presented in Figure 9, the mantle at 3.8 Ga preserves a 722
record of differentiation events that occurred both prior to 50 Ma after Solar System formation, 723
affecting both W and Nd isotope compositions, and after 50 Ma, affecting only Nd isotope 724
compositions. If multiple episodes of differentiation account for the lack of correlation between 725
182
W/184W and 142Nd/144Nd, then the Isua data show that these distinct reservoirs in the mantle 726
were preserved until at least 3.8 Ga. 727
728
Acknowledgments 729
730
We thank T. Mock for assistance with the TIMS. B. Mhammed carried out the major element 731
analyses. This article benefited from discussions with J. O’Neil and S. Shirey. We thank S. 732
Shirey who provided sample VE-32. We thank J. Boyd who provided some of the ultramafic 733
samples studied in this manuscript. We also thank the helpful comments and suggestions from 734
two anonymous reviewers. This work was supported by NSF-CSEDI grant EAR1265169 to R.J. 735 Walker. 736 737 Figure Captions 738 739