Assessment of an Expert System for Space Life Sciences:
a Preliminary Ground-Based Evaluation of PI-in-a-Box
for the Neurolab Sleep and Respiration Experiment
by
GIANLUCA CALLINI
Bachelor of Mechanical Engineering, Summa cum Laude The Catholic University of America, Washington, DC, 1997
Submitted to the Department of Aeronautics and Astronautics in partial fulfillment of the requirements for the degree of
MASTER OF SCIENCE at the
MASSACHUSETTS INSTITUTE OF TECHNOLOGY September 1998
© 1998 Massachusetts Institute of Technology, All rights Reserved.
Signature of Author: ..., e- a - s
/i. rtment f Aeronautics and Astronautics9, 1998
C ertified b y : ... .. ... ... .a uren .e ...o u n .
I 1 Laurence R. Young
Apollo Program Professor of Astronautics
I I , Thesis Supervisor
Accepted by: ... .... ... Professor Jaime Peraire
Associate Professor MASSACHUSETTS INSTITUTE Chairman, Department Graduate Office
OF TECHNOLOGY
SEP
221998
LIBRARIES
A
Assessment of an Expert System for Space Life Sciences:
a Preliminary Ground-Based Evaluation of PI-in-a-Box
for the Neurolab Sleep and Respiration Experiment
by
GIANLUCA CALLINI
Submitted to the Department of Aeronautics and Astronautics on August 7, 1998 in Partial Fulfillment of the Requirements
for the Degree of Master of Science in Aeronautics and Astronautics ABSTRACT
Principal Investigator-in-a-Box (abbreviated [PI]) is an expert system designed to assist astronauts with the performance of an experiment outside their field of expertise when contact with the Principal Investigators on the ground is not allowed or impossible. The latest version of [PI] was designed to assist with the calibration and troubleshooting procedures of the Neurolab Sleep and Respiration Experiment, launched on the Space Shuttle Columbia on April 17, 1998. The role of [PI] in this application is to display physiological signals in real time during the pre-sleep instrumentation period, and to alert the astronauts when a poor signal quality (due to incorrect application of the instrumentation or a hardware malfunction) is detected.
As the first expert system ever designed to be an integral part of a Space Life Sciences experiment, a formal and structured evaluation of the efficacy of such a system is unprecedented. The study presented in this thesis is a preliminary assessment of the efficacy of [PI] with the "poor signal quality detection" process. The twelve subjects used for this study were required to monitor a set of pre-recorded physiological signals and identify signal artifacts displayed on the screen. Every subject performed the experiment twice, once with the assistance of [PI] and once without, in a balanced design. Results indicated a positive effect of [PI] on overall time to detect anomalies. The combination of previous exposure to signal monitoring (training) and [PI] assistance was a significant factor in the improvement of overall reaction time. Also, the assistance of the expert system dramatically reduced the number of undetected anomalies.
Having been designed for a life sciences experiment, the evaluation of [PI] was modeled after that of ground-based medical information systems. As for most medical expert systems, evaluation is an iterative process, and this study represents the first step, providing many insights and recommendations for more in-depth studies in the future, as well as exploring possible ramifications and expansions of the uses of expert systems in
space.
Thesis Supervisor: Laurence R. Young
Acknowledgments
Who said that writing the acknowledgments to a thesis was going to be easy? This page (or two) went through more rewrites than I care to admit... I keep thinking that in 1992 I was just a clueless high school boy who didn't even speak English, and almost six year later I am writing the acknowledgments to my Master's thesis, shortly after returning from the Johnson Space Center for the Neurolab Mission. I've come a long way, and I know I could not have done this alone...not without all those people who made me laugh and cry, who made me happy and sad...not without those people who made me feel alive. Professor Young...where do I start? Thank you so much for giving me the opportunity to work on a project thatflew, and will fly again, in space. This is major bragging material. I still can't forget meeting you on the gym floor during Orientation as I was shamelessly stuffing myself with a chicken sandwich while you were asking me what my plans for the future were: I hope the first impression didn't count! I am proud to have been able to write my own chapter of the [PI] saga.
Dennis, you deserve most of the credit: after all if it weren't for you there would be no [PI] for me to work with! Thanks for babysitting me in Houston. I'm hungry, can we go get something to eat? Big thanks to the whole Sleep Team who made the SMA seem anything but boring. Eymard, you need some sleep (no pun intended). Karen, sorry I didn't see you in Texas, but running the pilot study with you was fun...thanks for teaching me how to play "Hydrodot" on Derk-Jan's ceiling! Are they still up there? Susanne, my Suzer, they would have locked me up and thrown away the key if it hadn't been for you. Thanks for being my reality check and for listening to my incessant whining: this thesis is as mine as it is yours. I had fun making you laugh...but were you laughing WITH me or AT me? Just wondering...No, I will NOT change my name, and YES the laptop is MINE...Sort of...See you in orbit! Big thanks to Kevin Seefried for keeping the Suzer sane and for being such a Visual Basic guru (I'd still be sorting out data if it weren't for that routine).
Thanks to the MVL for making this past year really interesting: T-Rex, Natasha (for the tea and cookies), Patricia, Jen, Bill, Adam, Dawn, Christine, Avishai, Emerson and Andy. Marsha, as promised, here's my BIG thanks to you. Thanks for making all the proposals readable. We're a great team!!!. Yes, yes I still need to take you out to dinner, I know. Big thanks to Dava Newman who had the (mis)fortune of meeting me way back when I was still a junior and who never got rid of me after that...after your talk, I just HAD to come to MIT!
I would also like to thank my professors from Catholic University for helping me since the beginning, and for bending over backwards to help me graduate on time: Dr. Casarella, Dr. Gilheany, Dr. Baz, I'll never thank you enough. Dr. Nieh, I'll never know what you wrote on the letter of recommendation, but it must have been good: thanks! Dr. Crassidis, you are still the controls god as far as I am concerned. Corrie Lathan...gee how do I start...thanks for getting me here in the first place!! Next time you're in Rome
I'll make sure no one picks your pocket (hanging out with a native is a whole different experience).
Tom, thanks for all the good memories from senior year...in the meantime, I'll be waiting for you to embrace the arcane world of email...actually even that obscure device called telephone would work, you know...
Kevin, thanks for making this summer in Boston absolutely awesome: after all, I needed someone to discuss the X-Files and Ally McBeall with. Thanks for trying to teach me that pressure is good and stress is bad: I think it sort of worked. I can't wait to read your book! Best of luck in Ohio and wherever else life will take you.
Chiara! Was this fast enough? 2 years in 1, 4 years in 3, 5 years in 4 etc. we're setting too many precedents here. What's next? I can't wait to read a newspaper with your name on it...and no, I know you won't end up in a hair salon, please...Are we still on for that date on the moon? Good luck in London!
Caroline and Thelma, your prayers helped. We'll go see a Spice Girls concert someday (before they all split up). Ollie, thanks for thinking (at one point) that I, an EYEtalian, was the cutest :) (ego boost!!). Thanks for the many chats and, let's not forget, the Tasty Kakes!!! Just move up to Boston and we'll have fun. Thanks to Rena, Alessandra, Anna, Nancy, Meredith and Georges for not letting distance be an issue in keeping our friendships alive. Thank God for email!!
Nancy and Traci, Joe and Judy, Piero and Mariella, Dr. and Mrs. Gregory, Mr. and Mrs. Piskadlo: thanks for being my homes away from home. Thanks for the hospitality, the warmth, and the home cooked meals! Just knowing you were there made a lot of
difference.
Thanks (bold, italic, and underlined) to Tilly and Luciano, a.k.a. "mom and dad" (or mamma e papa '). Thanks for the support and for believeing I could do this. Thanks for
letting me go. Thanks for being proud...thanks for...well thanks for being my parents (no easy task). I could not have been more fortunate. Thanks to my aunt Laura and uncle Marcello for their support: you are the best! Thanks to my grandmother "nonna Chicca" for her love and encouragement, and thanks to Dr. Adelfio Caruso, the greatest man, artist, engineer and grandfather I have ever met...I hope you can see this: Nonno Feffio, this is for you.
This research was funded by the NSBRI PI-in-a-Box grant and NASA Ames Research Center, grant number NCC 2-570.
Table of Contents
Abstract ... 3 Acknowledgments ... 5 Table of Contents ... 7 List of Figures ... 10 List of Tables ... 11 Chapter 1: Introduction ... 15 1.1 Expert Systems ... ... 15 1.2 Objective ... ... 17 1.3 Methods ... 17 Chapter 2: Background ... ... 192.1 Categorization of Expert Systems ... 19
2.2 Principal Investigator-in-a-Box ... ... 19
2.3 Current Version of [PI] ... ... 20
Chapter 3: Experimental Hardware and Software Overview ... 23
3.1 Overview of the Neurolab Sleep Experiment ... 23
3.1.1 Motivation for the Sleep Experiment ... 23
3.1.2 The E-Net ... 25
3.1.3 The RIP Suit ... ... 26
3.1.4 The Digital Sleep Recorder ... 27
3.2 Experimental Hardware ... 27
3.3 Software: [PI] ... ... 28
Chapter 4: Signal Overview and [PI] Logic ... 33
4.1 Signals Displayed by [PI] ... ... 33
4.2 Normal Signals ... .. 34 4.2.1 Electroencephalogram (EEG) ... 34 4.2.2 Electro-oculogram (EOG) ... 35 4.2.3 Electromyogram (EMG) ... . 37 4.2.4 Electrocardiogram (EKG) ... 38 4.3 Signal Artifacts ... ... 38 4.3.1 Classes of Anomalies ... 38 4.3.2 Popping ... ... 38 4.3.3 Noise ... 39 4.3.4 Flat Signal ... ... 40
Chapter 5: Experiment ... ... 45
5.1 O verview ... 45
5.2 Subjects ... 46
5.3 Training and Experimental Protocol ... 46
5.3.1 Training ... 46
5.3.2 Experimental Protocol ... ... 47
5.4 D ata File ... 48
Chapter 6: Data Collection and Analysis ... 51
6.1 O verview ... 51
6.2 Raw Data Acquisition ... 51
6.3 Data Format and Manipulation ... ... 52
6.3.1 Data Extraction ... ... 52
6.3.2 Data Manipulation and Analysis ... 53
Chapter 7: Results and Discussion ... ... 55
7.1 Analyzed Effects ... 55
7.2 Reaction Times ... 55
7.3 Subject Effects ... ... 61
7.4 Undetected Anomalies ... ... 64
7.5 Signal Artifact Identifications ... 65
7.6 Gender Effects ... ... 66
7.7 Discussion ... 67
Chapter 8: Conclusions and Recommendations ... 71
8.1 Summary ... ... 71
8.2 Iteration and Future Steps ... 71
8.3 Recommendations for Future Studies ... 72
8.4 The Future of [PI] ... 73
8.5 The Future of Expert Systems and Space Life Sciences ... 74
8.6 L iftoff ... 75
Chapter 9: References ... 77
Appendix A: Neurolab Sleep Experiment Instrumentation and Calibration Procedures ... .. 79
Appendix B: Malfunction Procedures ... 82
Appendix C: [PI] Rules ... 112
Appendix E: Consent Form and Subject Questionnaire ... 142 Appendix F: Sample Quiz and Reference Manual ... 146 Appendix G: Data File List of Events and Subject
Raw Data Response Files ... 159 Appendix H: Data ... 227 Appendix I: Database Documentation
List of Figures
Chapter 1: Introduction ... 15
Figure 1.1: The Evaluation Process of a System and [PI] Status ... 18
Chapter 3: Experimental Hardware and Software Overview ... 23
Figure 3.1: Pre-Sleep Hardware Configuration ... 25
Figure 3.2: E-Net Diagram ... ... 26
Figure 3.3: Digital Sleep Recorder ... 27
Figure 3.4: [PI] Graphic User Interface: CR and EP Displays ... 30
Chapter 4: Signal Overview and [PI] Logic ... 33
Figure 4.1: Typical Good Quality EEG signal ... 34
Figure 4.2: Typical Good Quality Left/Right EOG Signals ... 36
Figure 4.3: Typical Good Quality Up/Down EOG Signals ... 37
Figure 4.4: Typical Good Quality EMG Signal ... 37
Figure 4.5: Popping Anomaly on an EEG Signal ... 39
Figure 4.6: Noisy EOG Signal Compared to a Clean EOG Signal ... 40
Figure 4.7: Flat EM G Signal ... 40
Chapter 7: Results and Discussion ... 55
Figure 7.1 (a) and (b): Subject Overall Average Reaction Times for Groups A & B ... 56
Figure 7.2 (a) and (b): Average Reaction Times for Popping Anomalies .. 58
Figure 7.3 (a) and (b): Average Reaction Times for Noise Anomalies ... 59
Figure 7.4 (a) and (b): Average Reaction Times for Flat Anomalies ... 60
Figure 7.5: Subject Variance for Overall Reaction Time ... 61
Figure 7.6: Subject 3 Reaction Times per Day ... 62
Figure 7.7: Subject 7 Reaction Times per Day ... 63
Figure 7.8 (a) and (b): Number of Undetected Anomalies for Groups A & B ... 64
List of Tables
Chapter 4: Signal Overview and [PI] Logic ... 33
Table 4.1: Signals Displayed by [PI] ... 33
Table 4.2: Signal Reception Breakdown and Measurement Ranges ... 41
Table 4.3: Criteria used by [PI] for Signal Presence ... 42
Table 4.4: [PI] Signal Quality Rules ... . 43
Chapter 5: Experiment ... ... 45
Table 5.1: Experimental Test Matrix ... 47
Chapter 7: Results and Discussion ... 55
Table 7.1: Main and Cross Effects on Average Reaction Time ... 57
Table 7.2: Effects on Average Reaction Time for Popping Anomalies .... 58
Table 7.3: Effects on Average Reaction Time for Noise Anomalies ... 60
Table 7.4: Effects on Average Reaction Time for Flat Anomalies ... 60
Table 7.5: Effects on the Number of Undetected Anomalies ... 65
Table 7.6: Effects on the Number of Wrong Anomaly Identifications ... 65
A l 'altafantasia qui manco' possa; Ma gia' volgeva il mio disio e '1 velle, Si come rota ch 'igualmente e' mossa L 'amor che move il sole e l'altre stelle.
(Here power failed the lofty fantasy;
but already my desire and my will were revolved, like a wheel that is evenly moved,
by the Love which moves the sun and the other stars).
Chapter 1
Introduction
1.1 Expert Systems
Expert Systems are computer programs derived from a branch of computer science research called Artificial Intelligence (AI)'. These programs are designed to help solving problems in various areas by providing the user with a body of knowledge necessary to accomplish a specific task. For the past two decades, expert systems have been implemented in various fields such as medicine, finance, banking, telecommunication, air traffic control and even government applications.
The applications of expert systems are quite diverse making it almost impossible to classify them. However, they tend to cluster in seven major classes:2
1. Diagnosis and Troubleshooting of Devices and Systems of all kinds; 2. Planning and Scheduling;
3. Configuration of Manufactured Objects from Subassemblies; 4. Financial Decision Making;
5. Knowledge Publishing;
6. Process Monitoring and Control (real time); 7. Design and Manufacturing.
Expert systems can also be designed to encompass more than one of these areas at once. Real-time expert systems are of special interest since they analyze real-time data
1 Engelmore and Feigenbaum
from a system with the intent of noticing anomalies and reporting them to the user, as well as predicting trends and controlling for optimality and failure correction3.
Artificial intelligence programs such as these have the potential to serve as powerful tools when performing experiments in space. During the course of a single mission, astronauts usually conduct several experiments outside their field of expertise while the Principal Investigators are on the ground. Errors in the experimental procedure can cause poor data collection or even complete data loss, possibly resulting in loss of money and effort.
Many other factors influence astronaut performance, such as fatigue, delay between training and the actual performance of the experiment, and possible stress accumulated during long-duration space flights. Inhibition on the use of air-to-ground communication except for the case of an unforeseen failure in the setup of an experiment is another element, since the astronauts are instructed not to contact the Mission Control Center unless absolutely necessary. In light of the increasing number of long-duration space flights, such as on the International Space Station, these problems are bound to increase. For this reason, expert systems might help reduce the likelihood of making errors by aiding the astronauts when the Principal Investigator on the ground cannot be contacted.
Although real-time expert systems have been successfully used in space before, a systematic study to quantitatively assess their efficacy in aiding a user with the performance of an experiment has never been conducted. The focus of this study is to assess the efficacy of this technique using the latest real-time expert system developed for the STS-90 Neurolab Space Shuttle mission, called Principal Investigator-in-a-Box
(abbreviated PI-in-a-Box or [PI]), which aided the astronauts with the troubleshooting and calibration procedures of one of the Neurolab Experiments.
1.2 Objective
Using [PI] for the Neurolab Sleep Experiment, this study will attempt to quantify the efficacy of an expert system in assisting with the troubleshooting and calibration of an apparatus by conducting an experiment with "astronaut surrogates." While a more detailed ground-based study will be conducted in the upcoming months, the results presented here will provide valuable information on the use of the expert system and the adequate training required, as well as recommendations for future studies, versions and uses of [PI] on other Space Shuttle and Space Station missions.
1.3 Methods
Expert systems, even if mostly not real-time, are fairly popular in the medical field. [PI] was developed to aid astronauts with a life sciences experiment, making medical diagnostics its task domain ("task" being the expert system's problem solving activity and "domain" the area within which the task is performed)4. There is extensive literature available on the evaluation of medical expert systems and AI applications, and while the evaluation of a real-time medical expert system in this manner is unprecedented, most of the same methods apply.
Evaluation of a clinical/medical system, like any system, takes place over several iterative steps during the development cycle. In fact, the evaluation continues even after
the system has been disseminated. The current status of [PI] and the role of this study within the development process are indicated in the diagram below.
Figure 1.1: The Evaluation Process of a System and [PI] Status5
Chapter 2
Background
2.1 Categorization of Expert Systems
Expert systems fall into that category of human-computer interaction called "supervisory control" which, in a broad sense, is defined as the continuous exchange of information between one or more users and a computer which interconnects to the process task or the environment through various artificial means (sensor, effectors etc.)'. In order to achieve the goal they have been designed for, expert systems employ knowledge of techniques, information, heuristics (rules of thumb), and problem solving processes that human experts use to solve such problems2.
Most expert systems mimic this level of human behavior (defined as rule-based) to recognize patterns and activate their algorithms to execute the appropriate response3 .
The most popular method employed to encode such algorithms is by expressing the knowledge with a series of "if-then" rules: when the data being fed to the software matches the "if' part of a statement, the corresponding action (contained in the "then" part of the statement) is activated.
2.2 Principal Investigator-in-a-Box
The concept for Principal Investigator-in-a-Box was created by Professor Laurence Young in 1987 in collaboration with NASA Ames Research Center. Since
1 Sheridan
having every Principal Investigator fly into space with his or her experiment would be highly impractical, the goal was to create a system containing the knowledge of a Principal Investigator and allow it to accompany the experiment in space4. The first
version of [PI], formally known as the Astronaut Science Advisor (ASA), was used to assist the astronauts in the performance of the "Rotating Dome" visual-vestibular interaction experiment on the SLS-2 mission in 1993. This first version of [PI] provided data collection capabilities, as well as protocol assistance, scheduling, and protocol modifications suggestions. An additional feature consisted of an "interesting data" filter, designed to perform quick-look data analysis and report any data anomalies. The experiment was successful, and the system proved to be robust and helped the astronauts in maintaining good data quality; its troubleshooting capabilities, however, were not used, due to lack of astronaut training and, consequently, confidence in the system .
2.3 Current Version of [PI]
Due to the successful implementation of the ASA with the Rotating Dome experiment, MIT and NASA Ames research center collaborated on the development of a new version of [PI] in conjunction with Dr. Czeisler's "Sleep, Respiration and Melatonin in Microgravity" experiment which was launched on the Neurolab mission in April 1998. Differently from the ASA, however, this new version of [PI] was designed as an integral and vital part of the experiment. The flight version of this latest incarnation of [PI] was submitted to the Johnson Space Center at the beginning of 1998. [PI] has been designed to assist the astronauts with the calibration and troubleshooting of the instrumentation 3 Rasmussen
during the pre-sleep period of the experiment; its role is to display the physiological signals during the instrumentation calibration, identify anomalous signals and suggest corrective procedures when necessary6. [PI] is invaluable during this section of this experiment, since during the pre-sleep and instrumentation period, contact with the Principal Investigators on the ground does not normally occur. While most of the coding of [PI] was done at NASA Ames, the malfunction procedures were developed at MIT using a fault tree approach7.
The Sleep experiment will be repeated on the STS-95 mission to study the effects of space flight on sleep and aging, using Senator John Glenn as one of the subjects. The mission is scheduled to fly in October 1998. For this mission, [PI] will be updated and improved, also based on observations made from the results of this study.
5 Young 6 Smith 7 Ibid
Chapter 3
Experimental Hardware and Software Overview
3.1 Overview of the Neurolab Sleep Experiment
3.1.1 Motivation for the Sleep Experiment
The experiment performed for this thesis was conceived to evaluate [PI] objectively, and is not to be confused with the Sleep Experiment, even though the expert system was in fact developed for it. Due to the nature of this version of [PI], The study presented here is based on an experiment that contains elements of the Sleep Experiment, but it does not actually replicate it or replace it. The Neurolab Sleep Experiment was created to investigate the factors contributing to sleep disorders on long-duration space flights. During missions in space, the quality of astronauts' sleep is poor' due to several reasons.
A very important factor is the absence of gravity. On Earth, humans constantly use their muscles to fight the force of gravity exerted on the human body. Even the simple act of standing up requires the muscles to work against gravity. In space the force of gravity is absent, therefore the astronaut do not have to exert their muscles to support their weight. As a result, muscle exertion in space is considerably less than on Earth, which may result in poor sleep quality.
Another factor is the irregularity of a "day" in space. As the space shuttle orbits the Earth, the orbit's period is of about 90 minutes. Therefore, since the sun rises and sets approximately every hour and a half, it is impossible for the astronauts to rely on the sun to determine when it is time to sleep. The crew operates on Houston time (CDT) and the
sleep schedule is shifted by a couple of hours every night due to a gradual time shift2
. This and the crew roster affect the normal sleep schedules and circadian rhythms of the astronauts, resulting in poor sleep quality.
The sleep experiment was designed as a collaborative effort between Brigham and Women's Hospital (Harvard Medical School) and The University of California, San Diego. By administering melatonin or a placebo to the subjects, Dr. Charles Czeisler of BWH, the Principal Investigator, will attempt to study and regulate the sleeping patterns and therefore improve cognitive performance of the astronauts. Dr. John West of UCSD, the other Principal Investigator, will be studying the effects of zero-g on the cardiorespiratory system as a possible cause for poor sleep quality.
The sleep experiment was performed on eight days divided into two four-day sessions. The first session was performed from flight day 3 to 6 and the second from flight dayl2 to 15. Subjects were paired in groups of two, and only two subjects performed the experiment at any given time. A data downlink was performed every morning following a sleep session to allow the Principal Investigators on the ground to examine the data collected.
The experiment designed for the study discussed in this thesis simulates in part the Neurolab Sleep experiment, but does not require most of the instrumentation that was used during the mission. In order to understand [PI]'s role and the experiment in general, however, a brief description of the Sleep Experiment hardware is provided.
Santy et al.
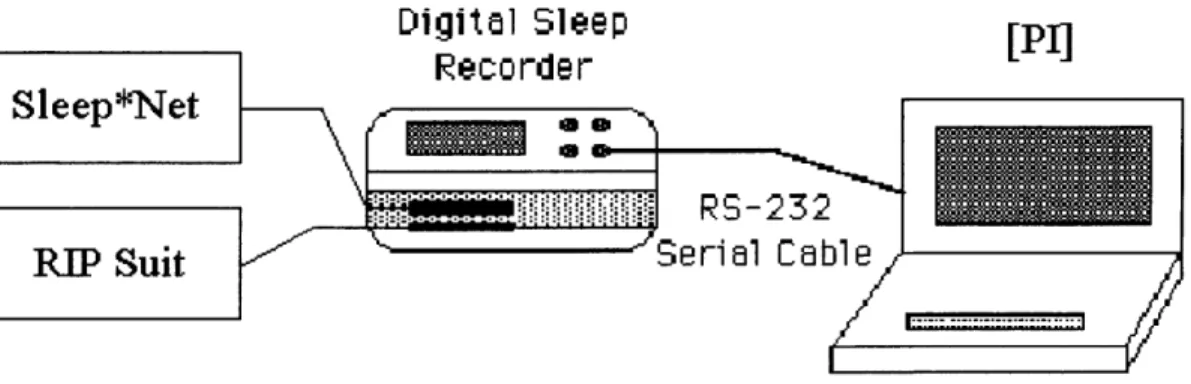
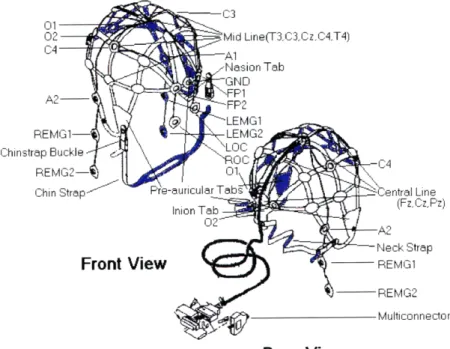
The experimental setup consists of the sleep and respiration hardware, a digital sleep recorder and a laptop computer on which [PI] was installed. A diagram of the hardware configuration (during the pre-sleep calibration mode) is shown in Figure 3.1.
Digital Sleep [:)
Recorder
Sleep*Net
iiaiiiiiii
RS- 32
RIP Suit
Seri al Cable
Figure 3.1: Pre-Sleep Hardware Configuration
3.1.2 The E-Net
The Hydrodot NeuroMonitoring System, referred to as E-Net, was worn by the subjects during the sleep sessions to record their EEG, EMG and EOG signals. The E-Net is a web-like elastic cap with 13 housings for disposable biosensors (hydrodots), and a cable with a 50-pin multiconnector which allows it to be connected to the digital sleep recorder. The E-net allows the subjects to place the hydrodots in approximately the same sites, minimizing the possibility of errors in recording due to electrode misplacement. The hydrodots are small sensors filled with a sticky, water-soluble gel which adheres to the skin and provides better contact than regular electrodes. While the E-net may feel uncomfortable, this problem was not present in space (or was at least reduced) since the astronauts' head was not resting on any surface during sleep.
Rear View
Figure 3.2: E-Net Diagram3
3.1.3 The RIP Suit
In order to measure the cardiorespiratory sleeping patterns, the astronauts wore a "Respiratory Inductance Plethysmography" (RIP) suit to measure the extension and relaxation of the rib cage and abdomen. The RIP suit is basically a lycra body-suit with two coils embedded at the chest and abdomen levels of the subject's body. The cardiorespiratory apparatus also consists of a nasal thermistor, a microphone to measure snoring, EKG leads to measure heart rate, and a pulse oximeter on the finger to measure the oxygen level in the blood. The wiring for all these components is grouped into a large cable called the "Borg Harness" which also has a 50-pin multiconnector to interface with the digital sleep recorder.
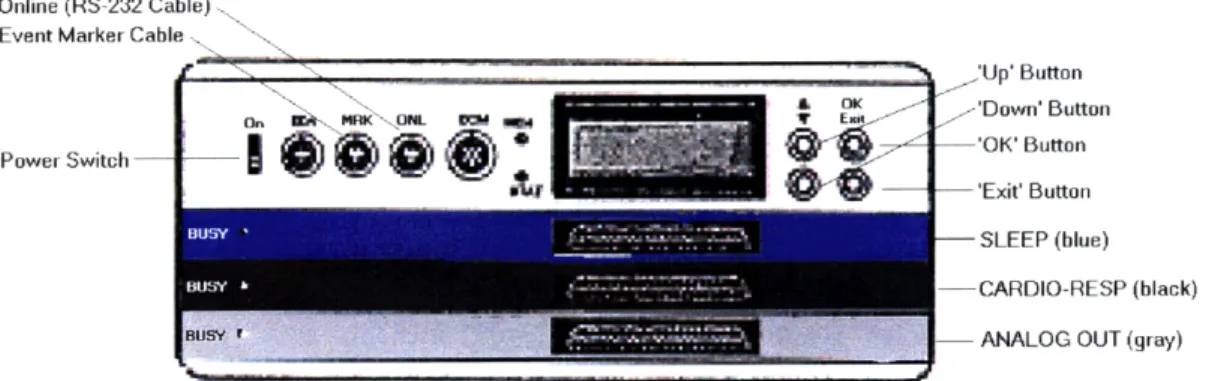
3.1.4 The Digital Sleep Recorder
The signals coming from the E-Net and the RIP suit are recorded by a unit called the digital sleep recorder (DSR). The DSR selected for this experiment was the Vitaport2 recording system, shown on Figure 3.3.
Online (RS-232 Cable) Event Marker Cable
*f 'Up' Button
SO OK 'Down' Button
Power Switch 'OK'Button
w-
'Exit' Button SLEEP (blue) CARDIO-RESP (black)
BUSY- ANALOG OUT (gray)
Figure 3.3: Digital Sleep Recorder4
The DSR interfaces with the E-Net and RIP suit through the 50-pin multiconnectors. The unit operates with four AA batteries and records the signal on an 85 MB FlashRAM PCMCIA data card. The data from the card can be downloaded the morning following the sleep session.
3.2 Experimental Hardware
Even though [PI] was developed on a Pentium-based laptop computer, the flight hardware consists of an IBM ThinkPad 755C with a 486 75 MHz processor and 20 MB of RAM. The 486 processor is the latest chip that has been certified and approved by
Diagram Provided by Eymard Riel, Center for Circadian Medicine, Brigham and Women's Hospital, Boston, MA
NASA for space flight: no Pentium computers have flown on the Space Shuttle to this date. Throughout the development of [PI], it was always kept in mind that the final product would be running on a computer equipped with a slower processor than the one it was developed on. The ThinkPad is connected to the DSR using an optical RS-232 cable during the pre-sleep calibration period. The DSR sends sleep and respiration signals to the laptop through the serial port. [PI] displays the signals and analyzes the data. At this stage of the experiment, the astronauts are required to go through a series of calibration procedures to insure that the instrumentation was properly applied (see Appendix A).
The experiment performed for the study presented in this thesis only required a laptop computer and [PI] playing a set of pre-recorded sleep signals. For the study, faster computers were used than the flight ones, but this change in computer configuration did not affect [PI]'s performance at all. The experimental hardware consisted of six IBM ThinkPad laptops 385CD equipped with a Pentium 150 MHz with MMX processor, and 32 MB of RAM.
3.3 Software: [PI]
The code for [PI] was written in C++ and the reasoning engine was coded using the "C Language Integrated Production System" (CLIPS)5 expert system language. The version of [PI] used for the study, version 3.00, is the same version used for the Neurolab
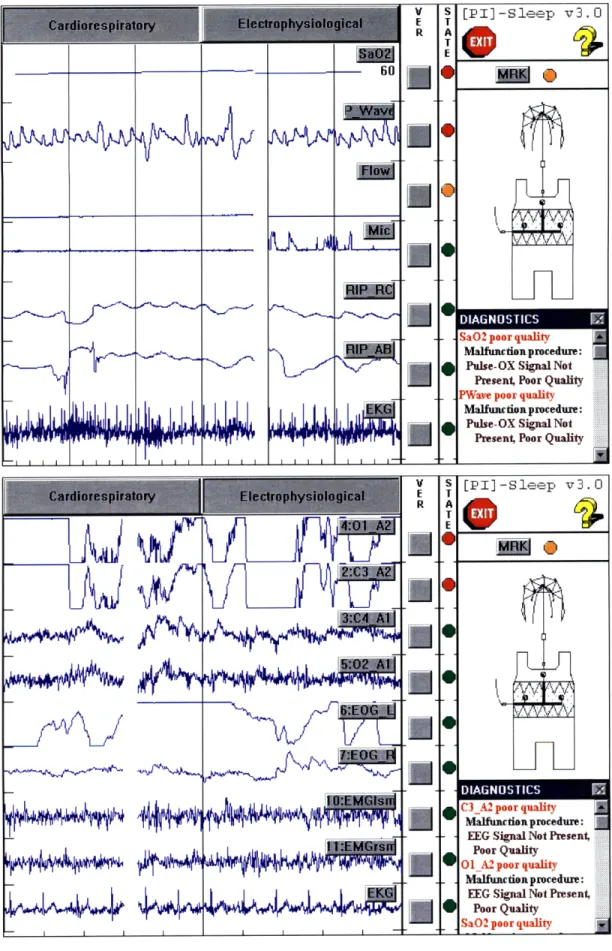
Sleep Experiment. The graphic user interface consists of two separate screens. One displays the cardiorespiratory (CR) signals, and the other the electrophysiological (EP)
4 Diagram Provided by Eymard Riel, Center for Circadian Medicine, Brigham and Women's Hospital,
Boston, MA
Copyright 1989, Artificial Intelligence Section of the Mission Planning and Analysis Division,
signals. Both screens display the incoming signals (from the DSR) in real time, and it is possible to toggle between the two screens by clicking on the "buttons" at the top of the screen. The cardiorespiratory and electrophysiological screens are shown on Figure 3.4.
Figure 3.4: I[PI Graphic User Interface: CR and EP Displays6 6 Bitmap images provided by Dennis M. Heher, Caelum Research Corporation, Moffett Field, CA
Each vertical line represents five seconds of data. As shown in the previous pictures, a LED next to each signal indicates its quality: green for good quality, red for poor quality and amber for unknown or marginal quality. In case of a bad quality signal, [PI] will flash a red light next to the appropriate trace and a message will appear in the diagnostic box on the lower right-hand corner instructing the user to follow the malfunction procedure displayed. The diagnostic box can also be set to simply alert the user of a malfunction and to refer him or her to a malfunction procedure manual supplied with the Neurolab equipment (see Appendix B). In order to play back the data acquired during the pre-sleep section of the Sleep Experiment, [PI] was equipped with the capability to replay pre-recorded data files. This feature was used for the study. When the "response" feature is on, clicking on one of the checkboxes next to the various signals will also record the clock and data file time of the mouse click and will open a pop-up message box where text can be entered or some options can be chosen (as will be explained later). [PI] can record these mouse-click times (response times), as well as the onset of bad quality signals, in a text file. Another important feature of [PI] version 3.00 is the selective reasoning option, which allows the user to decide which signals [PI] is going to display warning lights and diagnostic messages for.
Chapter 4
Signal Overview and [PI] Logic
4.1 Signals Displayed by [PI]
During the sleep experiment, nine different kinds of signals are recorded and displayed by [PI] on the two windows presented in the previous chapter. The cardiorespiratory signals (for UCSD's respiration experiment) include rib cage and abdomen extension, airflow, microphone, level of SaO2 in the blood and
electrocardiogram (EKG). The electrophysiological signals displayed are the electroencephalogram (EEG), electro-oculogram (EOG) and electromyogram (EMG). Multiple traces are displayed for some of these signals, and the EKG is displayed in both the CR and EP windows. The total number of traces displayed by [PI] in each window is reported in the table below:
Table 4.1: Signals Displayed by [PI] Electrophysiological Cardiorespiratory
Window Window
EEG (4 traces) SaO2
EOG (2 traces) Airflow
EMG (2 traces) PWave
EKG EKG
RIP - abdomen RIP - rib cage
The experiment run for this study only involved the monitoring of the signals displayed on the electrophysiological window, therefore a brief overview of these signals will be provided.
4.2 Normal Signals
4.2.1 Electroencephalogram (EEG)
The electroencephalogram is the underlying brain wave and it is the most important signal in the evaluation of sleep data. In sleep studies, at least a central and an occipital EEG are recorded. However two of each are recorded in the Sleep Experiment for redundancy'. When the subject is awake with eyes open, the EEG looks like a wide-band, low amplitude (10-200 tV) signal. When the subject's eyes are closed, a higher frequency signal (in the 8-12 Hz range) appears, known as alpha wave. A greater amount of alpha activity is therefore observed during sleep. Figure 4.1 shows a typical good quality EEG signal, including the characteristic alpha activity.
Figure 4.1: Typical Good Quality EEG signal
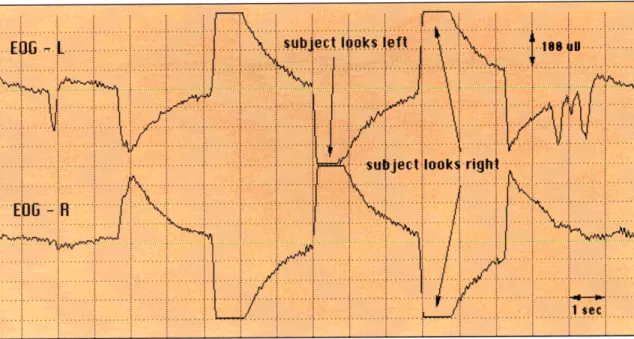
4.2.2 Electro-oculogram (EOG)
The electro-oculogram consists of two distinct traces, one per eye. The EOG signals are extremely important for the determination of REM sleep, since any kind of eye movement is highly distinguishable on the EOG signals due to their shape.
The EOG signals make use of the potential difference that exists across each eyeball: the cornea (located in the front of the eye) is in fact positively charged with respect to the retina (located in the back of the eye).
Each EOG electrode is referenced to the electrode located behind the opposite ear. Because of this, any eye movement across the horizontal plane produces a negative voltage in one eye and a positive voltage in the other; the deflection that these movements produce on the EOG signals are approximately equal in magnitude but opposite in polarity2: an eye movement to the right results in a negative (upward) deviation of the left EOG signal and a positive (downward) deviation of the right EOG signal. The exact opposite situation occurs for an eye movement to the left. Depending on the magnitude of the eye movement, EOG deflections can present an amplitude range from 20 to 500 gV. Visual examples of these eye movements are shown on Figure 4.2.
Figure 4.2: Typical Good Quality Left/Right EOG Signals
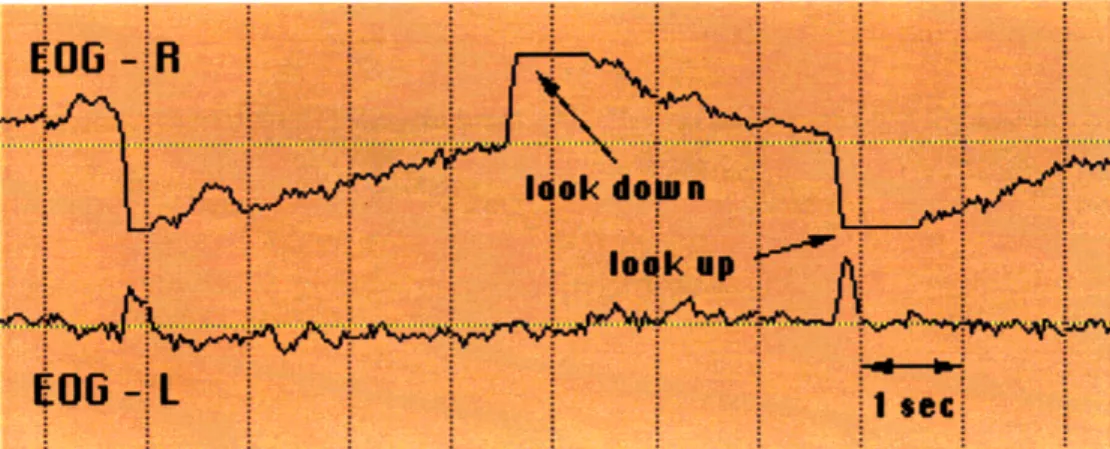
Because of the electrode placement (right EOG above the eye and left EOG below), and the polarity in each eyeball, up and down eye movements also produce deflections in the EOG signals that are similar to left and right eye movement patterns, but smaller in magnitude. An upward eye movement creates a negative (upward) deflection of the left EOG trace and a positive (downward) deflection on the right EOG signal. The reverse happens for downward eye movements. It is interesting to note that the magnitude of up/down movements on the right eye is generally more noticeable than the left eye because of the electrode placement: the right EOG electrode, placed above the right eye, also picks up movements of the upper lid. Examples of upward and downward eye movements are shown on Figure 4.3.
Figure 4.3: Typical Good Quality Up/Down EOG Signals
4.2.3 Electromyogram (EMG)
The last electrophysiological signal recorded with the E-Net is the electromyogram, which indicates muscle activity under the chin. The EMG also helps distinguish REM state, since one of the characteristics of REM sleep is also the loss of muscle tone3. Generally, the EMG looks like a noisy, high frequency signal which dramatically increases in frequency and amplitude in case of a muscle contraction (clenched jaw). The amplitude can vary generally within a range from 20 to 300 gV. An example of a typical EMG signal is show in Figure 4.4.
Figure 4.4: Typical Good Quality EMG Signal
4.2.4 Electrocardiogram (EKG)
Even though the EKG is recorded using the cardiorespiratory instrumentation, it is displayed on the electrophysiological window, and was therefore used with the other EP signals for the study. The EKG is characterized by a rhythmic wave pattern (referred to as QRS).
4.3 Signal Artifacts 4.3.1 Classes of Anomalies
Due to several possible faults in the instrumentation setup or hardware, signal deterioration can occur. On the [PI] display, the signal artifacts are shown on the screen, and the corresponding red light accompanied by a diagnostic message calls the operator' s attention to that particular signal. While the causes for a signal artifact can be attributed to many different sources, their visual appearance was grouped in three major categories. This categorization was also used in the experiment. The three classes of possible signal anomalies are presented in the following sections.
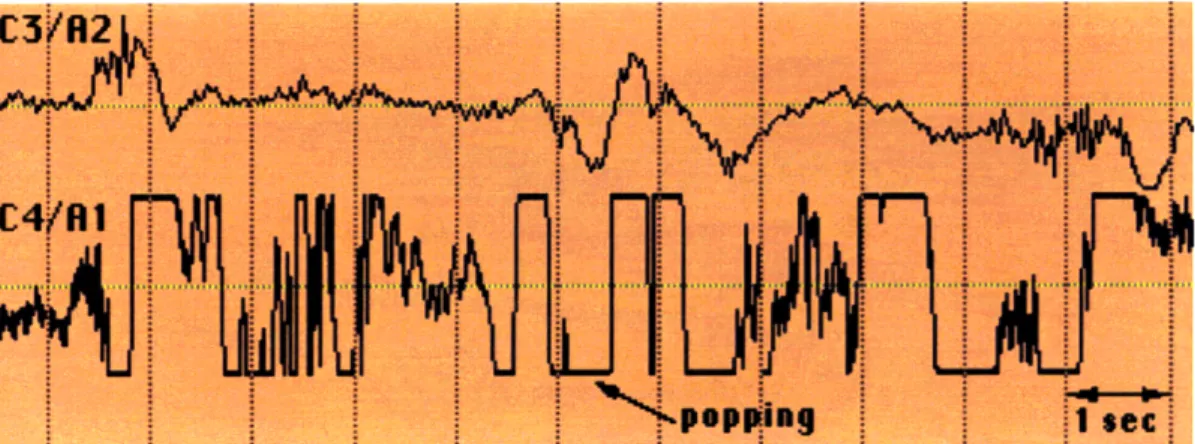
4.3.2 Popping
"Popping" is a term used to refer to the signal anomaly created by the poor or intermittent contact between an electrode and the scalp. Popping is probably the most distinctive and easiest anomaly to recognize. Since it is created by the poor application of an electrode, popping can appear in any of the electrophysiological signals. An example of popping (on an EEG signal) is shown in Figure 4.5.
Figure 4.5: Popping Anomaly on an EEG Signal
4.3.3 Noise
Another common type of anomaly is noise introduced into a signal. Noise is usually manifested as a random, high frequency (around 60 Hz) pattern, and it can be introduced in a variety of ways. The most common cause is probably the incorrect placement of an electrode; other causes, such as sudden or excessive head movements, can also create a noisy signal. Insufficient scrubbing of a site, therefore resulting in high impedance, can also create noise. Figure 4.6 shows a noisy EOG signal compared to a good quality signal. Because of the inherently "noisy" appearance of the electrophysiological signals, noise is sometimes hard to detect, especially in the EMG.
Figure 4.6: Noisy EOG Signal Compared to a Clean EOG Signal
4.3.4 Flat Signal
The third major category of signal anomalies is a flat signal. As can be expected, a flat signal is displayed when an electrode is completely detached from the skin. Flat signals are probably the easiest type of anomalies to detect, but can sometimes be confused with simple saturation. Figure 4.7 shows a typical flat signal in an EMG.
4.4 [PI] Logic for Signal Presence and Quality
During the pre-sleep calibration period, as it records the signals coming from the instrumentation, the DSR also sends them to the ThinkPad through the RS-232 optically isolated serial cable. The signals are received by [PI] and bytes and must be converted in meaningful and analyzable units such as gV. The data is then stored in a 4-second buffer, and the buffer is analyzed every second. [PI] performs several kinds of statistical analyses (average and standard deviations, mean and variance). For the EKG and PWave, the beats per second (bps) are also measured. [PI] and the DSR communicate at 19200 baud, even though the DSR is set at 9600 baud by default. The DSR sends 32 bytes of data at 40.0 Hz to the ThinkPad. The data breakdown and the converted measurement ranges are shown in the table below.
Table 4.2: Signal Reception Breakdown and Measurement Ranges4 SIGNAL Amount of Data Converted Units Range
(bytes)
EEG (C3, 01, C4, 02) 8 gV + 200.0
EOG (left, right) 4 gV + 400.0
EMG (left, right) 4 gV + 100.0
EKG 2 mV ± 2.0
SaO2 2 % 0.0 to 100.0
PWave 2 % + 100.0
RIP (abdominal, rib cage) 4 % + 100.0
Airflow 2 % + 100.0
Event Marker 1 % 0.0 to 100.0
Microphone 2 on/off 0.0 to 100.0
Synchronization 1
TOTAL 32
-4 All the [PI] reasoning and following rules, as well as the CLIPS coding, were provided by Dennis M. Heher, Caelum Research Corporation, Moffett Field, CA
The statistical information calculated by [PI] is then transferred to the expert system reasoning engine to check for signal presence. When activated for the first time, [PI] waits 20 second before analyzing the signals for presence and then performs this check every second. The criteria used by the reasoning engine for signal presence are tabulated in Table 4.3; note that the units for these statistical quantities (both on the table below and the following one) are related to the units presented in Table 4.2 for each individual signal.
Table 4.3: Criteria used by [PI] for Signal Presence
SIGNAL Present if Converted Units
EEG (C3, 01, C4, 02) variance >= 20.0 gV EOG (left, right) variance >= 20.0 gV EMG (left, right) variance >= 5.0 gV
EKG standard dev. >= 0.10 mV
SaO2 mV value >= 1.0 %
PWave standard dev. >= 15.00 %
RIP (abdominal, rib cage) variance >= 1 %
Airflow variance >= 5.0 %
Event Marker Signal is on* %
Microphone Signal is on* On/off
* For the event marker and the microphone there is no way to check for signal presence until a signal is on
Once the [PI] rules have established the presence of a signal, the signal quality is then analyzed with a different set of rules. As before, the rules change from signal to signal. For every signals, [PI] has rules for good (green light), poor (red light) and marginal/unknown (amber light) quality signal. When a poor signal is detected, the malfunction procedures are shown on the diagnostic box. The signal quality rules are shown in Table 4.4.
Table 4.4: [PII Signal Quality Rules
SIGNAL STATUS RULES
EEG Good 100 <variance< 4000 (gtV) Unknown 4000 <variance< 7500
Poor variance > 7500
EOG Good variance > 30 AND -100 <mean< 100 (pV) Unknown variance < 30 AND -100 <mean< 100
Poor mean > 100 OR mean < -100 EMG Unknown Currently no Diagnostics
EKG Good 1 <bps< 1.8
(mV) Unknown 0.75 <bps< 1.0 OR 1.8 <bps< 2.5
Poor bps < 0.75 OR bps > 2.5
SaO2 Good value > 95%
(%) Poor value < 95%
PWave Good 1 <bps< 1.8
(%) Unknown 0.75 <bps< 1.0 OR 1.8 <bps< 2.5 Poor bps < 0.75 OR bps > 2.5
RIP Good ave-dev > 1.0
(%) Poor ave-dev < 1.0
Airflow Good 5 <ave-dev< 60
(%) Unknown 0.5 <ave-dev< 5
Poor ave-dev < 0.5 OR ave-dev > 60
Mic Good ave-dev > 0.5
(on/off) Unknolwn ave-dev < 0.5
Note that [PI] does not perform any diagnostics for the EMG signals, since its "noisy" nature makes it extremely difficult to quantitatively assess its quality. The only rules available for the EMG are those for signal presence. When a poor signal becomes stable, [PI] waits for 5 seconds before the changing the status light to green and removing the diagnostic message. A complete listing of the [PI] rules, coded in CLIPS, is presented in Appendix C. Note that [PI] does not make any distinctions as to whether the signals are coming directly from the DSR or from a pre-recorded data file.
Chapter 5
Experiment
5.1 Overview
The experiment whose results will be analyzed in this thesis was run as part of a pilot study throughout the month of January 1998. The pilot study was performed to acquire preliminary results on the efficacy of [PI] to submit to the National Space Biomedical Research Institute: on the basis of these findings, a full NSBRI grant for further [PI] studies was awarded to Professor Laurence Young in April 1998. This pilot study was divided in two phases which were very distinct and had different goals. The second phase of the experiment, conducted with a decision facilitation approach', was geared to the evaluation of this particular version of [PI] (for the Sleep Experiment), in an attempt to pinpoint its weaknesses and areas that needed improvement before the Neurolab Mission. While the findings from this phase are of no particular relevance to this thesis, they were nonetheless interesting: a brief description and discussion of this phase of the pilot study (as written and submitted to Dr. Derk-Jan Dijk of Brigham and Women's Hospital) is presented in Appendix D.
The first phase of the pilot study, which will be the focus of this thesis, was conducted using live subjects to test the hypothesis that an expert system such as [PI] would successfully assist users with the performance of a life sciences experiment relatively out of their field of expertise. The experiment was conducted following a
comparison-based approach2, since the results were compared to a control condition, with
training but no computer decision aid. The goal was also to pinpoint the effects that improved subject's performance during the experiment.
5.2 Subjects
A total of twelve subjects, six male and six female, took part in this experiment. The subjects were all graduate students in the Department of Aeronautics and Astronautics at MIT. Informed consent was obtained from each subject prior to the beginning of the experiment sessions. A sample of the informed consent form is reported in Appendix E. The mean age of the subjects is 25 years; only one subject was older than 30 years.
During the first meeting, the subjects were also asked to complete a questionnaire to establish the uniformity of the subject pool: the questionnaire revealed that none of the subjects had ever been previously exposed to sleep signal monitoring experiments, and that they were all right handed. Subject 5 was partly colorblind but he did not specify to what extent, or if this condition would impair his capability to conduct the experiment. A copy of the questionnaire is also provided in Appendix E.
5.3 Training and Experimental Protocol
5.3.1 Training
The day before the beginning of the experiment, the subjects attended an hour and a half long training lecture. The training introduced the subjects to the identification of electrophysiological sleep data, including the detection of signal anomalies created by
improper instrumentation setup or hardware malfunction. An abbreviated version of the material covered in the Signal Overview chapter was presented. The subjects were also introduced to [PI] and its diagnostic capabilities. A live demonstration was given to the subjects by having [PI] play a data file. The experiment was fully described and a short quiz was administered at the end of the session to assess the adequacy of the level of training of the subjects, who mostly received perfect scores. A copy of the quiz is shown in Appendix F.
5.3.2 Experimental Protocol
The subjects were divided into two groups of six and asked to monitor a set of pre-recorded electrophysiological signals and detect and identify each signal artifact displayed on the screen. Due to scheduling and subjects' time constraints, the groups were not balanced by gender. The first group (group A) was composed of four males and two females and the second group (group B) by four females and two males. Acting as his or her own control group, every subject performed the experiment with and without the help of [PI]'s diagnostic capabilities on two consecutive days. The groups performed the tests in a crossover fashion as represented below:
Table 5.1: Experimental Test Matrix
Day 1 Day 2
Group A [PI] Diagnostics ON [PI] Diagnostics OFF Group B [PI] Diagnostics OFF [PI] Diagnostics ON
The subjects were provided with a reference manual containing a synopsis of the training session, as well as a list of the anomalies displayed by [PI] (see Appendix F). After briefly reviewing the material covered in the training session, the subjects were
instructed to start. The duration of every test session was about twenty minutes. All the twelve subjects completed the experiment and no software or hardware failures were experienced.
5.4 Data File
The data file the subjects were asked to monitor was recorded at the Johnson Space Center during one of Neurolab crew member Richard Linnehan's training sessions. The data file contains a total of 59 anomalies for the electrophysiological signals (4 EEG,
2 EOG) and the EKG. The subjects were instructed to ignore the EMG, since [PI] does not perform signal quality diagnostics and it would have been impossible to calculate any kind of response time without knowing the onset time. Also, since the subjects were asked to monitor only the signals displayed on the electrophysiological window, the reasoning for the cardiorespiratory signals was deactivated to prevent [PI] from displaying warning messages about the CP signals in the diagnostic box, which could have distracted or confused the subjects. Because it was a real, therefore not artificially assembled, data file, the order of the anomalies is at random and it consists mostly of popping anomalies (47) mixed with nine flat signals and five noisy signals. At least one anomaly appears on every signal displayed. The same file was used for all the tests on both days, but, due to the duration and random order of the artifacts presented, there were no indications that the subjects acquired enough familiarity with the file to influence their performances on the second experimental day. In order to compare the results obtained by the subjects, the data file was played on [PI] without intervention from a user, therefore the output response file simply contained a series of 59 anomaly onset times.
The file was then replayed to visually inspect the nature of the 59 reported signal artifacts in order to assign each one of them to one of the three major signal artifact groups. This provided a sort of "answer key" to which the subject response files could be compared. This recorded list of events is shown in Appendix G.
Chapter 6
Data Collection and Analysis
6.1 Overview
For every test session, [PI] created a text file containing anomaly onset times and subject response times as well as subjects' anomaly identifications. With twelve subjects running the experiment twice, therefore, a total of 24 raw response files was recorded. In order to be analyzed, the data had to be re-arranged and sorted out in a variety of ways.
6.2 Raw Data Acquisition
Whenever detecting a signal artifact, [PI] recorded both the clock time and the data file playback time in the response file. Any [PI] detection was accompanied by the line:
[PI] <signal> poor quality.
Whenever a subject detected an anomaly (either by himself or herself, or with the help of [PI]'s warning lights) and clicked on the button next to the appropriate signal, [PI] recorded the mouse click time (both as clock time and data file playback time). The mouse click also froze the data play back and opened a message box presenting the subject with four choices for the signal diagnosis: "popping," "flat," "noise," or "other." The "other" option was followed by a small text box where the subject could type a particular diagnosis or comment. When an anomaly option was chosen, and the "ok" button on the message box clicked, [PI] resumed the data play back. On the response files, subject detection times appeared just as the [PI] detections explained above, with
the exception of the "[PI]" sign. The complete series of the 24 raw data files is shown in Appendix G.
6.3 Data Format and Manipulation 6.3.1 Data Extraction
Using a database and a routine based on Visual Basic for Applications', the onset and response times were extracted and inserted into a spreadsheet. The routine was programmed to search for an onset data file time (labeled by the [PI] sign) and then look for its corresponding subject response time. The time window allowed for every response time was five seconds before [PI] detection (since it was observed that subjects would sometimes detect the anomaly visually before [PI] completed its statistical analysis and flashed a red light) and twenty seconds after it. The value of twenty seconds was chosen because that is the time window displayed on the [PI] screen. After appearing, an anomaly would take twenty seconds to "travel" across the screen before disappearing (unless it continued on when the screen was completely refreshed). If the corresponding response was not found within the time window, that particular anomaly was considered to be "timed out" and a value of 30 seconds for the subject response time was assigned. The code for the routine, as well as documentation on the database, is presented in Appendix I.
6.3.2 Data Manipulation and Analysis
After obtaining the complete set of data in the spreadsheet, the subject reaction time for every anomaly was calculated by subtracting the anomaly onset time from the subject response time. For example, for the ith subject and the jth anomaly, the reaction time was calculated as follows:
REACTj = (SUBJ_RESP)i, - ([PI] ONSET)i (1)
After the reaction times were computed, the average reaction times for every subject for every trial were found. The routine also inserted the number of undetected (timed-out) anomalies in the spreadsheet.
The mean effects of day and [PI] help on the average reaction time were calculated in seconds as follows:
[PI] effect = AVE_REACTno[PI - AVE_REACT[pIi for ever subject (2) DAY effect = AVE_REACTday 2 - AVE_REACTday 1 for every subject (3)
A positive effect for a given condition indicates that the [PI] assistance or day effect decreased the reaction time (or the number of undetected anomalies)2.
Every individual trial was labeled with the following variables: subject, group, gender, day, and [PI] help. Repeated measures analysis determined the significance of the effects and cross effects of these variables on reactions times, number of undetected
anomalies and correct identifications. The results are presented in the following chapter, while the tabulated data used for the analysis is shown in Appendix H.
Chapter 7
Results and Discussion
7.1 Analyzed Effects
This chapter presents the results obtained for the data analysis defined in the previous chapter. Main and cross effects are reported and discussed for general reaction time, as well as for reaction times per anomaly type. The effects on the number of undetected anomalies are also studied. Before analyzing the reaction times for every subject, it was necessary to verify the absence of autocorrelation of the responses within the individual subjects: he analyses described below, in fact, required every response time to be completely independent and uninfluenced by the previous and following response (hence, the data points needed to be randomly distributed). Autocorrelation plots for every kind of anomaly for every subject, with or without the assistance of [PI], were studied, and the absence of autocorrelation was confirmed.
7.2 Reaction Times
The average reaction times for the subjects, divided into the two groups, were plotted to graphically observe the performance. These plots are shown in Figures 7.1 (a) and (b).
Assistance - x-[PI] Active e[PI] Inactive 20 --10 -... 1 2 3 4 5 6 7 Subject Number
Figure 7.1 (a) and (b): Subject Overall Average Reaction
I I I I I
Assistance
-x[PI]Active -e- [PI] Inactive
/
8. 9 10 11 1
8 9 10 11 12
Subject Number
Times for Groups A & B
Before proceeding to the repeated measures analysis, several observations can be inferred from the graphs about the average reaction time of the subjects. Members of group B performed the experiment without the assistance of [PI] on the first day and with the assistance of [PI] on the second day. Most of these subjects showed a significant improvement in response time the second day, when [PI] was activated, as seen in Figure 7.1 (b). The average response time for Group B almost decreased by half on day two with [PI] assistance. Group A, however, which received assistance from [PI] diagnostics on day one, did not show a significant difference in average response time on day two, when [PI] assistance was not given, as shown in Figure 7.1 (a). The average response time decreased only by a minimum amount on day two (without [PI] assistance).
The table below summarizes the statistical analysis for the average overall reaction time:
Table 7.1: Main and Cross Effects on Average Reaction Time
Effects N T2 F p Mean Effect5
(s)
DAY (D) 59 1.337 2.586 0.127 3.322
[PI] Assistance (PI) 59 1.327 2.157 0.161 3.299
PIxD 59 1.35 14.953 0.001 10.062
Statistically, the only effect on the average reaction time was the combination of [PI] assistance and day, suggesting that the subjects were able to detect signal anomalies about 10 second faster with [PI] on the second day, due to a positive influence of training. This would indicate a training effect on both the usage of [PI] and the monitoring of sleep signals. This is reflected in Figure 7.1 (b) where the subjects who used [PI] on the second day performed much better the other subjects.
In order to verify if the subjects performed in different ways with particular kinds of anomalies, the same sort of analysis was performed for each of the three anomaly types. The average reaction times for popping anomalies are shown in Figures 7.2 (a) and (b) on the next page.
n is the number of cases used for every type of measure studied. The maximum number for this value is
59, since the data files recorded contained 59 anomalies.
2 t is the pool variance obtained from the t-test and it indicates the significance of a given effect on a
particular measurement.
3 F is the F-ratio, which is the ratio of the mean square of each effect or cross-effect to the mean square for error.
4
The p value is the probability of exceeding the F-ratio and indicates the significance of a given effect on a measurement. An effect is defined significant if the p value is less than 0.05.
30 30
U" Assistance Assistance
0 -- [Pl] Active: x -[Pl] Active :
U /
-e-- [PI] Inactive : [PI] Inactive
2 0
- 20 - /
E E
0 \ 0
Figure 7.2 (a) and (b): Average Reaction Times for Popping Anomalies
measures analysis:1 2 3 4 5 1.3296 7 8 9 10 11 12
Subject Number Subject Number
Figure 7.2 (a) and (b): Average Reaction Times for Popping Anomalies
As observed for the overall reaction time, group B performed better on the second
day when the subject received help from [PI] suggesting the same kind of cross-effect of [PI] assistance and training observed before. This was confirmed by the repeated measures analysis:
Table 7.2: Effects on Average Reaction Time for Popping Anomalies
Effects n T F p Mean Effect
anomalies)(s)
DAY (D) 45 1.117 1.692 0.212 2.822
[PI] Assistance (PI) 45 1.167 1.471 0.243 2.944
PIxD 45 1.329 13.29 0.002 10.096
As expected, the effect of day and [PI] help is greatly significant, causing the subject to react about 10 second faster. Note that the numerical values are similar to the overall reaction time. This is due to the fact that popping anomalies accounted for most of the signal artifacts present in the data file (about 76% of the total number of anomalies).
![Figure 1.1: The Evaluation Process of a System and [PI] Status 5](https://thumb-eu.123doks.com/thumbv2/123doknet/14105527.466029/18.918.277.648.233.547/figure-evaluation-process-pi-status.webp)
![Table 4.1: Signals Displayed by [PI]](https://thumb-eu.123doks.com/thumbv2/123doknet/14105527.466029/33.918.217.655.728.958/table-signals-displayed-pi.webp)