Brownfield Financing in the United States: From Social
Benefit-Cost Perspective
by
Rongtao Xu
B.S. in Environmental Science, Nanjing University, 2000
Submitted to the Department of Urban Studies and Planning In partial fulfillment of the requirements for the degrees of
Master in City Planning
and Master of Science in Real Estate Development at the
MASSACHUSETTS INSTITUTE OF TECHNOLOGY
June 2006
© Massachusetts Institute of Technology 2006. All rights reserved.
Signature of Author
………..…….
Rongtao Xu Department of Urban Studies and Planning
May 25, 2006
Certified by
……….
Professor Karen R. Polenske Professor of Regional Political Economy and Planning Thesis Supervisor
Accepted by
………...………
Professor Langley Keyes Ford Professor Chair, MCP Committee, Department of Urban Studies and Planning
Accepted by
………..…………
Professor David Geltner George Macomber Professor and Professor of Real Estate Finance Director, Center for Real Estate
Brownfield Financing in the United States: From Social
Benefit-Cost Perspective
by
Rongtao Xu
Submitted to the Department of Urban Studies and Planning In Partial Fulfillment of the Requirements for the Degree of
Master in City Planning
at the Massachusetts Institute of Technology
Abstract
Since 1995, the government has launched brownfield financing programs to promote brownfield cleanup and redevelopment in the United States. These programs have lowered financial barriers for brownfield developers and returned vibrant properties to communities.
In this study, I focus on examining the efficiency of these incentives from the social perspective and proposing optimal funding decision rules. I hypothesize that brownfield funds are not allocated optimally in some cases. First, I investigate the current
brownfield financing programs at federal, state, and local levels. Second, based on externality and welfare economics theories, I propose an optimal funding-decision flow chart. Third, by testing my hypothesis on three brownfield cases in Massachusetts, I perform social benefit-cost analyses and determine whether brownfield funds were justified by their social returns. Finally, I discuss the major findings from these case studies and point out ways to improve current brownfield financial and non-financial policies.
Based on theoretical analyses, I propose that the government should not sponsor projects with positive private net present values, but rather focus on projects that have positive net present social values and not feasible without subsidies. In the real world, it is difficult to measure the social benefits of a brownfield redevelopment accurately, especially before a development project is completed. Hedonic models show that only one of three cases exhibit significant positive enhancement on housing values after redevelopment. Only development of a simple rule-of-thumb benefit assessment toll would make an optimal brownfield funding decision possible.
Thesis Supervisor: Karen R. Polenske, Professor of Regional Political Economy and Planning, Department of Urban Studies and Planning
ACKNOWLEDGEMENTS
First and foremost, I would like to express my gratitude to my advisor and thesis
supervisor, Professor Karen R. Polenske, who introduced me to Master of City Planning Program and to my thesis topic, and who has given continuous advice and support throughout my two years’ studies at MIT.
I thank Professor David Geltner for introducing me to a lot of literature, which helped me understand the forefront issues in this field. His wonderful real estate finance courses enlighten me to design the research.
I offer special thanks to Dr. Henry O. Pollakowski and Mr. Andrew Jakabovics, who provided me valuable advice on building hedonic models and helped me locate real estate transaction data. Both of them are extremely busy, but spend a great amount of time and efforts, even holidays, in offering help.
My research would not have been possible without the willingness of Warren Group to share their valuable housing transaction data.
I am grateful to Ms. Lisa Sweeney and Mr. Daniel Sheehan, GIS specialists at Rotch Library, who provided me with GIS help. They were very patient and willing to teach me step by step.
I also appreciate the help I received from Dr. James Hamilton, who helped me connect with local contacts in brownfield redevelopment and gave me valuable comments. I am indebted for advice and provision of data to Dr. Kris F. Wernstedt at RFF, Ms. Carol Tucker at EPA region One, and Mr. Mark Hawke at Community Development and Planning Department, City of Gardner.
My research was supported during the past two years by a tuition grant from the Department of Urban Studies and Planning and stipend grants from accounts 3903800 and 3655700 (MIT Multiregional Planning Research Fund). I thank MIT for making this research possible.
I appreciate that Sandy Wellford and Maria Vieira gave me encouragement as well as administrative help. I thank Dr. Jinbao Tong and Mr. Hongliang Zhang for their valuable comments.
Last, but not least, I am grateful to my parents and my wife. Their long-term support and encouragement have kept me moving forward in my research and studies at MIT.
CONTENTS
ABSTRACT... 2 ACKNOWLEDGEMENTS... 3 CONTENTS ... 4 FIGURES ... 7 TABLES ... 8CHAPTER 1 INTRODUCTION AND BACKGROUND ... 9
1.1METHODOLOGIES... 9
1.2DATA AND SOFTWARE... 11
1.3OVERVIEW OF CHAPTERS... 11
CHAPTER 2 BROWNFIELD FINANCING IN THE UNITED STATES... 13
2.1BACKGROUND... 13
2.1.1 What is a Brownfield? ... 14
2.1.2 Brief History of Regulations on Brownfields and Superfund Sites ... 15
2.1.3 Major Obstacles for Brownfield Redevelopment ... 16
2.1.4 Stakeholders and Their Perspectives in Brownfield Redevelopment ... 17
2.2SPECIAL COSTS FOR BROWNFIELD REDEVELOPMENT... 21
2.2.1 Direct Costs ... 21
2.2.2 Indirect Costs ... 23
2.3FEDERAL,STATE, AND LOCAL BROWNFIELD FINANCING PROGRAMS... 24
2.3.1 Federal Programs ... 25
2.3.2 State and Local Programs... 28
2.4PROS AND CONS OF THE CURRENT U.S.BROWNFIELD FINANCING PROGRAMS... 29
2.4.1 Pros of Current Brownfield Financing Programs ... 29
CHAPTER 3 OPTIMAL BROWNFIELD INCENTIVES ... 32
3.1THEORETICAL ANALYSES –OPTIMAL GOVERNMENT INTERVENTION... 32
3.1.1 Externality and Market Failure ... 32
3.1.2 An Optimal Funding Allocation Mechanism... 36
3.2RESEARCH HYPOTHESIS... 38
3.3METHODOLOGIES... 38
3.4MEASURING SOCIAL INVESTMENT COSTS AND BENEFITS OF BROWNFIELD PROJECTS.. 39
3.4.1 Rationale of Selecting Benefits and Costs ... 40
3.4.2 Measuring Public Costs of Brownfield Redevelopment ... 40
3.4.3 Measuring Public Benefits of Brownfield Redevelopment... 41
3.5HEDONIC MODEL... 44
3.5.1 The Principles of Using Hedonic Model ... 44
3.5.2 Data Sources ... 45
3.5.3 Model Specification ... 46
3.5.4 The Process of Model Building... 47
3.6CONCLUSION... 50
CHAPTER 4 CASE STUDIES IN MASSACHUSETTS ... 51
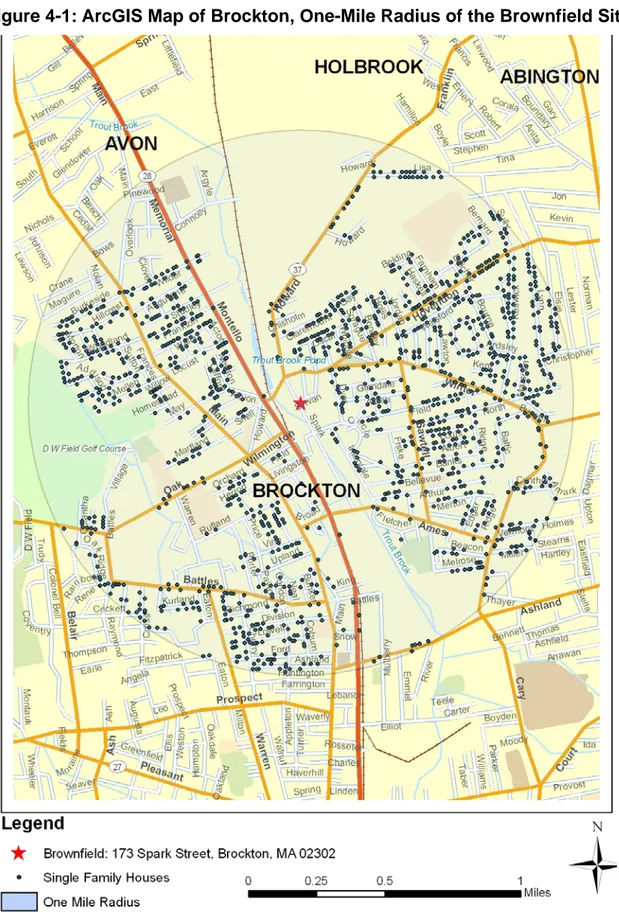
4.1.CASE ONE:BROCKTON,MA ... 51
4.1.1 Site Description... 52
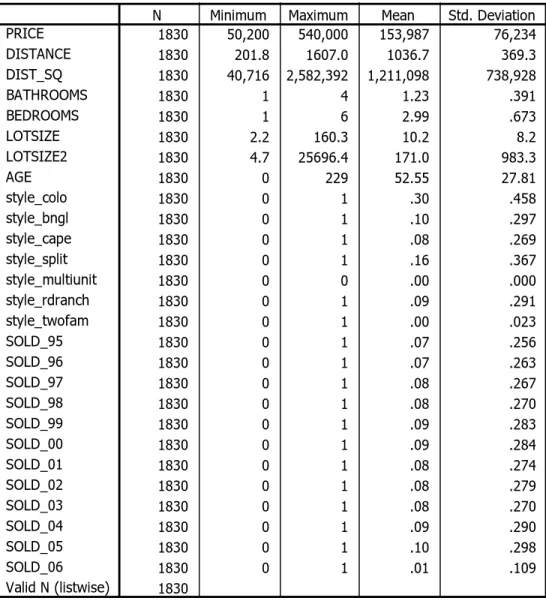
4.1.2 Data Set ... 54
4.1.3 Data Analyses... 55
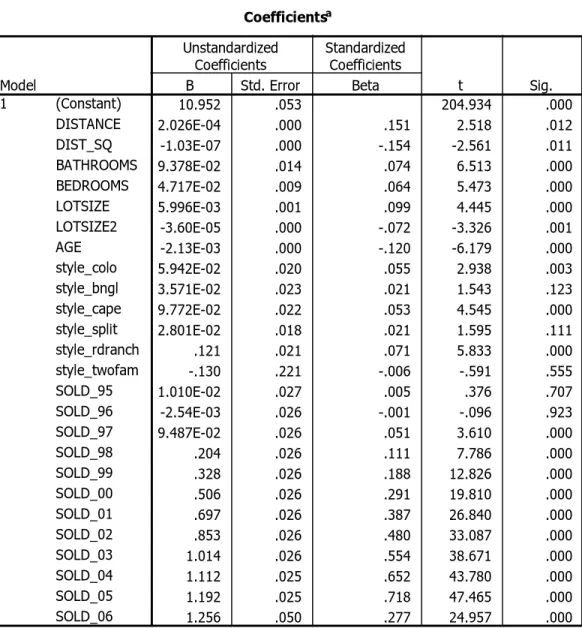
4.1.4 Review of Regression Results ... 57
4.1.5 Comparison Between Before and After Remediation Effects ... 59
4.1.6 Discounted Cash-Flow Analysis for Brownfield Investment ... 62
4.1.7 Conclusion ... 63
4.2CASE TWO:GARDNER,MA ... 64
4.2.1 Site Description... 64
4.2.2 Data Set ... 66
4.2.3 Data Analyses... 67
4.2.5 Comparison between Before and After Remediation Effects... 70 4.2.6 Conclusion ... 73 4.3CASE 3:LYNN,MA ... 75 4.3.1 Site Description... 75 4.3.2 Data Set ... 77 4.3.3 Data Analyses... 79
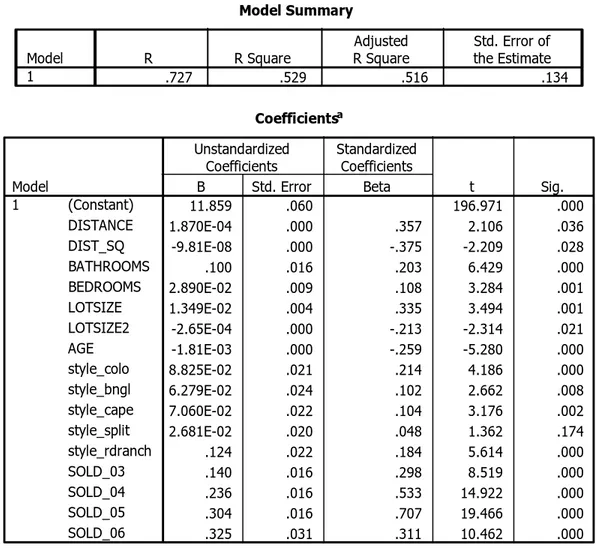
4.3.4 Review of Regression Results ... 79
4.3.5 Comparison Between Before and After Remediation Effects ... 81
4.3.6 Conclusion ... 86
4.4.MAJOR FINDINGS FROM CASE STUDIES... 86
4.5CAUTIONS WHEN INTERPRETING RESULTS... 87
CHAPTER 5 CONCLUSION... 91
5.1THE MAJOR FINDINGS OF THIS STUDY... 91
5.1.1 The Ideal Situation for an Optimal Brownfield Funding Decision ... 92
5.1.2 Measurement of Public Benefits and Costs ... 92
5.1.3 Background Noise for the Impacts of Brownfields and Brownfield Redevelopment ... 93
5.2ISSUES IN THE METHODOLOGIES AND FUTURE IMPROVEMENTS... 94
5.2.1 The Limitation of Hedonic Model in Evaluating Social Benefits... 94
5.2.2 Difficulty in Tracking Public Funds and Social Costs ... 95
5.2.3 Difficulty in Measuring the Full Public Benefits ... 96
5.3POLICY RECOMMENDATION... 96
5.3.1 Optimize Brownfield Funding ... 96
5.3.2 Proliferate Non-financial Incentives ... 99
FIGURES
Figure 3.1 Greenfield Development………...………...35 Figure 3.2 Brownfield Redevelopment………...………...36 Figure 3.3 Proposed Optimal Brownfield Funding Decision-Flow Chart……….37 Figure 4-1 ArcGIS Map of Brockton, One-Mile Radius of the Brownfield Site…………53 Figure 4-2 Photograph and Air Photograph of the Redeveloped Site in Brockton……54 Figure 4-3 Price-Distance Slope Before and After Remediation………...…...62 Figure 4-4 ArcGIS Map of Gardner, Half-Mile Radius of the Brownfield Site………….65 Figure 4-5 Photograph and Air Photograph of the Redeveloped Site in Gardner,
MA...66 Figure 4-6 ArcGIS Map of Lynn, Half-Mile Radius of the Brownfield Site………76 Figure 4-7 Photograph and Air Photograph of the Empire Laundry Site in Lynn,
TABLES
Table 2-1 Summary of Brownfield Financing Programs……… 25
Table 4-1 Highlights of Former Shoe Factory Site in Brockton……….51
Table 4-2 Descriptive Statistics for the Brownfield in Brockton………...……..55
Table 4-3 Regression Results for the Brownfield in Brockton………...………58
Table 4-4 Regression Results for the Brownfield in Brockton, 1994 to 2001………….60
Table 4-5 Regression Results for the Brownfield in Brockton, 2002 to 2006…………..61
Table 4-6 Discounted Cash Flow for Brockton Brownfield………...………….63
Table 4-7 Highlights of the 30 Wickman Drirve Site in Gardner, MA………64
Table 4-8 Descriptive Statistics for the Brownfield in Gardner, MA……… ...67
Table 4-9 Regression Results for the Brownfield in Gardner, MA………...….69
Table 4-10 Regression Results for the Brownfield in Gardner, MA, 1996 to 2001…….71
Table 4-11 Regression Results for the Brownfield in Gardner, MA, 2002 to 2006…….72
Table 4-12 Regression Results for the Brownfield in Gardner, MA with Distance and Structural Dummies………...……….……….74
Table 4-13 Highlights of Empire Laundry Site in Lynn, MA………...…………75
Table 4-14 Descriptive Statistics for the Brownfield in Lynn, MA………...…..78
Table 4-15 Regression Results for the Brownfield in Lynn, MA………...…….80
Table 4-16 Regression Results for the Brownfield in Lynn, MA, 1994 to 2001 (Pre-Remediation) ………...……….………..82
Table 4-17 Regression Results for the Brownfield in Lynn, MA, 2002 to 2006 (Post Remediation) ………...……….83
Table 4-18 Regression Results for the Brownfield in Lynn, MA with Distance and Structural Dummies ………...………85
Chapter 1
Introduction and Background
The deindustrialization in the United States led to the shift of manufacturing industries away first to the South and then to Asia, which left a great amount of vacant and polluted land (brownfield), especially in the Northeast of the United States. The legacies from deindustrialization have become a stigma for communities. It is not just an eyesore, but reduces tax revenues, impacts neighbor properties values, and poses a threat to human health. Since 1995, the government has mitigated the liabilities and provided financial assistances for brownfield redevelopment. These programs have promoted brownfield cleanup and redevelopment and boosted economic development and job growth.
In this study, I focus on financial incentives for brownfield remediation and redevelopment in the United States. From the social perspective, I examine the efficiency of brownfield funding allocation mechanisms and explore how to improve the system so as to maximize the social benefits. My hypothesis is that brownfield funds may not be allocated optimally in some cases.
1.1 Methodologies
I use case studies, benefit-cost analysis, and hedonic models to obtain my research findings.
Case studies
To support my hypothesis, I select three brownfield redevelopment cases in Massachusetts from EPA brownfield success stories to analyze the public benefits and costs. The EPA Region One brownfield website provides background information of the site and redevelopment (Source: http://www.epa.gov/NE/brownfields). I conduct the interviews with local planner to obtain further information.
Benefit-Cost Analysis
I examine public benefits and costs of the three brownfield cases and calculate the net present social values (NPSV). The public costs are the amount of public funds invested in a brownfield redevelopment project. I ignore indirect costs of a redevelopment, such as infrastructure, traffic, noise, and new pollution problems. Due to resource limitations, I only consider the local residents’ benefits from brownfield redevelopment and omit the benefits for local business and the general public. The core part of this study is to measure public benefits, since the costs are straightforward.
Hedonic Model
I employ hedonic models to measure indirectly local residents’ benefits from brownfield cleanup and redevelopment. The price-distance slope reflects residents’ willingness to pay for living farther away from the brownfield before remediation. The slope decrease after remediation should represent the brownfield redevelopment’s impact on housing price. By aggregating the price change for each house in the impact region, I derive the local residents’ benefits from brownfield remediation and redevelopment.
1.2 Data and Software
Housing transaction data are provided by the Warren Group (2006). I obtain background information of the three brownfield redevelopment cases from the EPA Region One website and local planning agencies. I use ArcGIS and U.S. Streetmap to perform the GIS analyses and use SPSS as the statistical analysis tool.
1.3 Overview of Chapters
The framework of the remaining chapters is as follows.
In Chapter 2, I first elaborate the background for brownfield regulations, the stakeholders in brownfield redevelopment, and the government’s roles in aligning the interests of all the parties. Then, I detail the special costs for brownfield developers and review current financing programs. Finally, I analyze the pros and cons of current incentives.
In Chapter 3, I first provide a theoretical framework for the analysis, including externalities and market efficiency. Based on the theoretical analysis, I propose an optimal brownfield financing-decision flow chart. Finally, I introduce my hypothesis and research methodologies, including case studies, benefit-costs analyses and hedonic models.
In Chapter 4, I use single-family housing transaction data to perform hedonic analyses to obtain local residents’ benefits from brownfield redevelopment. Based on public costs and benefits, I calculate the return for the public from brownfield redevelopment. In conclusion, I summarize the findings from the case studies and provide a caution when
interpreting the results.
In Chapter 5, I first reiterate the major findings of this study, then, I point out the issues concerning the methodologies I used, and, finally, I propose policy recommendations.
Chapter 2
Brownfield Financing in the United States
The financial obstacle for brownfield redevelopment is the extra costs related to brownfields, such as site assessment and remediation that they incur. These costs make brownfield projects difficult to compete with greenfield development in comparable locations. Since 1995, many federal and local programs have been established to provide financial assistance to brownfield developers to promote brownfield redevelopment. In this chapter, I first brief the background of brownfield financing programs and their roles in aligning all the parties’ interests in brownfield redevelopment. Then, I point out the special costs for brownfield redevelopment and review current brownfield financing programs in the United States, both at the federal and local levels. I conclude this chapter by examining pros and cons of brownfield financing programs.
2.1 Background
This section describes the history of brownfield regulations and the goals of four stakeholders in brownfield redevelopment.
2.1.1 What is a Brownfield?
Brownfield is a property with the pollution imposed by previous industrial activities, but the level of pollution is less than Superfund sites, which are the most polluted sites listed on the National Priority List (NPL). Based on HRS (hazard ranking score), those polluted sites with HRS over 28.5 will pose immediate or substantial threat to human health and will be categorized in NPL (Wang et al. 1998). EPA will use Superfund programs to finance or perform the clean-up activities and sue the responsible parties to recover clean-up costs. Other polluted sites with HRS lower than 28.5 will be subject to state legislatures.
The official definition of brownfield by the U.S. EPA is “real property, the expansion, redevelopment, or reuse of which may be complicated by the presence or potential presence of a hazardous substance, pollutant, or contaminant” (The Small Business Liability Relief and Brownfields Revitalization Act 2002). The National Roundtable on the Environment and the Economy (NRTEE 2005) defines brownfield as “an abandoned, vacant, derelict or underutilized commercial or industrial property where past actions have resulted in actual or perceived contamination and where there is an active potential for redevelopment”. People often use “Brownfield” as contaminated land or land with existing structures, by contrast to "Greenfield” (undeveloped land). There are other interchangeable or similar Items, such as “Improvement Areas”, “Special Sites”, “Smart Growth Opportunities”, and signature sites, impacted sites (Newfoundland) (aboutREMEDIATION 2005). In developing countries, such as China, there is no academically recognized term for brownfield.
2.1.2 Brief History of Regulations on Brownfields and Superfund Sites
Before 1976, the disposal of industrial and hazardous wastes was unregulated in the United States (Simons 1998). RCRA (the Resource Conservation and Recovery Act) was passed in 1976, followed by the Comprehensive Environmental Response Compensation and Liability Act—CERCLA, known as Superfund Law in 1980, to hold polluters responsible for cleaning up the pollution they produced. While RCRA imposes stringent regulations on the generation, transport, treatment, and disposal of hazardous wastes, CERCLA elaborates “expansive liability on a diverse number of parties contributing to the hazardous substances”, so-called “strict, retroactive, joint, and severable liability” (Simons 1998). The Superfund law has been a major obstacle for brownfield redevelopment, because it imposes liabilities to any party in the chain of title, whether or not they contributed to the pollution or not. Furthermore, RCRA and CERCLA allow for federal, state, and local governments and private parties to sue potential responsible parties for the clean-up or reimbursement of cleanup costs (Simons 1998). This makes it impossible for developers to settle liability waivers from all potential parties. The Superfund alone costs about $1.5 billion annually, while it only accounts for a small percentage of the approximately 450,000 brownfields in the United States (EPA 2002).
Realizing the obstacles imposed on brownfield redevelopment and neighborhood revitalization, the inflexible Superfund law since 1995 has begun to be replaced by state voluntary cleanup programs (VCPs) for non-NPL sites (brownfields). In 1995, EPA removed 20,000 sites from CERCLA and promoted revitalization of these less polluted
properties (Lange and McNeil 2004). VCPs are enacted to remove the impediments in brownfield redevelopment, including legal liability mitigation, technical assistance, and economic incentives. VCPs employ risk-based cleanup standards, which make clear for developers the remediation level and potential cleanup costs. States will issue a closure letter to notify developers that the remediation requirements are met. There are two types of state closure letters, i.e. NFA (no further action) and CNTS (covenant not to sue) (McCarthy, 2001). An NFA is issued by state agencies or certified private consultants to certify that no further action is required on the site “regarding the remedial action just completed” (Simons 1998). CNTS ensures all the state agencies not to sue in the future, except for certain conditions (reopeners). A Memorandum of Understanding (MOU) with EPA further binds EPA not to sue the owner in the future. VCPs also offer lenders and new owners exemptions from liabilities (McCarthy, 2001). In 2002, President George W. Bush signed into law “The Small Business Liability Relief and Brownfields Revitalization Act,” which grants federal liabilities relief and expands economic assistance to brownfield developers.
2.1.3 Major Obstacles for Brownfield Redevelopment
Liabilities and the extra costs associated with cleanup are the major obstacles for brownfield redevelopment. Developers of brownfields are confronted with higher development costs than developers of conventional development projects. The obstacles are especially larger for projects in non-prime locations and distressed areas, where brownfield cleanup and compliance costs make the financial situations even worse. In prime locations, remediation costs may be absorbed by the revenues from
the strong market. However, the liabilities create great uncertainties for developers, lenders, and equity investors even in these locations. It is very difficult to predict the cleanup and compliance costs beforehand. The Federal government can step in and hold developers responsible for new pollution problems, and individuals can sue developers and request them to compensate for their health problems. Before 1996, even lenders foreclose brownfield properties could enter the liability chain. The lender and fiduciary liabilities were waived via the passage of Asset Conservation, Lender Liability, and Deposit Insurance Protection Act of 1996 (McCarthy 2001). With high uncertainties and perceived risks, the costs of capital for brownfield projects are much higher, which result in the failure of brownfield project to pass feasibility studies by developers and investors. Besides the liabilities and costs, the prolonged timing makes developers stay away from brownfields. The timing is critical for the real estate industry. Developers would like to move ahead with projects if they sense the market will become favorable. However, the additional entitlement procedures, such as assessing the site and obtaining an NFA, will prolong the delivery period (McCarthy, 2001).
2.1.4 Stakeholders and Their Perspectives in Brownfield Redevelopment
There are multiple stakeholders involved in the process of brownfield redevelopment, including local residents, developers, the city, and the presumed society at large. They may have different objectives and motivations, which sometimes are in conflict. One of the usual cases is that community groups often want to transform a brownfield into open space, while the city intends to focus on generating jobs and revenues through development projects (Greenberg and Lewis 2000).
Developers
Stated in a simple way, the motivation for private developers1 is to make money from development projects, though in rare cases some private developers may be involved in projects for the pure purpose of public benefits. The basic evaluation principle for developers is that a project must have a reasonable likelihood of making profits. Development has uncertainties and risks, otherwise developers cannot make higher returns than safe investments, such as treasury bonds. Developers take the risks and are rewarded with high returns. Brownfield redevelopment involves more uncertainties than general development projects so that it requires higher returns. It also depends on the expertise of individual developers. Some developers have a better understanding and control of environmental and legal issues in brownfield redevelopment. So they can reduce the costs of capital and have better chances to win the projects.
Developers usually perform feasibility studies before making investment decisions. They first obtain the market information in the delivery period (development completion), such as the forecasted rent and vacancy rate for a certain final use in the same location as the brownfield. Based on the estimation of construction costs and debt financing cost, they derive projected levered internal rate of return (IRR) and net present value (NPV). If the IRR is larger than the threshold (the required return) or NPV is equal to or larger than zero, they will usually start the development project. Compared to conventional development projects, brownfield redevelopers are confronted with some unique issues. On the benefit side, they often can build on existing infrastructure, gain
1
zoning variances, and receive government subsidies. On the cost/risk side, they are exposed to extra remediation costs, compliance costs, liability concerns, and protracted timing. Developers also consider other non-financial factors, such as the marketability of the property due to a polluted stigma, and the support from community and politicians (Wernstedt et al. 2004). Developers will carefully factor these unique issues into feasibility studies.
Developers do not take public benefits into consideration when they make investment decisions. Although a brownfield redevelopment may bring great benefits to the city, local residents, or the society, without a positive NPV, developers may not get involved. Many scholars and policy makers advocate a public-private partnership, which tries to align the public and private interests (Battle, 2003).
City
The city where a brownfield is located will benefit from brownfield redevelopment. It transforms a vacant land and eyesore into a revenue- and job-generating property. First, the city gains property tax from the redeveloped site. Generally speaking, brownfields do not have active uses and contribute zero property tax. Second, the cleanup and redevelopment creates short-term employment and redeveloped commercial or industrial uses bring long-term jobs. Finally, the redevelopment and final uses create expenditure and other incomes for the city. Most cities prefer to redevelop the brownfield into a commercial or industrial use, which produces the highest tax revenue and job growth. A proposal of redevelopment with final use for public parks is definitely in conflict with the city’s interests in obtaining revenues (Greenberg and Lewis 2000).
Local Residents
Local residents usually benefit directly from brownfield cleanup and redevelopment. Removing residual pollutants reduces the health risks. Redevelopment of a vacant site into a vibrant use increases the aesthetic value of the neighborhood, which potentially increases their house prices and reduces crime rates. However, a redevelopment project may create negative impacts on the neighborhood, especially for commercial and industrial uses. These activities may create traffic, noise, and tax-rate increases. In many cases, residents prefer green space and recreational uses to commercial uses, which is in conflict with the city’s interests (Greenberg and Lewis 2000).
Society
Although no such interest groups exist in the real world, I presume that the society represents the aggregate benefits of every person in a country. From the social perspective, job creation and tax growth may be no more than the transfer from a place to another. Environmental and health benefits, such as saving of green spaces and reducing cancer-incidence rate, are the major benefits from brownfield redevelopment. Federal financial resources should be used with the goal of maximizing the social benefits.
All in all, developers, local residents, and the society may have different goals for brownfield redevelopment. Developers focus on the private profits from the redevelopment. The city targets job creation and tax revenue growth. Local residents pay attention to the health benefits and neighborhood improvement. In this study, I
focus on social perspective to examine the effectiveness of federal brownfield funding programs. The goal from the social perspective is to maximize the social benefits through the incentives. In this study, I only consider financial factors for developers to make decisions on brownfield redevelopment. I acknowledge non-economic factors that impact developers’ decisions, such as liability mitigation and the support from the community and local politicians. I assume that the federal government has limited funding sources for brownfield remediation and redevelopment, so it intends to prioritize funding towards the projects with the maximum social return (IRR).
2.2 Special Costs for Brownfield Redevelopment
Compared to greenfield projects, brownfield developers will have to spend extra money on site assessment, remediation, and other types of redevelopment efforts. Some costs can be observed directly, while other (indirect) costs are hidden in the pro-forma. Direct costs are well documented in various literature, but indirect costs are often overlooked by researchers and regulators.
2.2.1 Direct Costs
Site Assessment. Developers need to understand the level of pollution and the cost
and time of remediation through site assessment before making the development decision. In Phase One assessment, they review public records, physical surroundings, and other readily available data for the site; if needed, they will perform a detailed site assessment (Phase two assessment), such as environmental engineering investigation,
sampling, and chemical analysis of the site (McCarthy 2001). Assessment costs range from $20,000 to $500,000 (or more), depending on lot size, data availability, level of pollution, site history, clean-up requirements, etc. It is difficult to differentiate the assessment cost premium for brownfields, compared to other conventional development projects.
Environmental Remediation. Brownfield analysts categorize remediation costs into
one-time, ongoing operation and maintenance of remediation efforts and remedies, coordination and processing of remediation plan, and application and follow-up with regulatory parties (Simon 1998). Remediation costs depend upon the required clean-up levels, which are defined by risk-based cleanup standards. The standards consider site conditions (types of soils and water table) and the site’s end use (Simon 1998). Site conditions determine the travel potentials of pollutants, while end uses decide human health impacts. Generally speaking, residential uses require stringent standards, while industrial uses may have relatively loose cleanup requirements, considering the potential environmental risks.
Environmental Remediation Insurance. During brownfield cleanup and redevelopment,
developers may be faced with unforeseeable costs and law suits from other parties. Developers generally purchase environmental remediation insurance to insure against the environmental risks in brownfield redevelopment. There are two forms of environmental insurance available for remediation, cost-cap coverage and pollution legal liability. Cost-cap insurance (stop-loss coverage) makes sure that the remediation cost over a certain level will be covered by insurance companies. Pollution legal liability
protects the property owner against liabilities to third parties for off-site injury, property damage, and remediation costs caused by migrating contamination. The typical costs for pollution legal liability coverage for a seven-year term would be 2 percent of project cost. (Simons 1998; McCarthy 2001)
2.2.2 Indirect Costs
Financing Premiums. In addition to specific costs mentioned above, the typical
financing costs for brownfield redevelopment may be higher than conventional development projects. According to the Northeast-Midwest Institute’s report, “Financing Strategies for Brownfield Cleanup and Redevelopment” (2003), the financing premiums for brownfields are reflected in three ways: (1) Lenders tend to require borrowers to put at least 25 percent of equity to safeguard lenders’ positions. The higher equity percentage means higher costs for the projects, because the cost of equity is generally higher than that of debt. (2) Debt and equity investors may require higher returns. The report shows that the brownfield premium for equity is 10 to 20 percent and for debt is around 2 to 3 percent. (3) The underwriting costs for brownfield projects are higher. Lenders may require further analyses on environmental data and the collateral value. (Bartsch and Wells 2003)
Legal Fees. Due to the complicated liability issues involved in brownfield
redevelopment, developers generally pay higher legal fees than those for conventional development projects. For example, developers need to pay for filing legal documents to comply with various regulations on brownfields.
Extended Development Period. In order to perform extra environmental/legal due
diligence and environmental remediation, developers may spend more time on brownfield redevelopment than other greenfield projects, which makes projects more time-consuming and usually more expensive. First, the prolonged timing means lower returns, even with the same costs and revenues. For example, a real estate development project incurs the cost of $120M in year 1 and gains revenues plus sales of the projects of $150M in year 2. The project-level IRR is 25%. If the cost of $120M is divided into 2 periods, all other things being equal, the project-level IRR would be 16%. Second, the extra time also reflects more equity developers have to put in brownfield projects. Developers would have less time to work on other projects if they spend more time on the legal and environmental process of brownfields. Last, but not least, in the development industry, timing is very important. Developers may lose a project or incur great economic losses if they are late in bringing their product to the market.
2.3 Federal, State, and Local Brownfield Financing Programs
Realizing the difficult economic situation for brownfield redevelopment, many brownfield financing programs have been established in the United States to lower the financial barrier. There are numerous financing tools available at federal, state, and local levels for brownfield redevelopment in different development phases, ranging from site preparation, planning, site assessment, cleanup, to construction (Table 2-1). Different types of financing programs have been designed, such as loans, grants, and insurance.
and cleanup efforts. Grants are available for brownfield assessment and remediation. Cities sometimes provide guarantees for cleanup costs overrun so that developers can secure debts or lower the interest payments. Based on my literature review, most of current financing programs only target the direct costs, i.e., assessment and remediation costs, though some programs are designed to alleviate debt-financing costs.
Table 2-1: Summary of Brownfield Financing Programs
Agency Program Uses Eligible Entities
Site Assessment Grants Assessment
Revolving Loan Grant Remediation
Cleanup Grants Remediation
HUD BEDI Remediation
EDA Public Works and Economic
Development Programs Remediation
Treasury Tax Incentives Tax Deduction Developers
Tax Incremental Financing
Assessment,
remediation,planning, site preparation
Developers
GO Bonds Site acquisition,
remediation, infrastructure Local governments
State and local government agencies EPA
States or Cities
Source: Bartsch and Wells, 2003. Financing Strategies for Brownfield Cleanup and Redevelopment. Washington DC: Northeast-Midwest Institute.
2.3.1 Federal Programs
EPA and the Department of Housing and Urban Development’s (HUD) are two major funding sources at the federal level. Brownfield developers sometimes can tap other federal funding sources if it conforms to their criteria, with the target issues such as economic development, housing, and job creation.
U.S. Environmental Protection Agency Assessment and Cleanup Programs. Four
EPA financing programs have been used to promote brownfield redevelopment since 1995, including assessment grants, revolving loan fund grants, cleanup grants, and job training grants. (1) Site-assessment demonstration pilot programs provide grants of up to $250,000 over two years per site for assessing sites and designing clean-up and redevelopment models. (2) Brownfields cleanup revolving loan fund (BCRLF) programs provide low-or-no-interest loans of up to $1,000,000 over five years for the cleanup. (3) Site cleanup grants, started in FY 2003, can be used to clean up brownfields conducted by cities, development agencies, and nonprofit groups at sites that they own. (4) Job-training pilot programs furnish grants of up to $20,000 over two year for training residents of impacted areas for future employment in environmental field. In 2003, EPA announced $73 million in grants: 117 Assessment Grants, 28 Revolving Loan Fund Grants, 10 Job Training Grants, and 69 Cleanup Grants. EPA funds generally are not directly awarded to individual developers, but rather they are given to local government agencies or NGOs. EPA considers the following factors when making funding decisions: ownership status, size, access, districts, public benefits, cost, and contamination. (Source: http://www.epa.gov/swerosps/bf/pilot.htm)
U.S. Department of Housing and Urban Development’s (HUD) Brownfield Economic Development Initiative (BEDI) program. HUD recognizes that brownfields are one of
the major obstacles for economic and community development. Section 108 provides financing to local governments for property acquisition, rehabilitation, construction, site improvement, and other development activities. The BEDI program is designed to
assist cities in the redevelopment of abandoned and underutilized sites so as to increase the tax base and create jobs. BEDI funds must be used in conjunction with a new Section 108-guranteed loan commitment by providing funds for land write-down, remediation, fund reserves, direct enhancement for Section 108 loans, etc. HUD awarded $25 million grants and loan guarantees to brownfield projects in 2003. (Source: http://www.hud.gov/offices/cpd/economicdevelopment/programs/bedi/index.cfm)
Economic Development Administration Programs (EDA). EDA has allocated 20
percent of its funds, about $35 million a year, on brownfield related activities. EDA’s Public Works and Economic Development Programs is the major source of funds for brownfield redevelopment. The funding can be used for infrastructure enhancement, i.e., remediation costs specifically for brownfields. EDA funding is larger ($900,000 on average) and more flexible in terms of purposes than other sources. However, to be eligible for this funding, the communities must meet the target unemployment rates. (Bartsch and Wells, 2003)
U.S. Treasury Brownfield Tax Incentives. Brownfield tax incentives were originally
signed into law in August 1997, the Taxpayer Relief Act (Public Law 105-34) to “spur the cleanup and redevelopment of brownfields in distressed urban and rural areas” (EPA 2004). The U.S. Taxpayer Relief Act 2000 prescribes that environmental cleanup costs are fully deductible in the year they are incurred, rather than capitalized. According to the EPA Brownfield website, approximately $300 million of remediation costs in 8,000 brownfields are waived annually, and the tax incentive leverages $3.4 billion in private
investment. To be eligible for tax waiver, brownfields must be located in certain areas. (Source: http://www.epa.gov/swerosps/bf/bftaxinc.htm)
2.3.2 State and Local Programs
Tax Incremental Financing (TIF). TIF districts were originally established to redevelop
the blighted or distressed areas by States or cities. Redevelopment authorities issue bonds to finance redevelopment costs upfront, and then use increased property or sales taxes to repay the bonds. TIF allows cities to initiate revitalization in distressed areas and does not require public funds. It may pay for new infrastructure, planning expenses, demolition, site assessment, and cleanup costs. However, TIF is criticized for that it lacks of evidence that the redevelopment would not happen without TIF (Simons 1998).
Tax Incentives. States often offer tax abatements or tax credits to allow developers to
use projects’ revenues for financing brownfield-related costs, such as remediation.
General obligation (GO) bonds. States, towns, cities, and other municipal authorities
can issue municipal securities backed or secured by taxes. GO bonds are a major source of funds for infrastructure and redevelopment projects. Local governments can use GO bonds for site acquisition, remediation, and infrastructure enhancement. Unlike TIF, GO bonds will be counted against a jurisdiction’s debt caps (Bartsch and Wells 2003).
Besides tax incentives and GO bonds, some States provide revolving loans, grants, technical assistance, and environmental insurance for brownfield assessment and
remediation. Cities often provide zoning relief for brownfield projects to encourage redevelopment.
2.4 Pros and Cons of the Current U.S. Brownfield Financing Programs
Federal and State brownfield financing programs have provided financial assistance for brownfield cleanup and redevelopment and promoted economic development and environmental quality in the United States. Without financing programs, many brownfield projects will not happen, due to financial difficulties. Based on my review of current financing programs, I summarize their pros and cons below.
2.4.1 Pros of Current Brownfield Financing Programs
Making Decision Locally. Most federal brownfield financing programs are awarded to
local governments or agencies, rather than individual developers. States or municipalities are more familiar with local situations than the federal government and have a better understanding of local priorities. It has an advantage that the money can be used wisely by allowing localities to make decisions on allocating brownfield funding.
Taking Costs into Consideration. When considering the remediation and assessment
loans/grants, the administrating agencies often take into account of site size, the level and types of pollution, and other cost related information. This ensures that the funding is allocated based on the needs.
major obstacle for brownfield redevelopment. More and more cities provide grants or forgivable loans for site assessment and make the assessment information available to potential developers. They make developers informed of the costs and the time for cleanup.
Reducing Debt Financing Costs. Cities also recognize the indirect costs of brownfield
redevelopment by reducing developers’ costs of debt financing costs and offering tax abatement. Many cities provide low or no interest loans for remediation costs and offer tax breaks in certain periods.
2.4.2 Cons of Current Brownfield Financing Programs
Failure to Consider the Full Costs. Currently most financing programs target direct
costs of brownfield cleanup and redevelopment, i.e., assessment and remediation costs. Although some programs relieve the costs of debt financing, no financing programs take account of the full indirect costs of a brownfield project. For some projects, indirect costs may account for a larger percentage than direct costs.
No Consistent and Quantitative Funding Allocation Criteria. Most funding decisions are
made locally by States or cities. No consistent and quantitative criteria have been established to evaluate the brownfield projects and allocate the funding. There are generally more than 20 brownfield financing programs for which a developer can apply. The financial resources for brownfield are scarce and scattered in different entities. Developers experience difficulties in tapping these resources. Based on my conversations with selected developers, they would rather not take the time to go
through the long process for a small chance to get a small amount of money. Local governments could streamline the process by integrating all the brownfield financing programs into one or two agencies.
No Quantitative Measurement Public Benefits of Brownfield Redevelopment. Although
many agency reports document the public benefits of brownfield redevelopment, they do not take into account public benefits, or, at least not quantitatively measure them when making funding decisions. Because of the limited funding sources, the financial resources should be allocated to the projects contributing the largest benefits to the society.
To sum up, current brownfield financing programs cannot cover the full extra costs of remediation and redevelopment. They are designed to remove uncertainties and lower the financial burdens for brownfield developers. The funding decision considers the actual costs and some indirect costs. Brownfield funding would be used more efficiently if it can develop a way to measure public benefits and streamline the application process.
Chapter 3
Optimal Brownfield Incentives
Brownfield redevelopment is basically an externality problem and requires government intervention. In this chapter, I begin with theoretical analyses and explore the optimal incentives for brownfield redevelopment. Based on the theoretical analyses, I provide a research hypothesis, methodologies, and data.
3.1 Theoretical Analyses – Optimal Government Intervention
The theoretical foundation for brownfield financing is externality and market failure.
3.1.1 Externality and Market Failure2
An externality is defined as “occurs when a decision causes costs or benefits to stakeholders other than the decision maker”, but “the decision maker does not bear all of the costs or reap all the gains from his or her action” (Wikipedia). There are two types of externalities, i.e. positive and negative externalities. Pollution is a typical example of negative externality, which creates external costs to other stakeholders (e.g. health problems and pollution abatement costs), but the polluter may not compensate the costs
to the impacted stakeholders. The full cost to the society is larger than the cost to producers/polluters, due to the additional “external costs”. Goods with negative externalities, if without government intervention, will be overproduced/over-consumed from the society’s point of view. Education is a typical kind of goods with positive externalities. It brings more benefits to the society than the tuitions. Goods with positive externalities, if without government intervention, will be under-produced or under-consumed from society’s point of view. (Wikipedia)
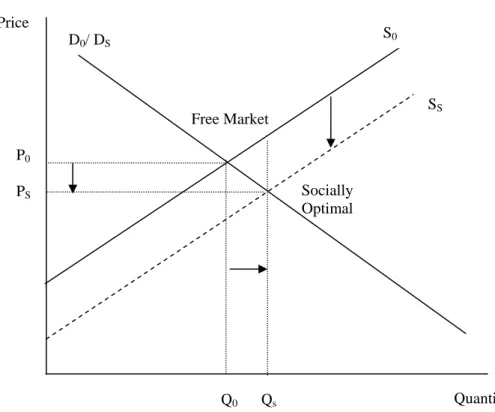
When there are needs for real estate, a developer may face the choices of developing either a greenfield or a brownfield. From the social perspective, for greenfield development, developers take natural habitats or agricultural lands, which otherwise can provide environmental benefits to the society, such as bio-diversity, clean air, and pollution abatement. Greenfield development, as a kind of goods with negative externalities, would be over produced without appropriate government intervention. Brownfield redevelopment not only saves greenfields, but it also provides other social benefits, such as environmental and health benefits for communities. If these external benefits are not subsidized by the government, brownfield redevelopment would be under produced.
From the perspective of the society or welfare economics, both kinds of externalities will lead to the economy deflecting from the socially optimal status, i.e., incurring a market failure. In greenfield development, due to the underestimated costs (external costs), the market price (P0) is lower and the quantity (Q0) is higher than the optimal levels
benefits), the market price (P0) is higher and the quantity (Q0) is lower than the optimal
levels (Figure 3.2). (Wikipedia)
To correct for market failures, there are usually two types of solutions, i.e. private negotiation and public intervention. Ronald Coase argued that individuals could settle agreements through negotiations. For example, the producers of external benefits can bargain with the beneficiaries (the recipients of external benefits) and receive compensations from them. However, the Coase Theorem is contingent upon the following conditions: “(1) property rights are well defined; (2) people act rationally; (3) transaction costs are minimal” (Coase 1960; Wikipedia). In brownfield or greenfield development, it is evident that these conditions are not satisfied. For example, it is very difficult to identify who receive the benefits of brownfield redevelopment. Also, the transaction costs for negotiating with the beneficiaries and collecting the payments are very high. Governmental intervention can take several forms: tax, subsidies, and quantity control. For goods with negative externalities, such as greenfield development, the government can charge a pollution/resource tax (PS – P0) on the
producer, thus the supply curve shifts up by PS – P0. The new equilibrium will be equal
to the socially optimal status. Alternatively, government can identify the optimal quantity QS and set the quota at QS (figure 3.1). For goods of positive externalities,
such as brownfield redevelopment, governments can subsidize the producer by PS – P0
and shift the supply curve down by PS – P0. The new equilibrium reaches the socially
optimal status. Similar to the previous situation, quantity control can lead to the same effect (Figure 3.2).
Government intervention has its own problems and may result in government failure. On the one hand, it is very hard to calculate the optimal tax, subsidy, and quota, because the external benefits or costs cannot be observed in the market and are thus difficult to quantify. On the other hand, it may cause economic inefficiency by public policy, such as rent-seeking and shortsightedness effect.
(Source: http://en.wikipedia.org/wiki/Government_failure)
Brownfield redevelopment contributes to the society with many benefits without being compensated (positive externality). Brownfield redevelopment would be undersupplied without government intervention. Fortunately, many brownfield financing programs have provided subsidies, thus increased the supply of redevelopment. Theoretically, if these subsidies are equal to the external benefits the brownfield redevelopment creates, they are successful in correcting market failure.
D0/DS SS S0 PS P0 Socially Optimal Free Market Price
Figure 3.1: Greenfield Development
Quantity
Source: edited by the author. QS Q0
Figure 3.2: Brownfield Redevelopment Free Market Price Socially Optimal Quantity D0/ DS SS S0 P0 PS Q0 Qs
P0: Private Price; PS: Social Optimal Price; S0: Private Supply Curve; SS: Social Supply
Curve; Q0: Private Quantity; QS: Social Optimal Quantity.
Source: edited by the author.
3.1.2 An Optimal Funding Allocation Mechanism
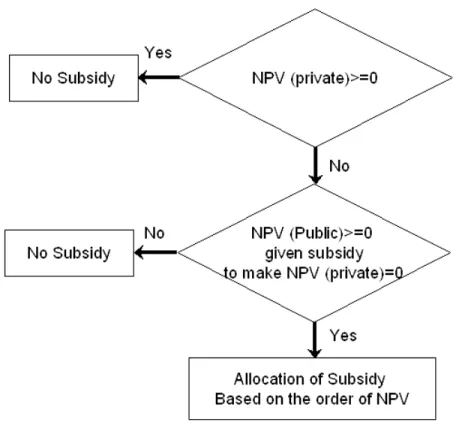
In the real world, the government does not have the financial resources to subsidize all the positive externality. I design a brownfield funding-decision flow chart, which maximizes the social returns within the public-funding limit (Figure 3.3). First, if a brownfield project has a positive or zero private net present value (NPV), governments should not fund it. Many brownfield redevelopment projects have been funded by
developers themselves without public funding. Second, if the private NPV is negative, we can calculate the amount of subsidies to make private NPV zero. Based on the amount of subsidies (investment costs) and public benefits (revenues) from a brownfield project, the net present social value (NPSV) can be derived. If a project’s NPSV is negative, governments should not fund the project. If a project’s NPSV is larger or equal to zero, governments should consider its funding application. Finally, if the available funding is less than the required amount based on a social NPV analysis, then the funding allocation should give priorities to those projects with larger NPSVs.
Figure 3.3: Proposed Optimal Brownfield Funding Decision-Flow Chart
Source: the author.
3.2 Research Hypothesis
In this study, I examine if the brownfield funding is allocated in a way to correct market failure, based on the optimal framework that I proposes in Figure 3.3. Given the limitation of available brownfield funding, the funding should be allocated to the projects that both need public money and generate the maximum public benefits. Due to confidentiality, private NPV (the first step in the flow chart) and/or the subsidy to make private NPV zero are difficult to obtain. And I do not have sufficient data to test if funded projects have larger NPSVs than not-funded projects. I can only investigate if NPSVs of funded brownfield projects are positive.
My research hypothesis is that current brownfield incentives are sub-optimal: the funding decision does not consider NPSV so that some funds are allocated to projects with negative NPSVs.
3.3 Methodologies
I use case studies and benefit-cost analysis to test my hypothesis. I test whether the NPSVs of selected cases are negative.
Case Studies
To support my hypothesis, I select three brownfield cases in Massachusetts to examine the effectiveness of brownfield incentives. I also obtain further background information from local planning agencies in the three towns. By examining the social returns of
three brownfield redevelopment cases, I intend to test my hypothesis.
Benefit-Cost Analysis
Benefit-costs analysis is often used to evaluate the public projects. In this study, I modify it to evaluate the public benefits and costs of brownfield projects from a social perspective.
To quantify the social return of a brownfield project, I use DCF (Discounted Cash Flow) analysis. I calculate the NPSV and Internal Rate of Return (IRR) of brownfield projects, based on the cash flow of social benefits and costs (Brealey and Myers, 2006). The government should not sponsor negative NPSV projects and should prefer projects with larger NPSVs. Also, the government should not subsidize the projects with IRRs smaller than its “opportunity cost of capital”.
H H H H r r r r r C NPSV ) 1 ( ) 1 ( ... ) 1 ( ) 1 ( 1 3 3 2 2 1 0 + + + + + + + + + + = CF CF CF CF PV
PVH: horizon value; r: opportunity cost of capital.
0 ) 1 ( ... ) 1 ( ) 1 ( 1 3 3 2 2 1 0 + + + + + + + + = = T T IRR IRR IRR IRR C NPSV CF CF CF CF
3.4 Measuring Social Investment Costs and Benefits of Brownfield projects
In social benefit-cost analyses, the key step is to identify and measure public benefits and public investments (public costs) of brownfield projects.
3.4.1 Rationale of Selecting Benefits and Costs
The benefits of brownfield redevelopment covered in various literature encompass the increase of tax revenues, job growth, environmental and health benefits, efficient use of existing infrastructure, transportation, etc. The purpose of this study is to identify those social benefits and costs that are not reflected in the free market and so entail government intervention by generating incentives. Hence, I intentionally exclude some benefits and costs associated with brownfield redevelopment that are either not valid in social perspective or already internalized. For example, a tax-base increase and job creation are benefits to the community, but greenfield projects could produce similar benefits. They are no more than a transfer of benefits from one place to another. Considering that some benefits are controversial, I focus my benefit-cost analysis on easily identified benefits and costs.
3.4.2 Measuring Public Costs of Brownfield Redevelopment
In theory, the social investment costs of brownfield redevelopment should be the minimum amount of funding to make the private NPV equal to zero. In the real world, governments allocate the funding based on the direct costs of brownfield redevelopment, which may differ from the optimal level of funding.
The real public costs of a brownfield project are comprised of two parts: various sources of public funds that a brownfield project received and the social costs of the redeveloped property. The first one is straightforward and easy to measure. A redeveloped property may increase the demand for infrastructure and create traffic, noises, and new
environmental problems. Considering the complexity of measuring the second part of costs, I only derive public costs of a brownfield project by adding the public funds invested in the project.
3.4.3 Measuring Public Benefits of Brownfield Redevelopment
Benefits are relatively controversial and difficult to measure, because many of them cannot be directly observed in the market. In this study, I use hedonic models to measure the public benefits of brownfield redevelopment and focus on local residents’ benefits.
3.4.3.1 Composition of Public Benefits
Brownfield redevelopment returns to the society with green space conservation, health and environmental benefits, and control of urban sprawl.
Green Space Conservation
Brownfield redevelopment mitigates the development pressure on greenfields and preserves agricultural and natural habitats. One acre of a reclaimed brownfield saves 4.5 acres of green space (White House Council on Environmental Quality 2004). The monetary values of green space saving may be of different values at different locations, based upon the willingness-to-pay for green space. Analysts generally use contingent valuation (CV) to measure the willingness to pay for environmental goods.
Health Benefits
Remediation/redevelopment reduces health risks posed by contaminants to the community and the workers in the impact region. An analyst can measure the health benefits, using either the real costs of health risks or the costs of clean-up (Hamilton and Viscusi 1999). The first method is ideal, but it is scientifically controversial to translate environmental risks to the number of deaths or diseases averted; and ethically controversial to translate the averted health risks into monetary values. The remediation cost data are easier to identify, but the costs can not reflect the real environmental and health risks.
Other Benefits
Brownfield redevelopment encourages compact urban development and controls urban sprawl. It can reduce commuting costs, including the direct cost of commuting and the externality associated with travel (e.g. congestion, emission, noise, safety, and accidents) (Sousa 2002).
3.4.3.2 Alternative Categorization of Benefits and Measurement
It is difficult and time-consuming to calculate the various public benefits illustrated above. In this study, I employ an alternative way to categorize and measure public benefits. Based on the recipients, I categorize the public benefits of brownfield redevelopment into three types, i.e., the benefits for local residents, local business, and the general public. Local residents benefit from improved views and environmental and health risks reduction. Local businesses gain the increased revenues and their employees enjoy
health and aesthetic benefits from brownfield redevelopment. The general public receives the benefits from green-space saving.
Local residents’ benefits can be observed from the neighborhood housing appreciation,
because local residents would like to pay more for improved neighborhood due to brownfield redevelopment. I use hedonic models to measure the housing-price appreciation associated with brownfield redevelopment.
Local businesses’ benefits can be calculated in a similar way, but the hedonic model
should build on commercial properties to reflect increased revenues and on wages to reflect increased attractiveness of working place. Due to data constraints, I do not include these benefits.
The general public’s benefits can be measured by contingent valuation (CV), which
builds on the survey and questionnaires to estimate people’s willingness to pay. I do not include CV, because of the limitation of resources.
To sum up, I include all the public brownfield funds, such as tax credits, grants, low or no interest loans, etc., in social investment costs. These funds can be seen as the public investment on brownfield redevelopment. I only take into account the local residents’ benefits in public benefits, due to the constraints of data and resources. I intentionally exclude some benefits associated with brownfield redevelopment that do not exist from the social perspective, such as tax and job creation.
3.5 Hedonic Model
In this study, as noted earlier, I use hedonic models to measure neighborhood housing price appreciation due to brownfield redevelopment, which represents local residents’ benefits from brownfield cleanup and redevelopment. The social benefit-cost analysis is the core part of this study, and the measurement of public benefits is the key of the benefit-cost analysis. Hence, I detail the hedonic model methodology and steps in a separate part.
3.5.1 The Principles of Using Hedonic Model
Many scholars use the hedonic model to identify the distance-related effects of hazardous sites on housing prices (e.g. Kiel and Zabel 2001). Housing prices can be estimated by structural, neighborhood characteristics, inflation and other factors. By controlling all the independent variables except for the variable of distance to a brownfield, I can measure the price appreciation due to brownfield cleanup and redevelopment.
I measure the housing-price appreciation associated with brownfield cleanup and redevelopment as the discounted value of future environmental, aesthetic, and health benefits. Local residents factor the annual costs, such as health risks, aesthetic disamenity, and environmental risks, by discounting them into present values when they evaluate a house purchase close to a brownfield. My hypothesis is that a brownfield has negative impacts on local residents so that the price-distance slope is positive, reflecting the local resident’s willingness to pay for living farther away from the brownfield,
and brownfield redevelopment will lower the price-distance slope, because it provides local residents with health, environmental, and aesthetic benefits (or reduction of health, environmental, aesthetic costs). .
3.5.2 Data Sources
I will use the following data for completing the case studies: (1) Sale transaction data. The Warren Group (2006) provides single-family house sale transaction data, which include the addresses of houses, sale prices, year of built, year of sold, number of bathroom and bedroom, living area, lot size, property tax, and types of structure. I do not include neighborhood characteristics, because the research areas I delineate are generally within a 0.5-mile radius. I assume that neighborhood characteristics are homogenous in the area. (2) Map of the impact area for each brownfield. Based on the address of a brownfield, I identify the impact region (study area). From my interviews with residents and urban planners in the area, I have found that a 0.5 to 1 mile radius generally covers the impact area. (3) The years that brownfields are abandoned, remediated, and redeveloped. These dates are vintage years for the impacts of housing values, and I use them to identify the time range to match available sales-transaction data. (4) General background information on the brownfield sites and neighborhoods. Background information includes aerial photos, site history, redevelopment project background, census data, etc. I use all the information to help understand the neighborhood and impacts of cleanup and redevelopment.
3.5.3 Model Specification
The hedonic model depicts the relationship between property values and housing characteristics, as expressed in the following formula:
Ln (Price) = f (X1i, X2i, …, Xni) ………. (3.1)
where Ln(Price) is the natural logarithm of the sale price of the house and X series variables are explanatory variables representing housing characteristics. They include structural variables, inflation index, and distance variables. Below is a list of independent variables used for hedonic models.
distance: distance from transaction address to the brownfield in meters; dist_sq: the square of distance to brownfield;
Lotsize: lot size in 1000 sq feet; Liv_sf: living area in 1000 sq feet; bedroom: number of bedrooms; bathroom: number of bath rooms; age: age of house in years;
style_X: dummy variables for house styles, such as Cape Cod, colonial, ranch, raised ranch, garrison and bungalow;
3.5.4 The Process of Model Building
I conduct the basic process of hedonic model building in four steps.
Step1: Data Collection
First, I interview urban planners, visit the site, and obtain related redevelopment/remediation data. I obtain housing sale transaction data within the impact region ranging from 3-5 years before remediation announcement date to 3-5 years after redevelopment completion date, provided by The Warren Group. In this study, I focus on the neighborhood with a high concentration of single-families, which makes the models easier to build.
Step2: Data Clean and Preliminary Analysis
The second step is to prepare for regression analyses, including eliminating outliers, calculating the distances, examining the distribution of each variable, and deciding the formats of the variable (original or dummy, linear or quadratic).
I calculate Age by subtracting the year built from the year sold. I transform year sold into a category variable, reflecting annual housing-price inflation in the area. When I transform Styles into category variables, I exclude the category with the largest number of observations.
I select the data period to cover a span from at least 3 years before remediation or immediately after abandon year to 3 years after remediation. My purpose is to accumulate enough data to capture price impacts. I use ArcGIS to calculate the
distances from single-family houses in the impact region to the brownfield. First, I geocode all the house addresses by U.S. Streetmap, and then use proximity analysis in ArcGIS software to calculate the straight-line distances between each house to the brownfield.
I also use ArcGIS, US Street Map, and image files to analyze the topography and determine the appropriate impact region, which I designate by a certain radius from the brownfield site. To simplify the model, I usually select housing transaction data in the same town as the brownfield in order to save the neighborhood variables. By considering local residents’ perception of environmental risks, topography, and transportation convenience, I determine a radius for each case. For example, I do not consider housing transactions isolated from a brownfield by natural/artificial barriers, such as lakes, mountains, railroads, and highways. Generally speaking, more people perceive the risks from brownfields with visible pollution, good publicity, and good accessibility. I also use statistical analyses to test the impact region.
I examine correlations between independent variables to prevent the collinearity problem by excluding one of two variables with high correlations. Besides selecting the independent variable, I decide which of the following formats to use for these variables, linear or quadratic, and dummy or quantitative variable. For example, the relationship between lot size and natural logarithm of the price is better depicted in quadratic rather than linear form. In this case, I need to add both lot size and the square of lot size in the formula.