Boundary Layer Ingesting Inlet Design for a Silent Aircraft
by
Patrick N. Freuler
Submitted to the Department of Aeronautics and Astronautics in partial fulfillment of the requirements for the degree of
MASTER OF SCIENCE IN AERONAUTICS AND ASTRONAUTICS
at theMASSACHUSETTS INSTITUTE OF TECHNOLOGY
February 2005@2005 Massachusetts Institute of Technology. All rights reserved.
The author hereby grants to MIT permission to reproduce and distribute publicly paper and electronic copies of this thesis document in whole or in part, and to grant others the right to do so.
Author
Department of Aeronautics and Astronautics December 20t1h, 2004
Certified by_
(I
Certified by_
Professor Wesley Harris
Professor of Aeronautics and Astronautics
Thesis Supervisor
- Professor Edward M. Greitzer
1.N. Slater Professor of Aeronautics and Astronautics
Thesis Supervisor Certified by_ A A Accepted by
-MACHU--'sINrIUE1
OF TECHNOLOGYFEB
10
2005
Professor Mark Drela Professor of Aeronautics and Astronautics Thesis Supervisor
Professor Jaime Peraire Professor of Aeronautics and Astronautics Chair, Committee on Graduate Students
I # .1
Boundary Layer Ingesting Inlet Design
for a Silent Aircraft
by
Patrick N. Freuler
Submitted to the Department of Aeronautics and Astronautics on December 20th, 2004, in partial fulfillment of the
requirements for the degree of
Master of Science in Aeronautics and Astronautics
Abstract
Engine cycle trade studies were conducted to determine how a propulsion system should be integrated with an airframe of a "Silent Aircraft", i.e. an aircraft designed with noise as the first consideration. Embedded, boundary layer ingesting, ultra-high bypass ratio engines were found to be the most appropriate
configuration.
Based on the results of the study, inlets for twelve, eight and four engine configurations were designed and assessed. The inlets ranged from standard S-ducts to unconventional mail-slotted inlets. Circumferential pressure distortion and pressure recovery were used as figures of merit and were determined from 3D Navier-Stokes simulations. Four and eight engine inlet configurations were found that met the target criteria. The former had the lowest distortion level, a result of lower boundary layer thickness to inlet height ratios (8/H~0.3). The eight-engine inlets ingested more of the boundary layer, implying a lower wake momentum deficit from the airframe and thus a potential for fuel burn savings of up to 3% compared to a non-boundary layer ingesting engine.
The results of the computations have led to the development of some general guidelines for these types of inlets. The most important parameters are L/D, centerline offset (which has a large impact on boundary layer growth), and inlet throat to fan area ratio. The last variable determines the external compression and the diffusion inside the duct. There is a trade between the reduction of loss and distortion level in that higher fan face Mach numbers increase the former but reduce the latter. The control of peaks in the duct Mach number is essential in reducing friction losses.
For the airframe examined, the parameter regime of best performance has inlets integrated under a common nacelle, L/D ratios between 2.5 and 3.0, fan face to throat area ratios above 1.06, and offsets lower than
11%. Curvature ahead of the inlet should be avoided as well as bifurcations inside the duct. Inlet
performance with an evolved version of the airframe decreased, mainly due to a thicker boundary layer. Although further tailoring of the geometry is needed, the above guidelines should provide both direction and rationale for these alterations.
Thesis Supervisors: Professor Wesley Harris Professor Edward Greitzer Professor Mark Drela
Acknowledgments
I would like to thank Prof. Harris and Prof. Drela for the advice and creative approaches
to the challenges of this project, which led to many fruitful discussions. I want to express my appreciation to Prof. Greitzer for guidance by asking the right questions, for creating a constructive working atmosphere and for setting a lasting, inspiring example on how to think about engineering. Seeing these individuals represent the engineering spirit is one of the most valuable life lessons I gained from MIT.
I would like to thank the SAI research teams at Cambridge University and MIT for
establishing a unique multicultural learning environment.
I gratefully acknowledge the support from the Aeronautics and Astronautics Department
at MIT and the Cambridge-MIT Institute (www.cambridge-mit.org), which allowed this research.
My years at MIT were possible because of the support from my parents Gisela and Nick
Contents
Abstract ... 3
A cknow ledgm ents...5
Contents...7
List of Figures ... 9
List of Tables...11
Nom enclature ... 13
1 Introduction... 15
1.1 M otivation for Aircraft N oise Reduction ... 15
1.2 The Silent Aircraft Initiative (SAI)... 15
1.3 Propulsion and Airframe Integration: The Engine Taskforce ... 16
1.3.1 Engine Integration Taskforce Approach... 16
1.3.2 Performance Considerations: Podded versus Embedded... 18
1.3.3 Key Taskforce Results and Next Design Implication... 24
1.4 Objectives... 25
1.4.1 Success Criteria ... 25
1.4.2 Other Guidelines... 28
1.5 Scope of Research and Thesis Overview ... 28
1.6 Contributions ... 29
2 Background and Tools... 30
2.1 Em bedded Inlet Design Studies ... 30
2.2 Relevant Theory ... 32
2.2.1 Duct Design ... 32
2.2.2 W ake Ingestion... 36
2.3 CFD Capabilities ... 44
3 Approach... 45
3.1 Breaking Up the Problem ... 45
3.2 Range of Param eters Exam ined... 48
4 Four Engine Configurations ... 50
4.1 D esign Decisions and Specifications... 50
4.2 Sim ulation Results and Discussion ... 52
5 Eight Engine Configurations... 60
5.1 Inlet v2.1... 60
5.1.1 Design D ecisions and Specifications... 60
5.1.2 Sim ulation Results and Discussion... 61
5.2 Inlet v2.2...63
5.2.1 D esign D ecisions and Specifications... 63
5.2.2 Sim ulation Results and Discussion... 65
5.3 Inlet v2.3... 69
5.3.1 Design D ecisions and Specifications... 69
5.3.2 Sim ulation Results and Discussion... 70
5.4 Sum m ary ... 73
6 Tw elve Engine Configurations... 75
6.1 D esign D ecisions and Specifications... 75
6.2 Sim ulation Results and Discussion ... 77
6.3 Sum m ary ... 79
7 Considerations for SAX03... 80
7.1 Inlet Perform ance ... 80
7.2 Possible Corrective M easures... 82
8 Sum m ary, Conclusion and Future W ork... 83
8.1 Sum m ary and Conclusions... 83
8.2 Future W ork ... 84
9 R eferences...85
Appendix 1: D erivation of Relationships... 87
List of Figures
Figure 1-1: Initial Silent Aircraft Initiative research components [1] ... 15
Figure 1-2: Average noise contributions of current turbofan propelled aircraft [5]... 17
Figure 1-3: Percent SFC change vs. inlet pressure recovery (Note: does not include ingestion b en efits)...20
Figure 1-4: Fan face total pressure contours and the 600 wedge...21
Figure 1-5: Parallel compressor prediction of distortion transfer for the NASA CR2519 Quiet Engine Program [5]... 22
Figure 1-6: Polytropic efficiency vs. core mass flow [15]... 24
Figure 1-7: Operating -line net thrust vs. fuel burn at various inlet pressure ratios ... 26
Figure 1-8: Computational domain with relevant total pressures ... 27
Figure 1-9: (a) Variation of surge margin in undistorted airflow, (b) surge margin loss vs. fan pressure ratio ... 2 8 Figure 2-1: Sketch of W ellborn's S-duct [16]... 30
Figure 2-2: External and internal diffusion process adapted from Seddon [25]... 33
Figure 2-3: Nozzle / diffuser area-Mach isentropic relationship ... 33
Figure 2-4: Critical area ratio Ast/AT for pre-entry separation [24]... 34
Figure 2-5: Nacelle lip for different flow conditions: a) SLTO, b) cruise... 36
Figure 2-6: a/b definition (a), excerpt from SAI four engine inlet lip (b)... 36
Figure 2-7: Propulsor disk with boundary layer ingestion [28]... 38
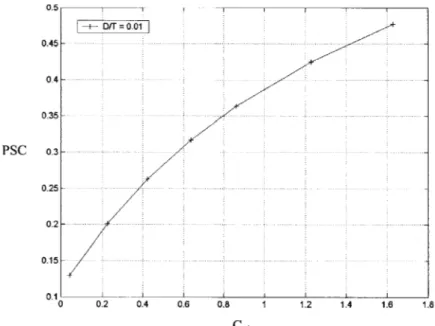
Figure 2-8: PSC versus thrust loading CTh=(Vj,2 / V02) -1 for D/T = 0.01 ... 40
Figure 2-9: Propulsive efficiency vs. CTh for different amounts of ingested drag... 41
Figure 2-10: Aircraft system a) without BLI engine b) with BLI engine ... 42
Figure 2-11: Wetted area in contact with propulsive streamtube [33]... 43
Figure 3-1: 3-D and top view of the SAXOI airframe ... 45
Figure 3-2: SAI airfram e evolution [31]... 46
Figure 3-3: Centerline Mach number contours (interval: 0.04) for a clean SAX01 airframe... 46
Figure 3-4: Computational domain of inlet study... 47
Figure 3-5: Airframe bounds on inlet integration [5] ... 48
Figure 4-1: Nacelle design evolution; Mach number contours of duct centersection... 51
Figure 4-2: Mesh of v1.2 (a), scale drawings of Geometries vl.1 (b.1), vl.2 (b.2) ... 52
Figure 4-3: Mach contours (interval: 0.03) for inlet Geometry vi.1 ... 52
Figure 4-4: a) Centersection and b) fanface PT/PTo contours (interval: 0.01) for inlet v1.1 ... 53
Figure 4-5: a) Mach number and b) PT/PToo contours on centersection for Geometry vi.2 (intervals: 0.02, 0.008 resp.) ... 54
Figure 4-6: Cp for pre-entry retardation region from domain inlet to duct throat ... 55
Figure 4-7: Mach number contours at nacelle lip of Geometry vI.1... 55
Figure 4-8: Fan face mass flow and Mach number versus APi/qi for Geometry vl.2... 57
Figure 4-9: Distortion versus pressure recovery for Geometries vi. 1 and v.2 ... 58
Figure 4-10: Sample Mach contour plot of complete configuration vi.2 ... 58
Figure 5-1: Grid of Geom etry v2.1... 60
Figure 5-2: PT/ PTo contours for a) Geometry vl.2 and b) Geometry v2.1 (interval: 0.008)... 62
Figure 5-3: 6/Hiniet vs. distortion (DC60) for Geometry vl.2 ... 63
Figure 5-4: Grid of final Geometry v2.2 and scale drawing... 64
Figure 5-5: a) Mach and b) PT/PT, contours (interval: 0.04, 0.012 resp.) for inlet v2.2... 65
Figure 5-7: Geometry v2.2 innermost duct a) area ratio, Mach number, Cp b) entropy rise
(T.AS/u02) and nst vs. x/LDuct---. - - - --... 68
Figure 5-8: Cp contours of the throat Region... 68
Figure 5-9: a) Bifurcation, b) evolution of duct area and resulting Cp for v2.3... 69
Figure 5-10: Grid of final geometry v2.3 and scale drawing... 70
Figure 5-11: a) Mach and b) PT/PTO contours (interval: 0.025, 0.01 resp.) for inlet v2.3... 71
Figure 5-12: Geometry v2.3 innermost duct a) area ratio, Mach number, Cp b) entropy rise (TOASo/uo 2) and ist vs. x/LDuct---...
72
Figure 5-13: a) Boundary layer profile (Y/DFan vs. PT/PTr) at the fan face (interval: 0.005), b) PT/PTrO contours at the fan face for v2.2 and v2.3... 73
Figure 6-1: Detail of throat bifurcation region ... 75
Figure 6-2: Mach contour of early twelve-engine design... 76
Figure 6-3: Grid of final Geometry v3.1 and scale drawing...76
Figure 6-4: Mach number (a) and PT/PTo (b) contours for Geometry v3.1 (interval: 0.03, 0.011 resp .)...7 7 Figure 6-5: Geometry v3.1 innermost duct a) area ratio, Mach number, Cp b) entropy rise (TOASO/uo 2) and
nst vs.
x/LDuct---... 78Figure 7-1: 3-D and top view of SAX03 ... 80
Figure 7-2: SAX03 Mach contours on centerline for M, = 0.8 (interval: 0.025)... 80
Figure 7-3: Geometry v1.2 total pressure ratio contours (PT/PTc') for a) SAXO1 and b) SAX03 (intervals: 0.008, 0.013 resp.)... 81
List of Tables
Table 1-1: Preliminary engine design parameters [5]... 18
Table 1-2: Difference in performance relative to two podded engines [5]... 24
Table 2-1: Estimated inlet span, thrust requirement and fuel savings ... 44
Table 4-1: Duct design specifications for four-engine S-ducts... 50
Table 4-2: Results for Geometries v.1.1 and v1.2 ... 56
Table 5-1: Results for Geometry v2.1 ... 61
Table 5-2: Design specifications for Geometry v2.2... 64
Table 5-3: Results for Geometry v2.2 ... 68
Table 5-4: Design specifications for Geometry v2.3 ... 70
Table 5-5: Results for Geometry v2.3 ... 73
Table 6-1: Design specifications for Geometry v3.1 ... 76
Table 6-2: Results for Geometry v3.1 ... 79
Nomenclature
BLI Boundary Layer Ingestion
BWB Blended Wing Body
CFD Computational Fluid Dynamics
CMI Cambridge MIT Institute
DC60 Circumferential Distortion Index
EIT Engine Integration Taskforce
SAI Silent Aircraft Initiative
SFC Specific Fuel Consumption
SPL Sound Pressure Level
AF Fan Area
Ast Area of Inlet Streamtube at the Domain Entrance
AT Throat Area
D Fan Diameter
Hiniet Inlet Throat Height
L Axial Duct Length
MT Throat Mach Number
MF Fan Mach Number
Mst Mach number of Inlet Streamtube at the Domain Entrance
PToo, Free Stream Total Pressure
8 Boundary Layer Thickness
6 Boundary Layer Displacement Thickness
71st Pressure Recovery Based on Inlet Streamtube Total Pressure at Domain Entrance
RT Pressure Recovery Based on the Inlet Throat
71", Pressure Recovery Based on the Freestream
1
Introduction
1.1 Motivation for Aircraft Noise Reduction
Due to a sharp rise in the demand for air-traffic over the last decades, airports serving profitable markets have expanded significantly [1]. The simultaneous growth of communities in the vicinity of airports however, has introduced increasingly strict noise regulations, involving curfews, fines, operating restrictions and quotas [2]. These have been a main inhibitor for air-traffic growth: new airports and runways cannot be built due to public fears of increased noise. Airlines, especially those that operate at night, face scheduling and equipment constraints [3].
As a consequence, the idea of a "silent aircraft" has emerged, i.e. an aircraft whose noise contribution outside the airfield perimeter is less than the general noise environment of a well-populated area [1]. This type of vehicle is to be contrasted with approaches to noise control, which are component-based and yield much smaller, incremental reductions. In particular an aircraft designed from the initiation with noise as its prime target may be able to provide the necessary noise reduction to enable expansion in air transportation.
1.2 The Silent Aircraft Initiative (SAI)
The Silent Aircraft Initiative (SAI), supported by the Cambridge-MIT Institute (CMI), is a response to the above needs. Silent is defined in this context as "sufficiently quiet such that outside the airport perimeter, aircraft noise is less than the background noise in a well populated area" [4]. The project proposal for the silent concept vehicle initially involved five tightly coupled research components as depicted in Figure 1-1.
Optimizd Siiecraft 3 Silent
operations Airframe
Acoustic
... _ _.._ -- -- Integration 4 Airline |Silent
Economics 'Engine
Regional,1. Mission Requirements
2. Aircraft Performance and Noise Sources economics 3. Aerodynamic Performance
... ... 4. Engine Performance
The silent airframe component explores possibilities of generating quiet drag and lift, whereas the silent engine component focuses on alternative low noise engine cycle concepts. Both building blocks feed into the silent aircraft design and integration module, which provides an integration framework for conceptual aircraft design. The operations module receives performance data from regular and unconventional silent aircraft, and produces noise reduction operating procedures. The economics module looks at both the regional and national impact of a silent aircraft, as well as the benefits to airlines.
1.3 Propulsion and Airframe Integration: The Engine Taskforce
After discussions between the full team of MIT and Cambridge University researchers in January 2004, it was recognized that the issue of effectively integrating the propulsion system with the airframe had not been addressed. Shortly thereafter an "Engine Integration Taskforce"
(EIT) was established that had the objective of investigating whether the propulsive system of the
silent aircraft should be embedded or podded, i.e. physically separated from the aircraft. Because the EIT's results had a major influence on the chapters of this thesis, an in-depth description of the taskforce's approach and results is discussed next.
1.3.1 Engine Integration Taskforce Approach
The EIT's approach to address the question of podding or embedding the engines was to gather published information, consult industry experts and perform appropriate calculations (kept simple due to time constraints). A key metric was the relationship between the change in overall perceived noise to the change in direct operating cost (DOC) [5]. For example if a particular embedded configuration yields the same SPL as the podded case but incurs lower direct operating costs, it would be the favorable choice. The main indicator for DOC within the Engine Integration Taskforce was thrust specific fuel consumption (SFC).
As seen in Figure 1-2, the airframe is the dominant noise source at approach. At take-off most of the aircraft noise is due to the engine, particularly the jet and fan. It was thus of interest to the EIT to define and quantify the necessary engine parameters such that the noise target at take-off could be met.
110 Engine noise 105 Engine noise 100 95 EPN dB 90 so 75
8I
70j
6sLAPPROACH TAKE OFF
Figure 1-2: Average noise contributions of current turbofan propelled aircraft [51
The silent aircraft airframe will be a highly integrated aircraft, an example of which is the Boeing Blended Wing Body (BWB) [5]. At the time of the Taskforce, the SAI specific vehicle was not yet developed. The existing aircraft whose requirements were most similar in terms of range and passenger load is the Boeing 767. Aircraft and engine design parameters, such as maximum take-off mass and cruise altitude, as well as engine overall pressure ratios, efficiencies and the turbine inlet temperature, were thus picked with reference to the 767 to establish a first estimate of the overall performance of the system.
Two design points were chosen, the peak jet noise condition, i.e. the point during take-off where the thrust requirement of the engines is the highest, and top of climb. At the former point, engine noise is mainly due to the jet. Lighthill's relationship, which scales the jet noise with velocity to the 8h power, calls for lower exhaust velocities. If the same thrust levels are to be kept at take-off, lower jet velocities imply larger exhaust areas. For a first estimate, the EIT was only concerned with the jet noise source.
Given the aircraft specifications a noise optimized thrust profile and takeoff path was established, involving a cut-back of the climb angle from 6* to 3* right before the airport boundary. Stone's Jet Noise Module developed at NASA [7] (which predicts jet noise to be mainly a function of jet velocity and area) was used to estimate the exhaust area for take-off thrust profile and noise requirements to be met. The necessary total jet area, 10m2
, was used as input for the engine simulator GasTurb [8]. Using 767 engine parameters (as stated above), a bypass ratio of 36 at take-off and a fan pressure ratio of 1.2 before cut-back were calculated as being necessary. For a two-engine configuration, this would imply a fan diameter of
approximately 2.7m. The top of climb cycle was based on the assumption that the same fan diameter and high efficiencies as the peak jet noise point are maintained. The cruise engine would require a bypass ratio of approximately 24 to maintain the thrust required for level flight. The
simulation results are illustrated in Table 1-1.
Peak Jet TOC
Noise Point
Input parameters
Engine pressure ratio 40 40
Turbine inlet temperature 1800 K 1675 K
Fan efficiency 95% 95%
Compressor efficiency 90% 90%
Turbine efficiencies 95% 95%
Jet area (per engine) 5 m" 3.4 mz
Output parameters
Bypass Ratio 36 24
Fan pressure ratio 1.2 1.4
Fan diameter 2.7 m 2.7 m
Jet velocity 190 m/s 310 m/s
Gross thrust 200 kN 130 kN
Overall engine efficiency 34 % 52 %
Table 1-1: Preliminary engine design parameters [5]
With this engine cycle requirement, the performance implications for a podded and embedded propulsion system were assessed.
1.3.2 Performance Considerations: Podded versus Embedded
The EIT's aim was to identify trends and set up bounds on the design space. Given the time constraints, one podded and two embedded engine configurations were assessed. The latter represented the minimum and maximum number of engines that could meet the geometry constraints of the airframe and corresponded to two and 15 engines. The performance implications for these three configurations are discussed next.
Boundary Layer Ingestion and Drag Effects
An implication of an embedded configuration is the ingestion of the boundary layer. This can have several effects on the performance and operability of the overall propulsion system, a primary one being a lower mass averaged stagnation pressure at the inlet lip, due to the losses that have occurred in the boundary layer. On the other hand, the ingestion of the wake momentum
deficit implies lower fuel bum rates. The impact of these two effects on the SFC was quantified within the EIT and is discussed next.
For the taskforce, the impacts of lower pressure recoveries on the engine cycle were estimated by the procedure outlined by Hanlon [9] and Pilczer [10], which illustrates trends in the thermal and propulsive efficiencies of the system with inlet recovery. The model assumes an "effective" inlet that spans the entire portion of the airframe ahead of the duct throat. The pressure ratio of this "inlet" thus includes the entropy rise due to the natural development of the boundary layer over the airframe. Given a fixed fan pressure ratio, the lower inlet recovery will have a negative impact on the thermal efficiency of the system, because the same work input yields a lower overall pressure level at the fan exit. The relationship between the thermal compressor efficiency and pressure recovery is shown in the following set of equations, which are derived in Appendix A. ad ad T4
1
I c,BLI 7 t T s s 1±ad + Tr4 _ ToThe adiabatic compressor efficiency with ingestion is
ad B Lad ad
77c, BLI = (1.2)7
with
7'I
(1.3)
(y -1)
On the other hand, the propulsive efficiency is improved, since the reduced inlet pressure ratio leads to smaller jet velocities. In other words, the total aircraft resistance is overcome with a smaller increase in the kinetic energy. The classical definition of propulsive efficiency is given by
= 2vo , (1.4)
(Ve + v0)
with v, and ve the velocities far upstream and at exit. The downstream velocity was calculated using Bernoulli's relationship by assuming a rotor pressure ratio r .From
P p 2 (1.5)
T 2
After the EIT's conclusion, it was noted that pressure ratios should not have been mixed with incompressible relations.
the exit velocity ve is computed.
ve= ;rj,0,Po -P] . (1.6)
The overall efficiency of the system is given by the product of the thermal and propulsive efficiencies and the specific fuel consumption (SFC) is proportional to its inverse. Therefore
SFC oc 1 - (1.7)
17th 7P
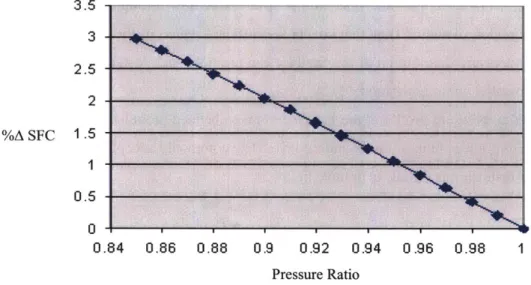
As the pressure recovery decreases, the overall engine efficiency and SFC decay. Figure
1-3 shows this trend for the SAI engine cycle. For a worst-case scenario pressure recovery of 0.9,
there is a 2 % increase in the SFC for embedding the engine.
3.5 3 2.5 2 %A SFC 1 .5 0.5 0 0.84 0.86 0.88 0.9 0.92 0.94 0.96 0.98 1 Pressure Ratio
Figure 1-3: Percent SFC change vs. inlet pressure recovery (Note: does not include ingestion benefits)
This however does not take into account the fact that part of the momentum defect of the airframe wake is ingested. The ingestion of the wake momentum deficit by the engines, has an additional, beneficial effect on fuel bum. A control volume analysis shows that a boundary layer ingesting configuration generates less drag than if the engines are physically separated from the aircraft. The lower drag leads to lower thrust requirements. Therefore the same engine cycle as in the podded case experiences a smaller fuel burn rate to propel the aircraft. Configurations with multiple small engines will cover a higher percentage of the span and ingest more boundary layer, thus yielding higher propulsive benefits.
Embedded engines were also expected to generate less nacelle drag than the podded case, because the support structure is removed and the large fan areas are not directly exposed to the freestream. In the case of multiple engines, it was assumed that smaller fan diameters would allow a deeper integration with the airframe and hence be more drag efficient. Using an estimated CD, the difference in nacelle drag between the three inlet installations could be calculated.
The nacelle drag and ingestion effects were then used as inputs to a simple model of engine performance with ingestion [11], which will not be outlined here. The analysis showed that the two and 15 engines could achieve an SFC improvement of 7.7% and 14.2% respectively, compared to the podded system.
Engine Stability
Compressors exhibit two types of fluid dynamic instabilities: surge and rotating stall. The former is characterized by periodic fluctuations of the mass flow through the compressor, while the latter is a region of stalled flow that covers a significant region of the circumference. A non-uniform total pressure distribution at the fan face can promote such instability effects, as can be shown via a parallel compressor model [12].
The total pressure profile at the fan face of an embedded propulsion system will be uniform, due to the ingestion of the boundary layer. The commonly accepted measure of the non-uniformity or distortion is DC60, as defined below.
DC60q = Avg360 Min60 (1.8)
qAvg360
PAgs6o and qAvg36o are the area averaged total and dynamic pressures over the whole fan face
area, PMino is the minimum area averaged total pressure over any 600 wedge around the center of
the fan face, as illustrated in Figure 1-4.
60*
The parallel compressor model implemented for the EIT required the numerical data of the entire SAI fan compressor map, which at that time could not be generated. Therefore the fan data of an existing low noise engine with similar pressure ratios, outlined in NASA CR2519 [13], was taken to establish trends. Superimposing the parallel compressor results yields the fan map for four different levels of distortion, illustrated in Figure 1-5.
0 1.5 1.4 1.3 1.2 1.1 1' 0.1 .5 0.6 C 1.1 Q=mv (C T)/Apo
Figure 1-5: Parallelcompressor prediction of distortion transfer for the NASA CR2519 Quiet Engine Program [51
Figure 1-5 indicates that as the distortion levels go up, the surge line undergoes a downward shift and the speed lines become shallower. Consequently, for a given speed line, an increase in distortion implies a drop in pressure ratio and peak efficiency, as well as surge margin. While the NASA CR2519 engine had a higher design fan pressure ratio (1.5) than the SAI fan, these plots can be used to estimate trends in surge margin due to distortion. At take-off the SAI fan operates at a pressure ratio of 1.2, equivalent to the operating point on the 70% speed line. Using the following definition for surge margin:
(1.9)
where the corrected mass flow is
SM =I- (P2 /POi )OpLine QSurge
(I02 P )Surge QOpLine
thcPT0 1
no distortion would imply a surge margin of 30%. For a DC60 of 24%, the surge margin would drop down to 5%, significantly below current industry levels. A surge margin of 10% could be obtained if the fan spool speed is increased to 80%, while maintaining the same pressure ratio. However this would imply a 10% drop in efficiency. In addition, the unsteady blade loading during each cycle is intensified, so a stronger, but heavier fan is needed, which will add to the overall engine weight. The aggregated effect of the efficiency drop and the higher low-spool weight on the SFC was estimated to be an increase of 5.7% from the non-BLI case.
For simplicity, the same DC60 value was assumed for all engine configurations. In reality, distortion will be more severe for multiple engines with smaller fan diameters, since a higher proportion of boundary layer flow is ingested.
Other Performance and Noise Considerations
Making the engines smaller can have several positive impacts on the overall performance, due to higher thrust to weight ratios, shorter spool up times and lower noise levels. An additional factor is that by embedding the engines, the support structure is removed, which usually makes up 20-30% of the total podded engine weight.
The increase in the thrust to weight ratio with smaller engine size is in large part because of the "square-cube" law. The thrust, T, scales with the mass flow, hence L2, while the weight is
related to the volume, which varies with L'. A linear increase in T/W is expected for decreasing length scales, however in reality this relationship is less pronounced, since the weight of hollow parts and bearings do not scale as fast. A rule of thumb, according to Freeman [14], is that engine weight increases with L2.. Coupling these findings with a regression analysis by Protz [15], allowed an estimate of the weight behavior with engine scale. This could then be used to compute the benefits in fuel consumption, since for a given engine, less thrust is required to lift a lighter aircraft. From the engine cycle and aircraft characteristics, a 0.92% drop in SFC per 1000kg weight reduction was estimated. This implies a 0.6% and 1.7% improvement in SFC for the two
-and 15 embedded engine cases respectively, compared with the podded configuration.
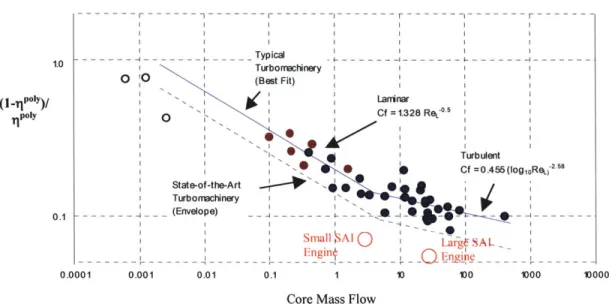
As engines go to smaller scales, a worsening of the compressor polytropic efficiency is observed. Because the system operates at lower Reynolds numbers, it has higher viscous losses. Further, the tip clearance gap with respect to the fan diameter increases, also promoting loss. Smaller blade geometries may be less accurate, due to a comparatively larger size of current manufacturing tools. To estimate the Reynolds number effects, Protz's [15] regression study, as pictured in Figure 1-6, was used. The modified best-fit, state of the art envelope and the results of the two-engine cycle simulations gave an estimate of the efficiency drop of a smaller engine. The
plot indicates a decrease of 1.7 percentage points polytropic efficiency, or equivalently a 2.2% worsening in the SFC, if the propulsion system shifts from two to 15 engines.
Gas Turbine Compressor Efficiency vs. Size
r 0 '0 -I Typical Turboachnery (Best Fit) State-of-the-Art Turbomachinery (Envelope) 0.0001 0.001 0.01 0 . 0.1 I I I I Lam Cf= -u I 10@ I g-Small AI
Q
Engin II --- 4- - - - -4 -- - -nar 1.328 ReC05 I Turbulent Cf =0.455 (log,0Re 2 . 5 8 Larg SAL 10 I)0 1000Core Mass Flow
Figure 1-6: Polytropic efficiency vs. core mass flow [151
Decreasing engine scale could also have an additional benefit on the overall noise levels of the engine, because acoustic liners seemed to gain in effectiveness. An analysis of the overall fan noise for the podded and the two embedded configurations with liners was performed. The 15 engine "lined" configuration was 15dBA quieter than its two-engine counterparts, where much of the attenuation was done on the rearward propagating fan noise.
1.3.3 Key Taskforce Results and Next Design Implication
The findings of the Engine Integration Taskforce are shown below in Table 1-2, which give the change in SFC of the embedded configurations with respect to the podded case.
Sources of ASFC ASFC 2 embedded ASFC 15 embedded
Wake Ingestion and Drag - 7.7 % - 14.2 %
Distortion and Inlet Recovery + 7.7 % + 7.7 %
Weight -0.6% -1.7%
Reynolds Number 0 % + 2.2 %
ASFC - total -0.6% -6.0%
Table 1-2: Difference in performance relative to two podded engines [5]
1.0
(,,Poly)/ 1poly
0.1
The taskforce concluded that the best configuration would be between two and 15 embedded engines. However the SAI engine requirements and boundary layer ingestion (BLI) come with important design implications that need to be addressed.
The unconventional nature of the engine cycle calls for variable cycle concepts, because the thrust requirement at cruise demands a lower bypass ratio (BPR) of approximately 24. One way the BPR can be varied is with ejectors, or by using one core to drive multiple fans. The exhaust jet velocities can be further controlled by using variable area nozzles. The placement of an embedded system also takes up volume currently assigned to important control surfaces; an assessment of "jet-flaps" as a potential substitute should thus be performed.
The issue of effectively integrating the propulsion system with the airframe and determining the optimum number of engines was another question raised by the taskforce. It was recommended that a more detailed study of potential inlets, with respect to internal and external aerodynamic performance, should be done. Such a study is the main topic of this thesis.
1.4
Objectives
The objective of this research study is to design a set of feasible BLI intake configurations that meet the SAI engine requirements in terms of pressure recovery and inlet distortion. The intakes will include four, eight and twelve engine configurations, thus allowing an exploration of the design space bounded by the results of the taskforce. With the external aerodynamic performance as a guideline, the study should allow the selection of a candidate inlet for an initial audit.
1.4.1 Success Criteria
Pressure Recovery
As mentioned in Section 1.3.2 and further outlined in Section 2.2.2, the airframe region ahead of the duct throat over which the boundary layer develops, can be approximated as an extension of the actual intake. This "equivalent" inlet will have a lower pressure recovery than an isolated inlet at the actual inlet entrance due to the naturally developing boundary layer. On the other hand, an engine which is sized for the podded case will have to produce less thrust due to the ingested wake momentum deficit. It is assumed here that the same engine simply operates on a lower point on the operating line and hence burns less fuel.
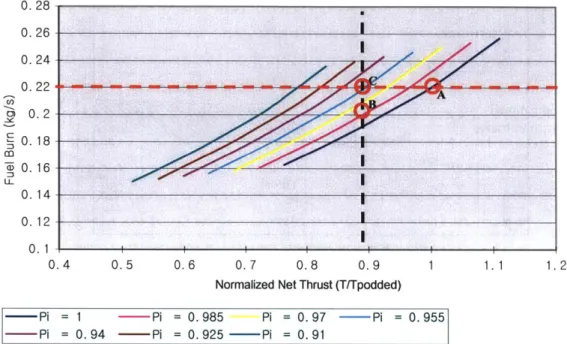
For a four-engine configuration, Figure 1-7 depicts the compressor operating line by plotting the fuel burn rate as a function of net thrust, normalized by the podded engine design
thrust (T/TPodded). Several operating lines for different inlet recoveries (Pi) are shown. The ideal podded case is given by 'A' on the Pi = 1 curve. As will be outlined in Section 2.2.2, the wake-ingesting engine will operate at 89% of the original podded engine thrust output, shown by the dashed black line. The horizontal dashed line reflects the SAI fuel burn target for the four-engine case. 0.28 0.26 0.24 0.22 0) 0.2 0. 18 0 0. 16 UN 0. 14 0. 12 0. 1 I 0.4 0.5 0.6 0.7 0.8 0.9 1 1. 1 1.2
Normalized Net Thrust (TlTpodded)
- Pi = 1 - Pi = 0. 985 Pi = 0. 97 - Pi = 0. 955 - Pi = 0. 94 -- Pi = 0. 925 -- Pi = 0. 91
Figure 1-7: Operating -line net thrust vs. fuel burn at various inlet pressure ratios
From the clean airframe simulation described in Section 3.1, the mass averaged pressure recovery integrated over the inlet area of the streamtube entering the duct was approximately
0.983. This value represents the pressure recovery of the "effective" inlet due to the airframe
boundary layer and corresponds to point 'B' on the vertical dashed curve.
The limiting pressure recovery needed for the SAI fuel burn target is 0.955, depicted by point "C". Consequently, the losses due to the presence of the inlet cannot be larger than 0.955/0.983 = 0.971. Estimates for the eight and twelve engine configurations by the same
method predict limiting pressure recoveries of 0.967 and 0.965 respectively.
Note that being at a lower point on the operating line implies a lowering in the compressor efficiency. Ideally the engines should be resized for the lower thrust requirement. However for a first estimate of the acceptable recovery ranges, this analysis was deemed sufficient. For the sake of simplicity, some other factors were also not accounted for, such as the potential improvements in the nacelle drag with decreasing engine scale and the fact that smaller
engines would have lower efficiencies due to higher boundary layer thickness to inlet height ratios.
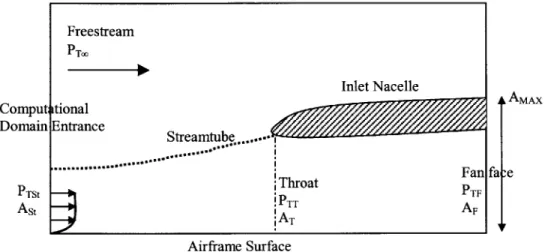
A figure of merit is the fan face total pressure normalized by the conditions at the start of
the inlet streamtube entering the computational domain. As depicted by PTF/PTSt (it will be referred to as nst from now on) in Figure 1-8, this quantity includes the airframe boundary layer and the compression region upstream of the inlet lip.
Freestream
ComputInlet Nacelle AMAX
Domain Entrance Streamtube...-A
... Fna
PTSThroat
At ,ATPTT A
Airframe Surface
Figure 1-8: Computational domain with relevant total pressures
Distortion
The feasibility criteria on distortion was set at the EIT value of DC60 = 24%, as derived in Section 1.3.2. While this target was set throughout the design study, it was possible to extract a
fan map from the GasTurb simulations at a later stage. This new fan map represents a more
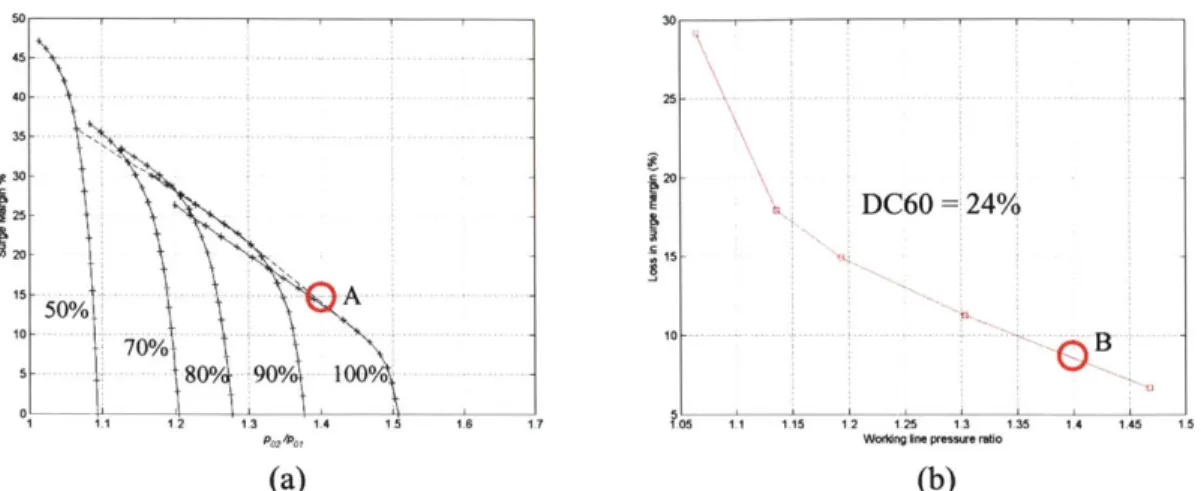
realistic scenario since it reflects an engine with the design pressure ratio of 1.4 at cruise, as opposed to the design pressure ratio of 1.5 of the fan map in the EIT. The map is based on an existing fan rotor ([8], "Journal of Propulsion, 1992 Page 200"), scaled to the characteristics of the EIT engine cycle. Using the EIT's parallel compressor model [5], Figure 1-9 was obtained, which shows the surge margin for an undistorted ("clean") flow field and the loss in surge margin due to distortion as a function of fan pressure ratio.
45 40- 25-3 5 -. . .. .. . .. . . . .. 12- [DC60 = 24% C3 25-15 15-15% 70% A1 5 800/ 901/ 0000 1 1.1 12 1.3 1.4 1.g 1.6 13 405 1.1 1.15 1'2 12 1'3 13 5 1.4 145 1,5
PM *b, Woddng In. preso, mho
(a) (b)
Figure 1-9: (a) Variation of surge margin in undistorted airflow, (b) surge margin loss vs. fan pressure ratio
The design point (fan pressure ratio = 1.4, spool speed = 100%) is denoted by point 'A'
on plot (a), implying 14% surge margin. On plot (b), the EIT distortion target of 24% leads to a loss in surge margin of approximately 8.5% (point 'B'). The surge margin would thus shrink to
5.5% due to the distorted flow field. Therefore, in retrospect the distortion target should have been set lower to yield more reasonable surge margins.
1.4.2 Other Guidelines
An additional factor that affects the decision process is the total entropy generated by the entire inlet structure, i.e. internal and external, which ultimately gives a measure of the lost work or drag. This requires an assessment of the mass flux of entropy at each plane of the computational domain where flow is either entering or leaving. It will be given as follows
AS
=
spv-dA , (1.11)j
where 'n' are the number of planes, A; is the
j'h
plane, and s is the mass flux of entropy. Further considerations are related to the level of complexity of an inlet, the ability of a geometry to incorporate future variable cycle concepts; such as for example ejectors and the capability for noise shielding. These issues are beyond the scope of this thesis.1.5
Scope of Research and Thesis Overview
This investigation is concerned with the design of potential inlets for the Silent Aircraft Initiative. Four, eight and twelve engine configurations, which span the design space bounded by
the EIT results, are considered. The figures of merit are inlet recovery and DC60 distortion. The focus of the investigation is on feasibility as defined earlier, rather than on finding an optimum design. Intakes are designed based on the results of the March 2004 Engine Taskforce and any evolution in the engine design since then has not been considered. The studies were performed primarily using the then current SAI baseline airframe SAXO 1. As the project progressed, a new airframe SAX03, emerged, for which some of the inlet studies were repeated. The main point of interest is the onset of cruise; other flight conditions, such as take-off and landing were not considered.
Chapter 2 provides an overview of past design studies on embedded inlets and applicable theory, as well as a description of the available flow prediction tools. Chapter 3 explains the general approach, the breakdown of the problem and the range of parameters examined. Chapters 4, 5 and 6 illustrate the design decisions made in the four, eight and twelve engine inlet configurations, followed by a discussion of the results. In Chapter 7, the best performing inlets were exposed to the flight conditions of a more advanced airframe, and further evaluated. Chapter
8 presents conclusions and suggestions for future work.
1.6
Contributions
The contributions of this thesis are:
1. To outline the design process of boundary layer ingesting inlets, by illustrating the trends
between the main duct parameters and performance.
2. To implement the design approach and assess the performance of unconventional, boundary layer ingesting inlets for multiple engine configurations
3. To establish a first feasibility assessment in propulsion and airframe integration within the
2 Background and Tools
There is abundant literature regarding embedded inlets both from the experimental and the computational point of view. Consequently only the most relevant studies are discussed. This section also presents the available Computational Fluid Dynamics (CFD) tools for the performance assessment of a given inlet.
2.1
Embedded Inlet Design Studies
Substantial research, both experimental and computational, on S-duct inlets was done throughout the 1970's and 1980's, a selection of which can be found in the reference section of Wellborn et al. [16]. Wellborn performed an extensive experimental investigation of compressible, subsonic flows in a diffusing S-duct, observing the occurrence of secondary flows. As can be seen from Figure 2-1, aggressive subtended angles (OMax/2) of 300 and L/D ratios of nearly 5 were intentionally picked to force several 3D flow features, including separation.
Plan A Plane B ,R r3 PlaneC Plane D Plane E
Fig. 2 Half shell of the circular diffusing S-duct.
Figure 2-1: Sketch of Wellborn's S-duct [161
As the flow passes through the first bend inside the duct, it is subject to a local centrifugal pressure gradient between the upper and lower walls. The pressure difference causes the boundary layer on the sidewalls to migrate towards the bottom of the duct. A pair of contra-rotating vortices appears in the boundary layer, which then mixes with the core flow. The effect of the second bend on the boundary layer is less pronounced.
From these studies, L/D, offset and geometry of the first bend appear as the most important parameters that determine secondary flows. For the levels of offset examined, separation was the main source of loss in the S-duct.
The design of the Boeing 727 S-duct is described by Ting et al. [17], but the paper provides only limited information on the design decisions. The top and bottom, i.e. 6 and 12 o'clock contours were found to be the most critical. The strongest influence on the pressure distribution is due to the longitudinal curvature and one-dimensional area variation, as opposed to the transversal curvature.
The most extensive studies concerning boundary layer ingesting inlets were done within the BWB design phase by Anabtawi et al ([18], [19], [20]) and by Berrier [21]. In Anabtawi's work, the inlets were S-shaped with a semicircular geometry at the throat. The through-flow areas were developed using a Stratford-like pressure gradient, which assumes a pressure and area distribution at each axial position of the duct such that the boundary layer is on the verge of separation. Applying a similar model to the SAI appeared too aggressive according to Drela [22], since it assumes the verge of separation at each axial position in the duct 2. Nevertheless, the studies gave a good first indication of design parameters, such as length to fan diameter (L/D),
area shape-and size, as well as the S-duct offset. Offset in this case is defined as the height difference between the centroid of the throat and the fan face area, normalized by the axial duct length. Since the test conditions were at low Reynolds and Mach numbers (5* 105 and 0.05 respectively), the distortion and pressure recovery figures are qualitatively only.
Berrier et al. investigated four serpentine inlets under more realistic flight conditions up to Mach 0.83, with boundary layer thicknesses, approximating 35% to 45% of the inlet height. This reflects an operating condition closer to the SAX01 case. L/D ratios of 3 and offsets of approximately 30% were used.
Berrier summarized a series of past studies on curved inlets, showing that S-duct pressure recovery relative to a straight duct is approximately 2% lower for offsets in the 20-25% range. An additional 2% penalty will be incurred if higher boundary layer thicknesses (e.g. S/Hiniet = 0.1 to 0.2) are ingested. The amount ingested in SAX01 is higher than in Berrier's study, thus a first indication of the expected "best case scenario" in terms of duct losses can be obtained. The study considered inlets with semi-circular and semi-elliptical aperture geometries. The latter was used because of potentially more favorable pressure gradients from the upper wall due to less
2 According to Drela, the Stratford distribution was also considered non-optimal; "It does minimize skin
friction, but at the cost of greatly increasing mixing in the outer boundary layer, which results in large pressure drag. Lower overall losses will be given by a less severe adverse pressure gradient, which better balances the wall friction and outer-boundary layer mixing."
aggressive curvatures. However this beneficial effect was offset by the fact that the boundary layer thickness to inlet height was higher. As the test freestream Mach numbers were increased from 0.25 to 0.83, the pressure recovery decreased by 5%, even though the higher Reynolds numbers had a beneficial effect on the formation of secondary flows and general separation. The last two statements show that if the SAI inlets cannot perform adequately, the scenario could be improved by varying the flight conditions.
Studies that were of less relevance involve methods of boundary layer treatment, such as vortex generators, suction and blowing ([17], [18], [23]). While none of these methods are assessed in this thesis, they become an option under the SAX03 flight conditions, where a thicker boundary layer is ingested. There exist also several studies on curved inlet design by employing automatic shape-optimization as seen in Rodriguez [11] and Taskinoglu [24]. In these cases a
CFD package is coupled with an optimizer that, given certain constraint functions, iterates on an
objective function, which usually involves improving distortion and inlet recovery. Since this project is solely concerned with generating feasible, as opposed to optimum geometries, these studies are of limited impact in terms of baseline inlet design. However they show interesting alternatives on how the project could involve in the future.
2.2
Relevant Theory
2.2.1 Duct Design
The procedure of obtaining the duct areas for efficient diffusion is discussed in this section. Some guidelines for external nacelle design will also be presented, however it is important to keep in mind that this study focuses on obtaining adequate values of inlet recovery and distortion and not on external nacelle drag reduction.
Internal Diffusion
The diffusion process occurs over two segments: external and internal. A typical velocity distribution is sketched in Figure 2-2. The external diffusion ahead of the duct is substantial and happens over a short distance, called the pre-entry retardation region.
Wall
Ast, Vst Thibat
D Approach AT, VT AF, VF
- - . .. ... Duct
V
Vr-nr Internal Diffusion
retardation )
Figure 2-2: External and internal diffusion process adapted from Seddon [251
The analysis was initiated by assuming a Mach number at the inlet entry and the engine face. The fan Mach number was taken to be 0.6, which is slightly lower than the results of the
EIT (MF =0.65); the EIT did not account for the large amounts of boundary layer, which in reality would lower the mass averaged fan Mach number. Next, a typical value of 0.72 for the throat (station T) Mach number was picked based on current inlets operating in similar flow regimes [22].
One-dimensional isentropic area-Mach relationships for nozzle and diffuser flows were used to pick internal areas. The area-Mach relation in Figure 2-3 states that the Mach number at any location in the duct depends on the ratio of the local duct area to sonic throat area. For a fan Mach number of 0.6, AF/A* is 1.188 and for a throat Mach number of 0.72 the AT/A* = 1.081.
Hence the area ratio, AF/AT, is
1-099-|A* A M*= I M u*= a*u 2 _ (y+1) (A'2
1
F2
y -1
(r-) = M-[
1+
M 2 (2.1) A * m 2 y+1 2 _Figure 2-3: Nozzle / diffuser area-Mach isentropic relationship
It was important to estimate whether these area ratios would cause any significant effects on the external flow field, such as separation.
External Diffusion
In the presence of a pressure gradient, such as created by an inlet, the boundary layer thickens and distorts in profile. Seddon et al. [25] conducted an experimental investigation of the effect of inlets with different Ast/AT (defined in Figure 2-2) on the external boundary layer entry profile. Boundary layer thickness to inlet height ratios considered were similar to those expected with the SAL. At a low enough area ratio Ast/AT, the imposed pressure gradient on the streamtube can cause the boundary layer to separate.
Gadd [26] derived an approximation of the coefficient of pressure at separation. In his model the separation pressure is that pressure which is just sufficient to bring to rest, without friction, the fluid at the knee of a turbulent velocity profile (the point where the velocity gradient levels off substantially). The expression is thus equivalent of having a boundary layer passing through a sudden pressure jump. Seddon modified this expression to account for a finite pre-entry pressure gradient and boundary layer profiles. Based on wind tunnel experiments, Seddon arrived at an expression relating the critical (Ast/AT)rit ratio that would cause separation to the flow Mach number and boundary layer characteristics. The derivation is lengthy and will not be repeated here. The result is shown in Figure 2-4.
Asymptotic ---- -_T
value 08 8
(Ast/
-30 20 10 0 0.2 0.4 0.6 0.8 1.0 1.2 1.4
iog 6 Crltical flow ratio for pre-entry Separation.
Figure 2-4: Critical area ratio Ast/AT for pre-entry separation [241
To use Figure 2-4, we first find the 'corrected position ratio' J, a quantity that is related to the size of the boundary layer. The evaluation also requires a parameter X, related to the hydraulic
radius of the throat face3. For a four engine SAI intake, if a throat area of AT= 2.56m2
is assumed from the analysis of the previous section, J(X-1) would fall in the range of 18 to 20. Using J we can find the critical area ratio at M=0 from the left hand curve ((Ast/A)crit ~ 0.68). This then allows us to enter the set of curves on the right hand side. Assuming Mst = 0.94 vst= 271 and pst
= 0.321 (these are values from the airframe simulation in Section 3.1), Figure 2-4 predicts that the
boundary layer separates for area ratios ((Ast/AT)crit ) below 0.77. Note that if the boundary layer were less thick (smaller J), it could withstand a higher adverse pressure gradient before separating
and would thus be on a lower (Ast/A)crit curve.
Since the fan mass flow is known, Ast can be calculated independently as
Ast ~ ~2.34m 2
VSt Pst
For the given AT, the area ratio would be about 0.91, acceptably above the critical area ratio.
Nacelle Design
If a fluid particle is subject to a higher degree of external diffusion, its area will increase
more drastically as it approaches the inlet. Kuchemann and Weber [27] used a control volume approach to show that for incompressible flow the excess velocity over the nacelle lip will depend on the ratio of maximum cross sectional inlet area (AMax, seen in Figure 1-8) to throat area (AT).
Also, depending on the shape of the nacelle, there will be a critical Cp at which these streamlines will separate over the lip and cause excessive drag. For the SAI four-engine inlet, with inflow Mach numbers of 0.94 (as will be shown in Section 3.1), most of the external nacelle losses are due to shock induced boundary layer separation and Kuchemann and Weber's approach is not adequate.
Abundant experimental data on lip losses for different geometries and flow conditions can also be found in Seddon [24]. An inlet during static sea level takeoff takes in a streamtube of a flow area much greater than the inlet area. The lip will thus have to be made much thicker to avoid separation on the inside of the duct. For cruise, the area of the ingested streamtube is smaller and there are potentially high excess velocity regions on the outer nacelle lip. The two scenarios are shown in Figure 2-5.
,Engin IFace (a) Overspeed e -IFace (b)
Figure 2-5: Nacelle lip for different flow conditions: a) SLTO, b) cruise
At the high cruise Mach numbers under consideration, the lip should thus be turned inwards and be of a slim elliptical shape to avoid these overspeeds [25]. As will be shown in later simulations, the first feasible SAI inlet design had an ellipse a/b ratio (defined in Figure 2-6) of approximately 2.5.
(a)
Figure 2-6: a/b definition (a), excerpt from SAI four engine inlet lip (b)
2.2.2 Wake Ingestion
This section identifies the drivers for boundary layer growth and separation, and skin friction losses. It also illustrates several ways of looking at the benefits of wake ingestion.
Separation
A boundary layer in a diffusing duct is exposed to adverse pressure gradients, which will
imply upstream pressure forces on a boundary layer fluid element. Flow separation can thus occur especially since the flow is also subject to internal duct curvature. The relationship between the boundary layer momentum thickness and amount of diffusion per unit distance is shown well by EQ i
the von Karman integral relation. We define the boundary layer displacement and momentum thicknesses 6* and 0 as
*=
(1 -dy
, (2.2) f 0 U e 0=I-
U dy . (2.3)The von Karman integral relation with the shape factor H, defined as 8*/0, is given by
dO
r
0
du
- - (H + 2)
d
(2.4)dx pue2 ue dx
This expression indicates that the rate of change of momentum thickness depends on the amount of diffusion done over a non-dimensional distance (/Ude-du/dx). A boundary layer with larger momentum thickness is thus prone to separate earlier for a given inlet. Consequently, for the same amount of diffusion, a twelve-engine inlet will require a higher L/D.
Friction Losses
Shapiro [28] derived a series of influence coefficients for in one-dimensional continuous flows in ducts. These indicate the influence of each independent variable on the relevant dependent parameters such as total pressure and entropy.
For example dPT/PT along a duct (assuming no separation) with no mass flow and heat addition can be expressed as:
dP _ 2
dx
-
- 4f - . (2.5)P 2 D
In Equation 2.5, f is the friction coefficient, M is the Mach number and y is the ratio of specific heats. Equation 2.5 shows how duct Mach number and duct length (L/D) contribute to total pressure loss. It is desired to have the flow in the inlet at a low Mach number, hence external compression should be aimed for. Lower throat Mach numbers also imply smaller diffusion ratios and hence less chance for separation. Equation 2.5 also implies a tradeoff between taking the diffusion over a longer distance to avoid flow separation and keeping the duct length short to limit losses.
Wake Ingestion Benefits
Several models have been established to estimate the benefits of boundary layer ingestion, and a good summary is given in Rodriguez [11]. Two views of the process are discussed in this section to give a basic understanding of the physical mechanisms involved. The first shows there is a lower required shaft power for a given level of thrust, while the second presents the situation in terms of a smaller thrust requirement due to lower overall drag.
The model of Smith [29] uses an actuator disk in incompressible flow, as shown in Figure
2-7.
-- V7
Propulsor Disk
Area.
A
Figure 2-7: Propulsor disk with boundary layer ingestion [28]
The power input to obtain a given thrust for a boundary layer ingesting propulsor disk is compared with one that ingests uniform flow. The assumption is made that the fan efficiency remains unaffected.
If Vj' is the downstream jet exhaust velocity for the non BLI case, the thrust and power
for the non BLI engine can thus be expressed as follows:
T'=(pi 2)A(V' 2 ~
02) (2.6)
1
P,'=-T'(V'+V) (2.7)
2
In the situation where the BLI is ingested, as can be seen from Figure 2-7, the thrust is the sum of the momentum change of the wake and non-wake streams. With V0 being the freestream velocity, Vj the non-wake exhaust, Vw and Vjw the wake velocity at the inlet and exhaust and 6
p
![Figure 1-2: Average noise contributions of current turbofan propelled aircraft [51 The silent aircraft airframe will be a highly integrated aircraft, an example of which is the Boeing Blended Wing Body (BWB) [5]](https://thumb-eu.123doks.com/thumbv2/123doknet/14181670.476386/17.918.274.688.115.403/average-contributions-turbofan-propelled-aircraft-aircraft-airframe-integrated.webp)