For Peer Review Only
EEG modulation by different transcranial direct current stimulation (tDCS) montages: a randomized double-blind sham-control mechanistic pilot trial in healthy participants
Journal: Expert Review of Medical Devices Manuscript ID ERD-2020-ST-0201.R1
Manuscript Type: Original research
For Peer Review Only
AbstractBackground: Based on our Phantom study on transcranial direct current stimulation (tDCS), we
hypothesized that EEG band power and field confinement would be greater following left dorsolateral prefrontal cortex (DLPFC – F3) tDCS using circular vs. rectangular electrodes.
Methods: Double-blind randomized trial comparing tDCS with anode over the left DLPFC
(groups: rectangular electrodes, circular electrodes, sham) and 2 active subgroup references (right shoulder vs. right DLPFC cathodes).
Results: Twenty-four randomized participants were assessed. We indeed found higher average
EEG power spectral density (PSD) across bands for circular vs. rectangular electrodes, largely confined to F3 and there was a significant increase at AF3 for low alpha (p=0.037). Significant differences included: increased PSD in low beta (p=0.024) and theta bands (p=0.021) at F3, and in theta (p=0.036) at FC5 for the right DLPFC vs. shoulder with no coherence changes. We also found PSD differences between active vs. sham tDCS at Fz for alpha (p=0.043), delta (p=0.036), high delta (p=0.030); and at FC1 for alpha (p=0.031), with coherence differences for F3-Fz in beta (p=0.044), theta (p=0.044), delta (p=0.037) and high delta (p=0.009).
Conclusion: This pilot study despite having low statistical power given its small sample size shows that active left DLPFC tDCS modulates EEG frontocentrally and suggests that electrode shapes/reference locations affect its neurophysiological effects, such as increased low alpha power at AF3 using circular vs. rectangular electrodes. Further research with more participants is warranted.
Keywords:
EEG modeling; Healthy participants; Montage;
Randomized clinical trial; tDCS;
Transcranial direct current stimulation. 3 4 5 6 7 8 9 10 11 12 13 14 15 16 17 18 19 20 21 22 23 24 25 26 27 28 29 30 31 32 33 34 35 36 37 38 39 40 41 42 43 44 45 46 47 48 49 50 51 52 53 54 55
For Peer Review Only
1. INTRODUCTION
Transcranial direct current stimulation (tDCS) is a versatile tool that allows for controllable treatment parameters such that by changing the size, number, and position of electrodes, current intensity, session frequency or intervals, one can optimize the results of a specific neurological, psychiatric or mechanistic outcome [1]–[3]. Choosing to combine a well-chosen and carefully timed activity (e.g., physical therapy) with tDCS can also enhance modulation of specific networks [3], [4]. However, selecting the right parameters can be a challenge as trials use heterogeneous parameters, and targeting networks that are not well-localized - such as those involved in cognition - can be particularly difficult in the absence of a stronger mechanistic understanding of neural networks [3]. Computer simulations, while helpful, use oversimplified assumptions for tissue conductivities and do not reflect physiologic functions [5], [6]. We therefore aimed to quantify the effects of different tDCS montages in a phantom head model (Phase I - [7]) that could then be translated to humans (Phase II) to better understand their neurophysiological effects.
1.1 Phase I (realistic phantom head modeling)
In Phase I of this study [7], we developed a 3D head phantom model based on an MRI image stack of a healthy person allowing us to estimate electric current diffusion in tissues of different conductivity. We embedded 18 EEG monitoring electrodes into the model at skull and gray matter tissue layers and compared electric voltage measurements in phantom and computerized models before and after tDCS using different montages: Montage 1 (rectangular electrodes, bilateral DLPFC), Montage 2 (circular electrodes, left primary motor cortex [M1]-right supraorbital) and Montage 3 (circular electrodes, bilateral M1) [7]. We confirmed feasibility of the high-fidelity 3D head phantom model and also found high correlation between computer-simulated and phantom-measured voltages, especially at the brain level. When using the bilateral dorsolateral prefrontal cortex (DLPFC) tDCS montage, the computer-simulated and phantom-measured voltages at the brain and skull layers were similar (except at excitation locations in the skull layer under the tDCS electrodes), and our gray matter electric field and potential distributions were consistent with previous computerized models. Furthermore, the circular tDCS electrodes led to greater electric field confinement in the different layers of the phantom compared to rectangular electrodes, as well as higher voltages at those layers [7].
With a left anode (excitatory electrode) and right cathode (inhibitory or reference electrode), correlation between computer-simulated and phantom-measured voltages in M1, M2 and M3 was better in the brain layer compared to the skull layer (85 vs. 69%, 79 vs. 65% and 88 vs. 63%, i.e., a difference of 16%, 14% and 25% respectively). Notably, the highest simulation-measurement correlation at the brain level appears in bilateral montages (85% and 88% in rectangular/circular DLPFC/M1), rather than left M1-right supraorbital (79%), and the greatest difference between correlation at brain and skull levels was for the circular bilateral M1 montage (25% difference). Unlike a human brain, there is no underlying cytoarchitecture/neurons in different regions of a phantom head model (phantom M1, DLPFC and supraorbital regions should have the same agar microstructure). Therefore, any regional electric differences are due to macroanatomical variations (such as the shape/orientation of phantom brain layer gyri and sulci vs. tDCS rectangular/circular electrodes and the distance between electrodes).
3 4 5 6 7 8 9 10 11 12 13 14 15 16 17 18 19 20 21 22 23 24 25 26 27 28 29 30 31 32 33 34 35 36 37 38 39 40 41 42 43 44 45 46 47 48 49 50 51 52 53 54 55 56
For Peer Review Only
While we cannot measure brain and skull voltage changes following tDCS directly in healthy participants without surgery, we may infer that quantitative EEG (QEEG) analyses at the scalp level could be used to generate computer-simulated voltages at the brain level which would correlate well with true (but unmeasured) brain-level voltage changes following bilateral DLPFC tDCS. In cognitive studies, this montage is often used with rectangular electrodes, however, the phantom study suggests that the circular electrode structure/size leads to higher voltages and greater field confinement than the rectangular structure/size. We can therefore also infer that in humans, greater EEG changes would follow bilateral DLPFC tDCS using circular vs. rectangular electrodes, reflecting the greater field/voltage changes at the brain (and skull) levels. Additionally, as the left M1-right supraorbital montage led to greater voltages than either bilateral DLPFC or bilateral M1 montage in the phantom, we infer that increasing inter-electrode distances by using an extra-cephalic reference will further enhance EEG changes post-tDCS.
1.2 Phase II (current study)
In Phase II of this study, we therefore performed the first exploratory clinical trial in healthy participants. We aimed to compare the physiologic effects of a single session of anodal left DLPFC tDCS using standard rectangular vs. circular electrodes, and also the effects of increasing inter-electrode distances. We therefore aimed to randomize 25 healthy participants into 3 main groups (one sham tDCS group, and 2 anodal tDCS groups using rectangular and circular electrodes) and to also compare different reference electrode locations (right DLPFC vs. right shoulder subgroups) (Figure 1). We hypothesized that the following would lead to greater EEG power and connectivity changes: circular vs. traditional rectangular tDCS electrodes, active vs. sham tDCS, and right shoulder vs. right DLPFC reference.
2. PATIENTS AND METHODS
All procedures were performed at the Spaulding Neuromodulation Center in Boston, MA, in accordance with the Declaration of Helsinski and Partners Institutional Review Board approval. The trial was not required to be registered. All participants provided informed consent for enrollment. See Supplement for eligibility criteria, recruitment methods, and sample size calculation. Right-handed (based on Edinburgh Handedness Inventory (EHI) – Short Form) healthy participants were screened in and assigned to their group.
2.1 Randomization Process Groups
Participants were randomized (by web-based program randomization.com) into Groups 1, 2 and 3 (allocation ratio 2:2:1), with 2 active groups (Groups 1 and 2) subdivided into 2 active subgroups by montage (1:1:1:1:1 ratio). Randomization order was placed into sequentially numbered sealed envelopes by an otherwise uninvolved staff member. Allocation concealment was maintained throughout the study. Blinding was maintained for participants and co-investigators not performing tDCS, including outcome assessors.
Group 1: Standard rectangular electrodes, active tDCS:
Montage 1 (Group 1.1): left DLPFC anode, right shoulder cathode; Montage 2 (Group 1.2): left DLPFC anode, right DLPFC cathode; 3 4 5 6 7 8 9 10 11 12 13 14 15 16 17 18 19 20 21 22 23 24 25 26 27 28 29 30 31 32 33 34 35 36 37 38 39 40 41 42 43 44 45 46 47 48 49 50 51 52 53 54 55
For Peer Review Only
Montage 1 (Group 2.1): left DLPFC anode, right shoulder cathode; Montage 2 (Group 2.2): left DLPFC anode, right DLPFCcathode;
Group 3: Standard rectangular electrodes, sham tDCS:
Left DLPFC anode, right DLPFC cathode.
2.2 Intervention and Assessments
All participants received pre-tDCS EEG, followed by tDCS with online limited EEG, followed by post-tDCS EEG. The EEG cap was removed after the pre-tDCS session and then mounted again for the post-tDCS EEG session (which was done approximately 15 minutes after tDCS ended). Participants washed and blow-dried their hair before and after tDCS (to remove the electrode paste, gel, and saline of EEG and tDCS electrodes before tDCS/EEG).
Transcranial direct current stimulation
We used Starstim 8 (Neuroelectrics®) to deliver tDCS to the scalp via either standard rectangular sponge electrodes (5x7cm) in Group 1 (active) or circular star array electrodes (2.54cm circles arranged in a circle with a 5.08cm diameter) in Group 2 (active). Group 3 (sham) used standard rectangular electrodes. The anode was always placed over the left DLPFC; the reference electrode was placed over the right DLPFC (Subgroups 1.2 and 2.2.) or in an extracephalic position on the right deltoid (Subgroups 1.1 and 2.2) to eliminate its cortical cathodal effects and also to reduce the risk of shunting and increase the vertical current densities [8] by increasing the distance between anode and reference electrode). The left and right DLPFC electrodes were centered over F3 and F4 respectively in the 10/20 International EEG system [9]. TDCS sessions lasted 15 minutes at 2 mA (for active conditions) [10], and the sham method was reliable [11]. The electric current was ramped up to 2 mA, and ramping periods lasted 30 seconds at the beginning and end of the 15-minute sessions for all groups. In between ramping, a 2 mA current was applied to participants allocated to active tDCS, while no current was applied to participants in the sham group. Co-investigators performing tDCS administered the tDCS adverse effects questionnaire (safety outcomes) immediately afterward.
Offline EEG
Pre-tDCS and post-tDCS 32-channel EEG was recorded using Enobio32 (Neuroelectrics®) device at sampling rate 500 Hz; ground and reference electrodes were placed on the right mastoid and ear respectively. EEG was visualized and recorded on NIC 2.0 software with line noise filter enabled at 50 Hz (based on noise levels in the room used for recording) and band filtering at 1 Hz (low cut) and 50 Hz (high cut). EEG was recorded over 12 minutes (6 minutes eyes opened, then 6 minutes eyes closed). Impedances were kept under 10 KOhm.
2.3 EEG analysis
EEGs in the eyes closed state were manually cleaned on MatLab (EEGLab). To analyze by groups, a program was written on Python and a special GUI app developed to automatically process the EEG data and optimize power and connectivity analyses, particularly in the context of a small sample. The multitaper technique was chosen for analysis rather than the pure coherence technique; see Supplementary Figure 1 for an example of results using magnitude squared vs. pure coherence vs. multitaper in a participant; the latter shows higher coherence at the different coherence pairs overall.
3 4 5 6 7 8 9 10 11 12 13 14 15 16 17 18 19 20 21 22 23 24 25 26 27 28 29 30 31 32 33 34 35 36 37 38 39 40 41 42 43 44 45 46 47 48 49 50 51 52 53 54 55 56
For Peer Review Only
EEG data was spliced into 4000 data points per epoch to enhance the frequency resolution. Power spectrum was computed for signal x (Sxx,j): Sxx,j = (2Δ2 / T) XjXj*, indicating the product
of x’s Fourier transform at frequency fj (Xj) with its complex conjugate (Xj*), all scaled by the
squared sampling interval (Δ) and the total duration (T) [12]. Power spectral density (PSD) was calculated in terms of absolute amplitude (μV2/Hz) and relative amplitude (dB) to normalize the
data distribution. Relative amplitude=10*log10 (PSD in μV2/Hz).
Selected EEG frequency bands were: alpha (7.9-13 Hz), beta (12.9-30.1 Hz), theta (3.9-8 Hz), delta (0.9-4 Hz); bands of interest were divided into low alpha (7.9-10 Hz), high alpha (10-13 Hz), low beta (12.9-20 Hz), high beta (19.9-30.1 Hz), and high delta (2-4 Hz). We considered that low delta and high beta would be less reliable due to likely contamination with artifacts. Pairwise coherence was performed for the left DLPFC (F3) with its surrounding electrodes, i.e., the following electrode pairs: F3-AF3, F3-Fz, F3-FC1, F3-FC5.
While preferable to magnitude squared coherence, the Fast Fourier Transform (periodogram) still uses limited data length per epoch and is thus not ideal for PSD estimation, nor for the coherence values computed upon PSD. Indeed, it introduced large variances/artifacts in our data that could negatively impact our post- pre-tDCS data analysis. Therefore, to reduce variance in our PSD we enhanced our methodology by using a modified multitaper method [13], which uses a robust estimator as substitution for the mean across EEG segments. Where large intermittent outliers might exist, such as in a small sample size, this method can enhance human EEG PSD estimates and reduce the effects of outliers and artifacts, while maintaining the same power spectral resolution (i.e. it distinguishes the different wavelengths of the spectrum just as well as the periodogram) [14]. We show a comparison of PSD estimation by 3 methods: periodogram vs. Welch’s vs. multitaper methods in one participant (Supplemental Figure 2).
2.4 Statistical analysis
Stata 16.0 (StataCorp LLC) was used for all statistical analyses. Demographic data and adverse effects were reported using central tendency and dispersion measurements based on variable type (i.e., mean and SD for continuous variables, number and percentage for categorical variables); Shapiro-Wilk test, skewness, and kurtosis were used to demonstrate normality. For between-group comparisons (5 subbetween-groups), Kruskal-Wallis and Fisher exact test were used for continuous (not-normal) and categorical variables respectively.
Missing post-tDCS EEG data was imputed with pre-tDCS data and vice versa (last observation carried forward and vice versa); if both were missing, an average of the rectangular or circular electrode group (or sham) pre- and post-data was imputed in. The main EEG analysis was on delta post-pre changes (i.e., post-tDCS values minus pre-tDCS values) for power and coherence analyses in all frequency bands. Intention-to-treat analyses (ITT) thus include delta post-pre values equaling zero due to imputation; complete case analyses (CCA) exclude EEGs with missing data for that electrode (PSD) or coherence pair. Normality was tested by Shapiro-Wilk test and visualized on histogram; normally distributed data was tested by two-sample t-test, and not-normal data was tested by Wilcoxon rank-sum test comparing active vs. sham, rectangular vs. circular, and right shoulder vs. right DLPFC groups/subgroups separately. Bootstrap method with Fisher’s z-transformation was used to estimate median percentile differences and 95% 3 4 5 6 7 8 9 10 11 12 13 14 15 16 17 18 19 20 21 22 23 24 25 26 27 28 29 30 31 32 33 34 35 36 37 38 39 40 41 42 43 44 45 46 47 48 49 50 51 52 53 54 55
For Peer Review Only
confidence limits for Wilcoxon testing. Considering PSD’s 5 electrode locations and 9 frequency bands/sub-bands, Bonferroni corrections [15] were set at a threshold of 0.05/45, thus p<0.0011 was the adjusted alpha p<0.05 for PSD data. Considering the 4 electrode coherence pairs and 9 frequency bands, Bonferroni corrections were set at a threshold of 0.05/36, thus p<0.0014 was the adjusted alpha p<0.05. for coherence data.
3. RESULTS 3.1 Population
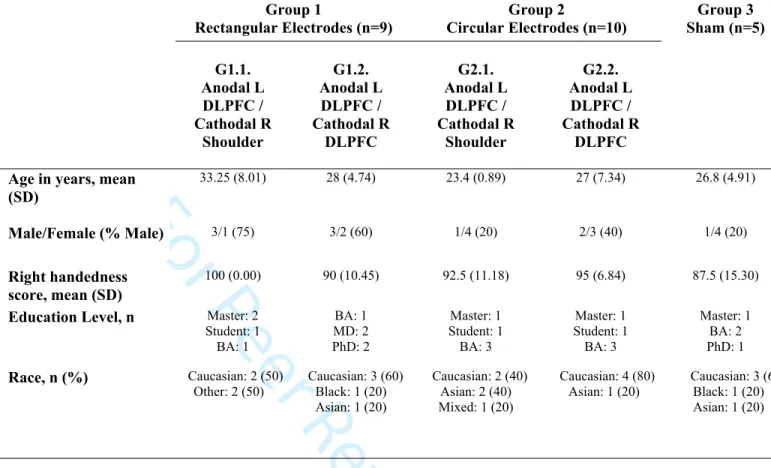
Of 25 pre-screen eligible participants consented, one was screened out after consenting due to mixed handedness (Figure 1);24 randomized participants (10 male, 14 female) completed all stimulation and assessment sessions at 100% adherence. There were no demographic differences between groups at baseline (Table 1).
[INSERT FIGURE 1 HERE] [INSERT TABLE 1 HERE]
3.2 Adverse effects
All participants (n=24) tolerated tDCS sessions well. The majority reported mild-to-moderate symptoms of burning, tingling, or itching sensations, and some reported sleepiness, or presented with skin redness under the electrode area (Table 2), with no differences between
groups/subgroups. No unexpected or severe adverse effects were observed or reported. [INSERT TABLE 2 HERE]
3.3 EEG results
A) Post-pre EEG difference between-group comparisons
On using Bonferroni correction (adjusted p>0.05), there were no significant differences on any between-group comparisons for post-pre PSD or coherence measures on intention-to-treat (ITT) or complete case (CCA) analyses. The statistically significant uncorrected values (p<0.05) are reported below; see Supplement for details.
I) Post-pre PSD for all bands at F3, AF3, Fz, FC1 and FC5 electrodes: Post-pre PSD (ITT):
Active (Groups 1+2) vs. sham (Group 3):
Differences for: AF3 (n=24) high delta (median 0.88, 95% CI: 0.11, 3.05; p=0.019); Fz (n=24) alpha (median -1.35, 95% CI: -2.65, -0.10; p=0.043), delta (median 0.65, 95% CI: 0.06, 1.72; p=0.036) and high delta (median 0.98, 95% CI: 0.09, 2.42; p=0.030); FC1 (n=24) alpha (median -1.46, 95% CI: -3.29, -0.23; p=0.025); FC5 (n=24) high alpha (mean -2.09, 95% CI: -4.16, -0.02; p=0.048).
Electrodes: rectangular (Group 1) vs. Circular (Group 2):
No differences.
Reference: right shoulder (G1.1+2.1) vs. right DLPFC (G1.2+2.2):
3 4 5 6 7 8 9 10 11 12 13 14 15 16 17 18 19 20 21 22 23 24 25 26 27 28 29 30 31 32 33 34 35 36 37 38 39 40 41 42 43 44 45 46 47 48 49 50 51 52 53 54 55 56
For Peer Review Only
Differences for low beta (median -0.65, 95% CI: -1.67, -0.08; p=0.034) and theta (median -0.87, 95% CI: -1.52, -0.13; p=0.028) at F3 (n=19).
Baseline PSD ITT analyses were mostly negative and unrelated to the above results except for a difference between active and sham high delta (p=0.008) at AF3.
Missing PSD data:
At AF3 a third or more of the active group/subgroup data is missing, and at FC5, nearly a third of the circular electrode data is missing, limiting PSD ITT validity at those locations/groups (Supplementary Table 1).
Post-pre PSD (CCA):
Active (Groups 1+2) vs. sham (Group 3):
Differences at Fz (n=24) for alpha (median -1.35, 95% CI: -2.65, -0.10; p=0.043), delta (median 0.65, 95% CI: 0.06, 1.72; p=0.036) and high delta (median 0.98, 95% CI: 0.09, 2.42; p=0.030); and at FC1 (n=23) for alpha (median -1.46, 95% CI: -3.29, -0.23; p=0.031).
Electrodes: rectangular (Group 1) vs. Circular (Group 2):
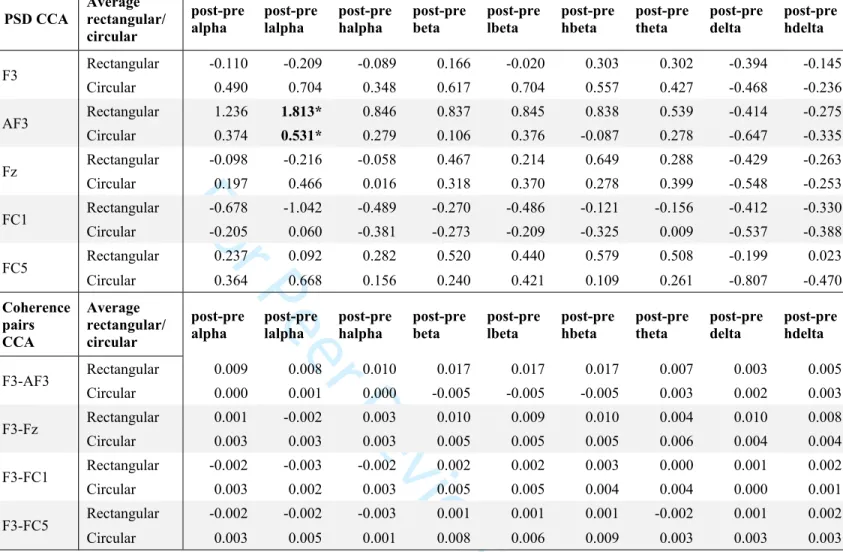
Difference at AF3 (n=12) for low alpha (median 1.12, 95% CI: 0.01, 2.76; p=0.037).
Reference: right shoulder (G1.1+2.1) vs. right DLPFC (G1.2+2.2):
Differences at F3 (n=18) for theta (mean -1.00, 95% CI: -1.83, -0.18; p=0.021) and low beta (median -0.80, 95% CI: -1.70, -0.10; p=0.024) and at FC5 (n=16) for theta (median -1.02, 95% CI: -1.88, -0.08; p=0.036).
II) Post-pre pairwise coherence for all bands at F3-AF3, F3-Fz, F3-FC1 and F3-FC5: Post-pre coherence (ITT)
Active (Groups 1+2) vs. sham (Group 3):
Differences for F3-Fz (n=24) delta (median 0.01, 95% CI: 0.00, 0.04; p=0.036) and high delta (median 0.01; 95% CI: 0.01, 0.04; p=0.008), and for F3-FC1 (n=24) beta (median 0.01, 95% CI: 0.00, 0.04; p=0.043).
Electrodes: rectangular (Group 1) vs. Circular (Group 2):
No differences.
Reference: right shoulder (G1.1+2.1) vs. right DLPFC (G1.2+2.2):
No differences.
Missing coherence data:
At F3-AF3 40% or more of the active group data is missing; at F3-FC5 over a fifth of active group and nearly a third of circular and right DLPFC subgroup data are missing, limiting ITT validity in those coherence pairs (Supplementary Table 2).
Post-pre coherence (CCA)
Active (Groups 1+2) vs. sham (Group 3):
Differences for F3-Fz (n=23) in beta (median 0.01, 95% CI: 0.00, 0.06; p=0.044), theta (median 0.01, 95% CI: 0.00, 0.02; p=0.044), delta (median 0.01, 95% CI: 0.00, 0.04; p=0.037) and high delta (median 0.01, 95% CI: 0.01, 0.05; p=0.009).
Electrodes: rectangular (Group 1) vs. Circular (Group 2):
No differences. 3 4 5 6 7 8 9 10 11 12 13 14 15 16 17 18 19 20 21 22 23 24 25 26 27 28 29 30 31 32 33 34 35 36 37 38 39 40 41 42 43 44 45 46 47 48 49 50 51 52 53 54 55
For Peer Review Only
Reference: right shoulder (G1.1+2.1) vs. right DLPFC (G1.2+2.2):
No differences.
Average PSD and coherence post-pre values for each group (CCA) are listed in Tables 3-5 and Figures 2-4 below.
[INSERT TABLE 3 AND FIGURE 2 HERE] [INSERT TABLE 4 AND FIGURE 3 HERE] [INSERT TABLE 5 AND FIGURE 4 HERE]
4. DISCUSSION
Based on the phantom study, we had hypothesized that circular electrodes (Group 2) would lead to higher PSD and greater field confinement (more focal) than rectangular traditional electrodes (Group 1). At the left DLPFC (F3) we did indeed find higher average PSD across bands for the circular vs. rectangular electrodes, largely confined to F3, but these results were not significant. An increase in low alpha PSD at AF3 in the rectangular rather than circular electrodes was the only significant finding (Table 4, Figure 3), and is highlighted in a contour map comparing average PSD changes at low alpha between Groups 1 and 2 (Figure 5).
[INSERT FIGURE 5 HERE]
As to the reference location, we had hypothesized that increasing electrode distance by placing using a right shoulder reference would enhance modulation. There was indeed a significant PSD difference at F3 for low beta and theta bands, and at FC5 for theta, but the increased PSD values were in the right DLPFC group, and coherence changes were nonsignificant (Table 5, Figure 4). When comparing average PSD differences in the active tDCS subgroups at F3 and Fz (which had the highest voltages in the phantom study), it does seem that electrode shape and reference location together alter PSD modulation (Supplementary Figure 3).
Meanwhile, there was a more prominent signal on comparing active vs. sham tDCS groups, with significant PSD differences on alpha/high alpha bands and delta/high delta bands in more
frontocentral regions. Notably, there seemed to be some desynchronization (decreased PSD) on average delta/high delta activity almost universally across sham and active groups and subgroups (Figures 2-4). The change was significant at Fz between active and sham groups, and F3-Fz functional connectivity also significantly decreased at delta bands in the sham group while increasing in the active group. This small (less than 1%) decrease in slow wave activity might reflect a subclinical marker of increased wakefulness due to participants having to wash then blowdry their hair twice before the post-tDCS EEGs. Active tDCS can have sleepiness as a side effect [16], [17], but there were no differences reported clinically between groups on sleepiness or other measures on the tDCS adverse effects questionnaire. The decrease in slow wave activity may alternatively relate to study parameters, as effects in the opposite direction have been seen frontocentrally when using different tDCS and EEG protocols, [18] etc. Overall, multiple reports
3 4 5 6 7 8 9 10 11 12 13 14 15 16 17 18 19 20 21 22 23 24 25 26 27 28 29 30 31 32 33 34 35 36 37 38 39 40 41 42 43 44 45 46 47 48 49 50 51 52 53 54 55 56
For Peer Review Only
have shown that tDCS over the frontal regions can change brain network dynamics, especially with repeated sessions; e.g., Ferrucci et al. [19] found that following anodal tDCS over the frontotemporal cortex in frontotemporal dementia, cognitive and behavioral improvements correlated with decreased power of slow wave activity. Using graph-theory measures, Vecchio et al. found dynamic network fluctuations following prefrontal tDCS (using smaller active
electrodes), showing significant changes in small world organization in young adults and older volunteers following active (anodal/cathodal) tDCS compared to sham, such as small world increases in alpha and decreases in delta and theta frequencies [20].
Our findings showed that alpha PSD significantly increased frontocentrally in the sham group, and theta and beta F3-Fz coherence significantly increased in the active group while decreasing in sham. On average, active tDCS seemed to increase connectivity around the left DLPFC while sham tDCS seemed to decrease it. Meanwhile, bilateral temporo-parietal anodal tDCS in
probable Alzheimer’s disease patients showed increased low-frequency EEG coherences in the fronto-antero-temporal and temporo-parieto-occipital regions correlating with cognitive
performance; the latter region also showed increased high-frequency coherences correlating with increased blood nitric oxide levels [21], demonstrating the potential biological correlates of functional connectivity as measured by EEG. In another study, active tDCS alleviated tinnitus and this negatively correlated with baseline EEG high-frequency band power (eyes open mainly, and at specific electrodes) [22]. Recently, bilateral fronto-parietal tDCS in severely brain injured patients with prolonged disorders of consciousness showed no behavioral effects after one session; however, they did find a treatment effect on Lempel-Ziv-Welch complexity in the theta and delta bands (LZW) showcasing tDCS’ neurophysiological effects even in the absence of behavioral changes in challenging populations [23]. The LZW algorithm has been previously correlated with sleep and levels of consciousness and is considered to depict the “randomness” and integrity of neural signals and connectivity respectively [23]–[28]. Finally, one study used 44 participants’ individual MRI-based models (and the finite-element method) to compare different tDCS electrode sizes and configurations; they confirmed that a smaller electrode size can increase electric field focality, but also increases inter-subject variability in electric fields [29]. Indeed, such variability may have impacted our findings.
It is important to highlight again that such studies tend to use different tDCS and EEG
parameters, including different EEG references, that sample sizes are small and that outcomes are often exploratory. However, the combination of findings supports the conceptual premise that active tDCS modulates brain activity as reflected by EEG, which may correlate with clinical outcomes, and that different electrode shapes, sizes and reference locations influence tDCS’ neurophysiological effects.
In our study, the changes were all quite modest and did not hold up to correction for multiple hypothesis testing. However, this may be due to lack of power because of the small sample as well as the fact that one tDCS session is unlikely to have dramatic effects on healthy
participants’ EEGs [18], [30]. We know that a small percentage of tDCS electric current applied to the scalp reaches the brain’s gray matter, e.g., a previous simulation study [1] found that standard bilateral rectangular electrodes on DLPFC at 1 mA led to a current density of 2.9 mA/cm2, and at the cortex the maximum cortical current density was 0.77 mA/cm2. The small
amount of current reaching the cortex tends to modulate brain activity over time and repeated 3 4 5 6 7 8 9 10 11 12 13 14 15 16 17 18 19 20 21 22 23 24 25 26 27 28 29 30 31 32 33 34 35 36 37 38 39 40 41 42 43 44 45 46 47 48 49 50 51 52 53 54 55
For Peer Review Only
sessions, so we would expect greater changes in patient populations with more frequent sessions in future studies, where the sample size can be better estimated using our preliminary data. Thus far, some of our findings are in line with the phantom study and may help guide necessary larger more definitive studies in the future.
4.1 Limitations
The main limitation of this study is the small sample size, large number of groups/subgroups, and large number of electrodes/electrode coherence pairs for EEG comparisons, which reduces study power and increases the risk of type I error when testing multiple hypotheses without correction. However, this is a common limitation of exploratory mechanistic studies, and we believe the multitaper method helped optimize our findings in this small sample.
Another limitation of EEG studies is that coherence at all frequencies can be artificially raised by volume conduction (rather than brain source coherence) for electrodes less than 10 cm apart [31]. In our study, even when using the large cap, the distance from F3 to its surrounding electrodes was smaller (e.g., 3 cm to AF3, 5.5 cm to Fz). We expect that post-pre tDCS changes would relate more to cortical source coherence, but volume conduction can certainly contribute. Source analysis with the help of imaging studies would reduce some of these confounding effects, but would be much more costly, and more appropriate for a later stage.
Finally, as there were 5 frequency sub-bands (e.g., low alpha, high alpha, etc.) which were not independent of the 4 main bands (alpha to delta), and as the active group was inclusive of different electrode shapes and montages, these overlaps in electrodes/montages and frequency bands cannot be treated as independent groups, limiting the effectiveness of the Bonferroni correction or implying that it is overly conservative.
4.2 Future vision
Our phantom study showed high correlation between computed simulated and directly measured voltages in the phantom brain, with the most optimal correlations at the brain level being in the bilateral DLPFC montages using circular (88% correlation) and rectangular (85%) electrodes. It would be very helpful to predict tDCS effects in the brain using scalp EEGs as we cannot measure brain cortical changes directly most patient populations (a process that would require surgery). We may infer that EEG analyses at the scalp level could be used to generate computer-simulated values at the brain level which would correlate well with true (but unmeasured) brain-level changes following tDCS. Our data can help design future EEG studies with source analysis, which would greatly enhance the value of such QEEG-generated predictions. EEG signals
primarily reflect cortical postsynaptic potentials which become projected to the scalp after being filtered through the skull and other tissues. The small remaining signal undergoes the signal conditioning components of electroencephalographs, e.g., differential amplifier, high and low pass filters. Radial dipoles are much more efficient than otherwise similar tangential dipoles in generating EEG signals at the scalp [32] so the signal picked up at F3 vs. Fz or other locations may not be quite comparable to one another (unlike electrodes embedded in a phantom brain). However, source analysis based on individual patients’ brain imaging and EEGs could greatly enhance the usefulness of our model to predict cortical changes following different tDCS electrode shapes/montages (as well as other interventions) in patients with neurological and psychiatric disorders. This approach may be validated by directly measuring cortical changes in 3 4 5 6 7 8 9 10 11 12 13 14 15 16 17 18 19 20 21 22 23 24 25 26 27 28 29 30 31 32 33 34 35 36 37 38 39 40 41 42 43 44 45 46 47 48 49 50 51 52 53 54 55 56
For Peer Review Only
patients who do need surgery using implanted electrodes, and comparing the results to simulated scalp QEEG models
5. CONCLUSIONS
This pilot study despite having low statistical power given its small sample size shows that active left DLPFC tDCS modulates EEG frontocentrally and suggests that electrode shapes/reference locations affect its neurophysiological effects, such as increased low alpha power at AF3 using circular vs. rectangular electrodes. Further research with more participants is warranted.
3 4 5 6 7 8 9 10 11 12 13 14 15 16 17 18 19 20 21 22 23 24 25 26 27 28 29 30 31 32 33 34 35 36 37 38 39 40 41 42 43 44 45 46 47 48 49 50 51 52 53 54 55
For Peer Review Only
REFERENCES[1] T. Wagner, F. Fregni, S. Fecteau, A. Grodzinsky, M. Zahn, and A. Pascual-Leone, “Transcranial direct current stimulation: a computer-based human model study.,”
Neuroimage, vol. 35, no. 3, pp. 1113–24, Apr. 2007.
[2] M. M. El-Hagrassy, F. Jones, G. Rosa, and F. Fregni, CNS non-invasive brain stimulation. 2018.
[3] F. Fregni et al., “Evidence-based guidelines and secondary meta-analysis for the use of transcranial direct current stimulation (tDCS) in neurological and psychiatric disorders,”
Int. J. Neuropsychopharmacol., Jul. 2020.
[4] G. Kronberg, A. Rahman, M. Sharma, M. Bikson, and L. C. Parra, “Direct current stimulation boosts hebbian plasticity in vitro,” Brain Stimul., vol. 13, no. 2, pp. 287–301, Mar. 2020.
[5] I. Laakso, S. Tanaka, M. Mikkonen, S. Koyama, N. Sadato, and A. Hirata, “Electric fields of motor and frontal tDCS in a standard brain space: A computer simulation study.,”
Neuroimage, vol. 137, pp. 140–151, Aug. 2016.
[6] G. B. Saturnino, A. Antunes, and A. Thielscher, “On the importance of electrode
parameters for shaping electric field patterns generated by tDCS.,” Neuroimage, vol. 120, pp. 25–35, Oct. 2015.
[7] L. Morales-Quezada, M. M. El-Hagrassy, B. Costa, R. A. McKinley, P. Lv, and F. Fregni, “Transcranial Direct Current Stimulation Optimization – From Physics-Based Computer Simulations to High-Fidelity Head Phantom Fabrication and Measurements,” Front. Hum.
Neurosci., vol. 13, Oct. 2019.
[8] G. M. Noetscher, J. Yanamadala, S. N. Makarov, and A. Pascual-Leone, “Comparison of cephalic and extracephalic montages for transcranial direct current stimulation-a
numerical study,” IEEE Trans. Biomed. Eng., vol. 61, no. 9, pp. 2488–2498, 2014. [9] G. H. Klem, H. O. Lüders, H. H. Jasper, and C. Elger, “The ten-twenty electrode system
of the International Federation. The International Federation of Clinical
Neurophysiology.,” Electroencephalogr. Clin. Neurophysiol. Suppl., vol. 52, pp. 3–6, 1999.
[10] D. Agboada, M. Mosayebi Samani, A. Jamil, M. F. Kuo, and M. A. Nitsche, “Expanding the parameter space of anodal transcranial direct current stimulation of the primary motor cortex,” Sci. Rep., vol. 9, no. 1, Dec. 2019.
[11] M. A. Nitsche et al., “Transcranial direct current stimulation: State of the art 2008,” Brain
Stimul., vol. 1, no. 3, pp. 206–223, 2008.
[12] M. A. Kramer, “An introduction to field analysis techniques: the power spectrum and coherence,” Soc. Neurosci., pp. 18–25, 2013.
[13] T. Melman and J. D. Victor, “Robust power spectral estimation for EEG data,” J.
Neurosci. Methods, vol. 268, pp. 14–22, Aug. 2016.
[14] M. J. Prerau, R. E. Brown, M. T. Bianchi, J. M. Ellenbogen, and P. L. Purdon, “Sleep neurophysiological dynamics through the lens of multitaper spectral analysis,”
Physiology, vol. 32, no. 1. American Physiological Society, pp. 60–92, 01-Jan-2017.
[15] M. M. Shafi et al., “Physiological consequences of abnormal connectivity in a developmental epilepsy.,” Ann. Neurol., vol. 77, no. 3, pp. 487–503, Mar. 2015. [16] C. Russo, M. I. Souza Carneiro, N. Bolognini, and F. Fregni, “Safety Review of 3 4 5 6 7 8 9 10 11 12 13 14 15 16 17 18 19 20 21 22 23 24 25 26 27 28 29 30 31 32 33 34 35 36 37 38 39 40 41 42 43 44 45 46 47 48 49 50 51 52 53 54 55 56
For Peer Review Only
Transcranial Direct Current Stimulation in Stroke,” Neuromodulation Technol. Neural
Interface, Feb. 2017.
[17] E. S. Welch et al., “Feasibility of Computerized Cognitive-Behavioral Therapy Combined With Bifrontal Transcranial Direct Current Stimulation for Treatment of Major
Depression,” Neuromodulation, vol. 2018, 2018.
[18] D. Keeser et al., “Prefrontal direct current stimulation modulates resting EEG and event-related potentials in healthy subjects: a standardized low resolution tomography
(sLORETA) study.,” Neuroimage, vol. 55, no. 2, pp. 644–57, Mar. 2011.
[19] R. Ferrucci et al., “Behavioral and neurophysiological effects of transcranial direct current stimulation (tDCS) in fronto-temporal dementia,” Front. Behav. Neurosci., vol. 12, p. 235, Oct. 2018.
[20] F. Vecchio et al., “tDCS effects on brain network properties during physiological aging,”
Pflugers Arch. Eur. J. Physiol., 2020.
[21] S. Marceglia et al., “Transcranial Direct Current Stimulation Modulates Cortical Neuronal Activity in Alzheimer’s Disease,” Front. Neurosci., vol. 10, Mar. 2016.
[22] D. da S. Souza et al., “Transcranial direct current stimulation improves tinnitus perception and modulates cortical electrical activity in patients with tinnitus: A randomized clinical trial,” Neurophysiol. Clin., vol. 50, no. 4, pp. 289–300, Sep. 2020.
[23] G. Martens et al., “Behavioral and electrophysiological effects of network-based
frontoparietal tDCS in patients with severe brain injury: A randomized controlled trial,”
NeuroImage Clin., vol. 28, Jan. 2020.
[24] G. Tononi and G. M. Edelman, “Consciousness and complexity,” Science, vol. 282, no. 5395. American Association for the Advancement of Science, pp. 1846–1851, 04-Dec-1998.
[25] M. A. Méndez et al., “Complexity analysis of spontaneous brain activity: Effects of depression and antidepressant treatment,” J. Psychopharmacol., vol. 26, no. 5, pp. 636– 643, May 2012.
[26] M. M. Schartner et al., “Global and local complexity of intracranial EEG decreases during NREM sleep,” Neurosci. Conscious., vol. 2017, no. 1, p. niw022, Jan. 2017.
[27] M. Schartner et al., “Complexity of multi-dimensional spontaneous EEG decreases during propofol induced general anaesthesia,” PLoS One, vol. 10, no. 8, Aug. 2015.
[28] D. M. Mateos, R. Guevara Erra, R. Wennberg, and J. L. Perez Velazquez, “Measures of entropy and complexity in altered states of consciousness,” Cogn. Neurodyn., vol. 12, no. 1, pp. 73–84, Feb. 2018.
[29] I. Laakso, S. Tanaka, M. Mikkonen, S. Koyama, and A. Hirata, “Variability in TDCS electric fields: Effects of electrode size and configuration,” in 2017 32nd General
Assembly and Scientific Symposium of the International Union of Radio Science, URSI GASS 2017, 2017, vol. 2017-January, pp. 1–4.
[30] M. Wirth et al., “Effects of transcranial direct current stimulation (tDCS) on behaviour and electrophysiology of language production,” Neuropsychologia, vol. 49, no. 14, pp. 3989–3998, Dec. 2011.
[31] R. Srinivasan, W. R. Winter, J. Ding, and P. L. Nunez, “EEG and MEG coherence: Measures of functional connectivity at distinct spatial scales of neocortical dynamics,” J.
Neurosci. Methods, vol. 166, no. 1, pp. 41–52, Oct. 2007.
[32] M. Scherg, P. Berg, N. Nakasato, and S. Beniczky, “Taking the EEG Back Into the Brain: The Power of Multiple Discrete Sources,” Front. Neurol., vol. 10, Aug. 2019.
3 4 5 6 7 8 9 10 11 12 13 14 15 16 17 18 19 20 21 22 23 24 25 26 27 28 29 30 31 32 33 34 35 36 37 38 39 40 41 42 43 44 45 46 47 48 49 50 51 52 53 54 55
For Peer Review Only
3 4 5 6 7 8 9 10 11 12 13 14 15 16 17 18 19 20 21 22 23 24 25 26 27 28 29 30 31 32 33 34 35 36 37 38 39 40 41 42 43 44 45 46 47 48 49 50 51 52 53 54 55 56For Peer Review Only
Author contributions: LMQ, MME, PL, FF were involved in the design of the study. MME,
DD, MM and EUK were involved in data acquisition. JL and PL wrote the Python program and developed the GUI app for EEG data processing in discussion with MME and LMQ. MME, DD, EUK were involved in data analysis. MME, LMQ, DD, EUK were involved in data
interpretation. MME drafted the paper, and MME, LMQ, DD, EUK, AT, MM, PL, JL and FF revised it for important intellectual content. JL provided the contour map. All authors approved the final version and agree to be accountable for all aspects of the work.
Acknowledgements: We acknowledge the fellows at the Spaulding Neuromodulation Center for
their work, and we acknowledge the participants who volunteered for this trial.
Funding: Research reported in this publication was supported by the United States Air Force
under Award Number FA8650-16-C-6722. The content is solely the responsibility of the authors and does not necessarily represent the official views of the United States Air Force.
Disclosure statement: The authors report no conflicts of interest.
Geolocation information: All the procedures of this study were performed at the Spaulding
Neuromodulation Center, Boston, Massachusetts. EEG data processing was performed at Wilmington, DE, USA.
Data Availability Statement: Data used in this publication can be requested from the
corresponding authors.
Supplemental online material
Clinical trials registry: This pilot exploratory study was not registered.
3 4 5 6 7 8 9 10 11 12 13 14 15 16 17 18 19 20 21 22 23 24 25 26 27 28 29 30 31 32 33 34 35 36 37 38 39 40 41 42 43 44 45 46 47 48 49 50 51 52 53 54 55
For Peer Review Only
Figure 1: CONSORT flow diagram. R: right; L: left; DLPFC: dorsolateral prefrontal cortex.
Groups 1 and 2 used active anodal tDCS with traditional (standard rectangular sponge) and circular (star array) electrodes respectively; Groups 1 and 2 were subdivided into subgroups by reference electrode location at right shoulder (G1.1. and G2.1.) or right DLPFC (G1.2. and G2.2.); Group 3 used sham tDCS with rectangular electrodes at the bilateral DLPFC.
Table 1. Demographic characteristics of each group/subgroup that received tDCS. There
were no significant differences between the 5 subgroups.
Table 2. tDCS adverse effects for each group/subgroup. Only adverse effects reported in at
least one participant are presented. There were no significant differences between the 5 subgroups.
Table 3. Average PSD (top) and coherence (bottom) delta post-pre changes at different electrodes and electrode pairs in the active vs. sham tDCS groups. Statistically significant
results are bolded and starred (*). CCA=complete case analysis, lalpha=low alpha, halpha=high alpha; lbeta=low beta; hbeta=high beta; hdelta=high delta.
Figure 2: Average active vs. average sham tDCS group (CCA) post-pre changes on (I) PSD
at F3, AF3, Fz, FC1, and FC5 (A-E respectively); and (II) coherence at F3-AF3, F3-Fz, F3-FC1, and F3-FC5 (A-D respectively). Statistically significant results are starred (*). EEG frequency bands (x axes) are respectively: alpha, low alpha, high alpha, beta, low beta, high beta, theta, delta, high delta. Y axes for PSD represent μV2/Hz, and for coherence represent the ratio
between F3- and each surrounding electrode. CCA=complete case analysis, lalpha=low alpha, halpha=high alpha; lbeta=low beta; hbeta=high beta; hdelta=high delta.
Table 4. Average PSD (top) and coherence (bottom) delta post-pre changes at different electrodes and electrode pairs in the traditional rectangular vs. circular tDCS groups.
Statistically significant results are bolded and starred (*). Values for PSD are in μV2/Hz, and for
coherence represent the ratio between F3- and each surrounding electrode. CCA=complete case analysis, lalpha=low alpha, halpha=high alpha; lbeta=low beta; hbeta=high beta; hdelta=high delta.
Figure 3: Average traditional rectangular vs. average circular tDCS group (CCA) post-pre changes on (I) PSD at F3, AF3, Fz, FC1, and FC5 (A-E respectively); and (II) coherence at
F3-AF3, F3-Fz, F3-FC1, and F3-FC5 (A-D respectively). Statistically significant results are starred (*). EEG frequency bands (x axes) are respectively: alpha, low alpha, high alpha, beta, low beta, high beta, theta, delta, high delta. Y axes for PSD represent μV2/Hz, and for coherence represent
the ratio between F3- and each surrounding electrode. CCA=complete case analysis, lalpha=low alpha, halpha=high alpha; lbeta=low beta; hbeta=high beta; hdelta=high delta.
Table 5. Average PSD (top) and coherence (bottom) delta post-pre changes at different electrodes and electrode pairs in the right shoulder vs. right DLPFC reference tDCS
groups. Statistically significant results are bolded and starred (*). Values for PSD are in μV2/Hz,
and for coherence represent the ratio between F3- and each surrounding electrode. 3 4 5 6 7 8 9 10 11 12 13 14 15 16 17 18 19 20 21 22 23 24 25 26 27 28 29 30 31 32 33 34 35 36 37 38 39 40 41 42 43 44 45 46 47 48 49 50 51 52 53 54 55 56
For Peer Review Only
CCA=complete case analysis, lalpha=low alpha, halpha=high alpha; lbeta=low beta; hbeta=high beta; hdelta=high delta.
Figure 4: Average right shoulder vs. right DLPFC reference tDCS group (CCA) post-pre changes on (I) PSD at F3, AF3, Fz, FC1, and FC5 (A-E respectively); and (II) coherence at
F3-AF3, F3-Fz, F3-FC1, and F3-FC5 (A-D respectively). Statistically significant results are starred (*). EEG frequency bands (x axes) are respectively: alpha, low alpha, high alpha, beta, low beta, high beta, theta, delta, high delta. Y axes for PSD represent μV2/Hz, and for coherence represent
the ratio between F3- and each surrounding electrode. CCA=complete case analysis, lalpha=low alpha, halpha=high alpha; lbeta=low beta; hbeta=high beta; hdelta=high delta.
Figure 5: Contour map of average low alpha post-pre PSD changes (μV2/Hz) in the rectangular (top) vs. circular (bottom) electrode group. Only the 12 subjects (6 in each
group) included in the CCA analysis at AF3 are shown in this map of all EEG channels (i.e., all subjects had AF3 data; missing data at other channels was at 10.9% and 7.3% for Groups 1 and 2 respectively in this map). There were significant differences between groups at AF3 (black arrows) only in low alpha band (CCA), but average PSD changes across all channels appeared to vary between groups, as noted by the different scales.
3 4 5 6 7 8 9 10 11 12 13 14 15 16 17 18 19 20 21 22 23 24 25 26 27 28 29 30 31 32 33 34 35 36 37 38 39 40 41 42 43 44 45 46 47 48 49 50 51 52 53 54 55
For Peer Review Only
CONSORT flow diagram. R: right; L: left; DLPFC: dorsolateral prefrontal cortex. Groups 1 and 2 used active anodal tDCS with traditional (standard rectangular sponge) and circular (star array) electrodes respectively; Groups 1 and 2 were subdivided into subgroups by reference electrode location at right shoulder (G1.1. and
G2.1.) or right DLPFC (G1.2. and G2.2.); Group 3 used sham tDCS with rectangular electrodes at the bilateral DLPFC. 358x281mm (72 x 72 DPI) 3 4 5 6 7 8 9 10 11 12 13 14 15 16 17 18 19 20 21 22 23 24 25 26 27 28 29 30 31 32 33 34 35 36 37 38 39 40 41 42 43 44 45 46 47 48 49 50 51 52 53 54 55 56
For Peer Review Only
Average active vs. average sham tDCS group (CCA) post-pre changes on (I) PSD at F3, AF3, Fz, FC1, and FC5 (A-E respectively); and (II) coherence at F3-AF3, F3-Fz, F3-FC1, and F3-FC5 (A-D respectively). Statistically significant results are starred (*). EEG frequency bands are respectively: alpha, low alpha, high
alpha, beta, low beta, high beta, theta, delta, high delta. 609x457mm (96 x 96 DPI) 3 4 5 6 7 8 9 10 11 12 13 14 15 16 17 18 19 20 21 22 23 24 25 26 27 28 29 30 31 32 33 34 35 36 37 38 39 40 41 42 43 44 45 46 47 48 49 50 51 52 53 54 55
For Peer Review Only
Average traditional rectangular vs. average circular tDCS group (CCA) post-pre changes on (I) PSD at F3, AF3, Fz, FC1, and FC5 (A-E respectively); and (II) coherence at F3-AF3, F3-Fz, F3-FC1, and F3-FC5 (A-D respectively). Statistically significant results are starred (*). EEG frequency bands are respectively: alpha,
low alpha, high alpha, beta, low beta, high beta, theta, delta, high delta. 609x457mm (96 x 96 DPI) 3 4 5 6 7 8 9 10 11 12 13 14 15 16 17 18 19 20 21 22 23 24 25 26 27 28 29 30 31 32 33 34 35 36 37 38 39 40 41 42 43 44 45 46 47 48 49 50 51 52 53 54 55 56
For Peer Review Only
Average right shoulder vs. right DLPFC reference tDCS group (CCA) post-pre changes on (I) PSD at F3, AF3, Fz, FC1, and FC5 (A-E respectively); and (II) coherence at F3-AF3, F3-Fz, F3-FC1, and F3-FC5 (A-D respectively). Statistically significant results are starred (*). EEG frequency bands are respectively: alpha,
low alpha, high alpha, beta, low beta, high beta, theta, delta, high delta. 609x457mm (96 x 96 DPI) 3 4 5 6 7 8 9 10 11 12 13 14 15 16 17 18 19 20 21 22 23 24 25 26 27 28 29 30 31 32 33 34 35 36 37 38 39 40 41 42 43 44 45 46 47 48 49 50 51 52 53 54 55
For Peer Review Only
Contour map of average low alpha post-pre PSD changes in the rectangular (top) vs. circular (bottom) electrode group. Only the 12 subjects (6 in each group) included in the CCA analysis at AF3 are shown in this map of all EEG channels (i.e., all subjects had AF3 data; missing data at other channels was at 10.9% and 7.3% for Groups 1 and 2 respectively in this map). There were significant differences between groups at
AF3 (black arrows) only in low alpha band (CCA), but average PSD changes across all channels appeared to vary between groups, as noted by the different scales.
457x609mm (96 x 96 DPI) 3 4 5 6 7 8 9 10 11 12 13 14 15 16 17 18 19 20 21 22 23 24 25 26 27 28 29 30 31 32 33 34 35 36 37 38 39 40 41 42 43 44 45 46 47 48 49 50 51 52 53 54 55 56
For Peer Review Only
Table 1. Demographic characteristics of each group/subgroup that received tDCS. There
were no significant differences between the 5 subgroups.
Group 1 Rectangular Electrodes (n=9) Group 2 Circular Electrodes (n=10) G1.1. Anodal L DLPFC / Cathodal R Shoulder G1.2. Anodal L DLPFC / Cathodal R DLPFC G2.1. Anodal L DLPFC / Cathodal R Shoulder G2.2. Anodal L DLPFC / Cathodal R DLPFC Group 3 Sham (n=5)
Age in years, mean (SD) 33.25 (8.01) 28 (4.74) 23.4 (0.89) 27 (7.34) 26.8 (4.91) Male/Female (% Male) 3/1 (75) 3/2 (60) 1/4 (20) 2/3 (40) 1/4 (20) Right handedness score, mean (SD) 100 (0.00) 90 (10.45) 92.5 (11.18) 95 (6.84) 87.5 (15.30)
Education Level, n Master: 2
Student: 1 BA: 1 BA: 1 MD: 2 PhD: 2 Master: 1 Student: 1 BA: 3 Master: 1 Student: 1 BA: 3 Master: 1 BA: 2 PhD: 1 Race, n (%) Caucasian: 2 (50) Other: 2 (50) Caucasian: 3 (60) Black: 1 (20) Asian: 1 (20) Caucasian: 2 (40) Asian: 2 (40) Mixed: 1 (20) Caucasian: 4 (80) Asian: 1 (20) Caucasian: 3 (60) Black: 1 (20) Asian: 1 (20) 3 4 5 6 7 8 9 10 11 12 13 14 15 16 17 18 19 20 21 22 23 24 25 26 27 28 29 30 31 32 33 34 35 36 37 38 39 40 41 42 43 44 45 46 47 48 49 50 51 52 53 54 55
For Peer Review Only
Table 2. tDCS adverse effects for each group/subgroup. Only adverse effects reported in at
least one participant are presented. There were no significant differences between the 5 subgroups. Group 1 Traditional Electrodes (n=9) Group 2 Circular Electrodes (n=10) G1.1. Anodal L DLPFC / Cathodal R Shoulder G1.2. Anodal L DLPFC / Cathodal R DLPFC G2.1. Anodal L DLPFC / Cathodal R Shoulder G2.2. Anodal L DLPFC / Cathodal R DLPFC Group 3 Sham (n=5)
Scalp Burning Sensation, n (%) 2 (50) 4 (80) 4 (80) 3 (60) 5 (100)
Scalp Pain, n (%) 0 (0) 0 (0) 0 (0) 0 (0) 1 (20) Tingling, n (%) 1 (25) 5 (100) 3 (60) 3 (60) 3 (60) Skin Redness, n (%) 1 (25) 3 (60) 3 (60) 2 (40) 2 (40) Sleepiness, n (%) 0 (0) 1 (20) 0 (0) 0 (0) 1 (20) Other, n (%) 0 (0) 0 (0) 1 (20) 0 (0) 1 (20) 3 4 5 6 7 8 9 10 11 12 13 14 15 16 17 18 19 20 21 22 23 24 25 26 27 28 29 30 31 32 33 34 35 36 37 38 39 40 41 42 43 44 45 46 47 48 49 50 51 52 53 54 55 56
For Peer Review Only
PSD CCA active/shamAverage post-pre alpha post-pre lalpha post-pre halpha betapost-pre post-pre lbeta post-pre hbeta post-pre theta post-pre delta post-pre hdelta
Active 0.223 0.299 0.154 0.417 0.382 0.444 0.371 -0.435 -0.195 F3 Sham 1.309 1.575 1.150 0.160 0.143 0.167 0.243 -0.788 -0.918 Active 0.805 1.172 0.563 0.471 0.611 0.376 0.409 -0.530 -0.305 AF3 Sham 1.333 1.507 1.245 0.282 0.219 0.329 -0.175 -1.366 -1.574 Active 0.057* 0.143 -0.019 0.389 0.296 0.454 0.346 -0.491* -0.258* Fz Sham 1.676* 1.825 1.611 0.476 0.532 0.442 -0.028 -1.370* -1.519* Active -0.415* -0.429 -0.429 -0.272 -0.332 -0.234 -0.064 -0.481 -0.362 FC1 Sham 1.619* 1.744 1.560 0.498 0.565 0.452 0.066 -1.318 -1.340 Active 0.292 0.344 0.227 0.397 0.432 0.374 0.400 -0.465 -0.193 FC5 Sham 2.427 2.644 2.283 0.921 1.363 0.617 1.158 -0.560 -0.535 Coherence
pairs CCA Average active/sham post-pre alpha post-pre lalpha post-pre halpha betapost-pre post-pre lbeta post-pre hbeta post-pre theta post-pre delta post-pre hdelta
Active 0.004 0.004 0.004 0.005 0.005 0.005 0.005 0.003 0.004 F3-AF3 Sham -0.004 0.000 -0.007 -0.009 -0.007 -0.011 -0.002 0.002 0.000 Active 0.002 0.001 0.003 0.007* 0.007 0.007 0.005* 0.007* 0.006* F3-Fz Sham -0.009 -0.006 -0.010 -0.015* -0.013 -0.015 -0.015* -0.016* -0.019* Active 0.001 0.000 0.001 0.004 0.004 0.004 0.003 0.001 0.001 F3-FC1 Sham -0.010 -0.007 -0.013 -0.018 -0.016 -0.020 -0.014 -0.013 -0.017 Active 0.000 0.001 -0.001 0.004 0.003 0.005 0.000 0.002 0.002 F3-FC5 Sham 0.013 0.014 0.013 0.011 0.016 0.008 0.008 0.001 0.001
Table 3. Average PSD (top) and coherence (bottom) delta post-pre changes at different electrodes and electrode pairs in the active vs. sham tDCS groups. Values for PSD are in
μV2/Hz, and for coherence represent the ratio between F3- and each surrounding electrode.
Statistically significant results are bolded and starred (*). CCA=complete case analysis, lalpha=low alpha, halpha=high alpha; lbeta=low beta; hbeta=high beta; hdelta=high delta. 3 4 5 6 7 8 9 10 11 12 13 14 15 16 17 18 19 20 21 22 23 24 25 26 27 28 29 30 31 32 33 34 35 36 37 38 39 40 41 42 43 44 45 46 47 48 49 50 51 52 53 54 55
For Peer Review Only
PSD CCA Average rectangular/ circular post-pre alpha post-pre lalpha post-pre halpha post-pre beta post-pre lbeta post-pre hbeta post-pre theta post-pre delta post-pre hdelta Rectangular -0.110 -0.209 -0.089 0.166 -0.020 0.303 0.302 -0.394 -0.145 F3 Circular 0.490 0.704 0.348 0.617 0.704 0.557 0.427 -0.468 -0.236 Rectangular 1.236 1.813* 0.846 0.837 0.845 0.838 0.539 -0.414 -0.275 AF3 Circular 0.374 0.531* 0.279 0.106 0.376 -0.087 0.278 -0.647 -0.335 Rectangular -0.098 -0.216 -0.058 0.467 0.214 0.649 0.288 -0.429 -0.263 Fz Circular 0.197 0.466 0.016 0.318 0.370 0.278 0.399 -0.548 -0.253 Rectangular -0.678 -1.042 -0.489 -0.270 -0.486 -0.121 -0.156 -0.412 -0.330 FC1 Circular -0.205 0.060 -0.381 -0.273 -0.209 -0.325 0.009 -0.537 -0.388 Rectangular 0.237 0.092 0.282 0.520 0.440 0.579 0.508 -0.199 0.023 FC5 Circular 0.364 0.668 0.156 0.240 0.421 0.109 0.261 -0.807 -0.470 Coherence pairs CCA Average rectangular/ circular post-pre
alpha post-pre lalpha post-pre halpha post-pre beta lbetapost-pre post-pre hbeta post-pre theta post-pre delta post-pre hdelta
Rectangular 0.009 0.008 0.010 0.017 0.017 0.017 0.007 0.003 0.005 F3-AF3 Circular 0.000 0.001 0.000 -0.005 -0.005 -0.005 0.003 0.002 0.003 Rectangular 0.001 -0.002 0.003 0.010 0.009 0.010 0.004 0.010 0.008 F3-Fz Circular 0.003 0.003 0.003 0.005 0.005 0.005 0.006 0.004 0.004 Rectangular -0.002 -0.003 -0.002 0.002 0.002 0.003 0.000 0.001 0.002 F3-FC1 Circular 0.003 0.002 0.003 0.005 0.005 0.004 0.004 0.000 0.001 Rectangular -0.002 -0.002 -0.003 0.001 0.001 0.001 -0.002 0.001 0.002 F3-FC5 Circular 0.003 0.005 0.001 0.008 0.006 0.009 0.003 0.003 0.003
Table 4. Average PSD (top) and coherence (bottom) delta post-pre changes at different electrodes and electrode pairs in the traditional rectangular vs. circular tDCS groups.
Statistically significant results are bolded and starred (*). Values for PSD are in μV2/Hz, and for
coherence represent the ratio between F3- and each surrounding electrode. CCA=complete case analysis, lalpha=low alpha, halpha=high alpha; lbeta=low beta; hbeta=high beta; hdelta=high delta. 3 4 5 6 7 8 9 10 11 12 13 14 15 16 17 18 19 20 21 22 23 24 25 26 27 28 29 30 31 32 33 34 35 36 37 38 39 40 41 42 43 44 45 46 47 48 49 50 51 52 53 54 55 56
For Peer Review Only
PSD CCA Average R shoulder/R DLPFC post-pre alpha post-pre lalpha post-pre halpha post-pre beta post-pre lbeta post-pre hbeta post-pre theta post-pre delta post-pre hdelta R shoulder 0.259 0.385 0.171 -0.138 -0.023* -0.219 -0.130* -0.526 -0.478 F3 R DLPFC 0.187 0.212 0.136 0.972 0.788* 1.107 0.872* -0.344 0.087 R shoulder 1.074 1.136 1.042 0.408 0.533 0.322 0.299 -0.561 -0.376 AF3 R DLPFC 0.536 1.208 0.083 0.535 0.688 0.429 0.519 -0.500 -0.234 R shoulder 0.429 0.455 0.414 0.251 0.266 0.238 0.016 -0.669 -0.517 Fz R DLPFC -0.277 -0.138 -0.409 0.513 0.324 0.649 0.644 -0.332 -0.025 R shoulder -0.064 -0.072 -0.060 -0.372 -0.341 -0.398 -0.432 -0.715 -0.729 FC1 R DLPFC -0.767 -0.787 -0.798 -0.172 -0.323 -0.071 0.303 -0.248 0.005 R shoulder 0.692 0.757 0.633 0.313 0.435 0.229 -0.097* -0.830 -0.653 FC5 R DLPFC -0.107 -0.069 -0.179 0.482 0.429 0.518 0.897* -0.100 0.268 Coherence pairs CCA Average R shoulder/R DLPFC post-pre
alpha post-pre lalpha post-pre halpha post-pre beta lbetapost-pre post-pre hbeta post-pre theta post-pre delta post-pre hdelta
R shoulder 0.008 0.007 0.009 0.009 0.008 0.010 0.006 0.003 0.003 F3-AF3 R DLPFC 0.000 0.002 -0.001 0.000 0.001 -0.001 0.004 0.002 0.005 R shoulder 0.002 0.001 0.003 0.005 0.005 0.005 0.001 0.005 0.002 F3-Fz R DLPFC 0.002 0.001 0.002 0.010 0.009 0.010 0.008 0.009 0.010 R shoulder 0.002 0.001 0.003 0.003 0.004 0.003 0.002 0.002 0.002 F3-FC1 R DLPFC -0.001 -0.001 -0.002 0.004 0.004 0.004 0.004 -0.001 0.001 R shoulder 0.000 0.002 -0.001 0.004 0.003 0.005 0.001 0.003 0.004 F3-FC5 R DLPFC 0.000 0.000 -0.001 0.004 0.004 0.004 0.000 0.000 0.001
Table 5. Average PSD (top) and coherence (bottom) delta post-pre changes at different electrodes and electrode pairs in the right shoulder vs. right DLPFC reference tDCS
groups. Statistically significant results are bolded and starred (*). Values for PSD are in μV2/Hz,
and for coherence represent the ratio between F3- and each surrounding electrode.
CCA=complete case analysis, lalpha=low alpha, halpha=high alpha; lbeta=low beta; hbeta=high beta; hdelta=high delta.
3 4 5 6 7 8 9 10 11 12 13 14 15 16 17 18 19 20 21 22 23 24 25 26 27 28 29 30 31 32 33 34 35 36 37 38 39 40 41 42 43 44 45 46 47 48 49 50 51 52 53 54 55
For Peer Review Only
SUPPLEMENTPATIENTS AND METHODS
This was an exploratory randomized, double-blind, sham-controlled parallel-arm single-center clinical trial on healthy volunteers at the Spaulding Neuromodulation Center, Boston,
Massachusetts.
Sample size
Sample size calculations were performed considering an effect size of 1.2, a power of 80% and an alpha of 5% to show the difference between tDCS using rectangular vs. circular electrodes. This effect size is conservative even for this pilot study. Nine subjects were thus required per active group; sample size was increased by 10% to account for potential dropouts, resulting in 10 per group; we added a sham tDCS group for secondary active/sham comparisons.
Participants
Participants were recruited via the Partners Rally page advertising the study online. We enrolled 25 healthy male and female participants based on the following eligibility criteria: Inclusion criteria: i) able to give informed consent to participate in the study, ii) 18-40 years old, iii) right-handed as based on Edinburgh Handedness Inventory (EHI) – Short Form.
Exclusion criteria: the presence of i) a history of acute thrombosis, hypertension, cardiac arrhythmias, or other unstable heart conditions less than 12 months ago; ii) diabetes; iii) pacemakers, and/or implantable cardioverter-defibrillators; iv) a physical disability, medical condition, neurological and/or psychological disorder precluding safe and adequate testing; v) pregnancy as assessed by the pregnancy test; vi) history of alcohol or drug abuse within the past 6 months as self-reported; vii) active smoker or history of smoking in the last 6 months; vii) history of unexplained fainting spells as self-reported; viii) head injury resulting in more than a momentary loss of consciousness; ix) history of neurosurgery as self-reported; x) epilepsy; xi) metallic brain implants.
The study was comprised of a consent/screening and a stimulation/assessments visit. One co-investigator performed recruitment, prescreening, informed consent and screening procedures (M.M.E.). Once screened into the study, participants would go on to do the pre-tDCS EEG, followed by tDCS (based on their group randomization) with limited online EEG, the tDCS adverse effects questionnaire, and finally the post-tDCS EEG. Subjects were randomized based on the order of their enrollment/entrance into the study by the co-investigators who
performed tDCS.
Data management
All identifying information was stored in a locked cabinet in a room requiring ID access, and other identifying data was saved on a secure network drive accessible only to co-investigators.
Intervention and assessments
3 4 5 6 7 8 9 10 11 12 13 14 15 16 17 18 19 20 21 22 23 24 25 26 27 28 29 30 31 32 33 34 35 36 37 38 39 40 41 42 43 44 45 46 47 48 49 50 51 52 53 54 55 56
For Peer Review Only
Prior to the visit, participants scheduled for consent were instructed to make sure their hair was clean, dry and free of products before the visit, and were instructed to get about 8 hours of sleep and to avoid caffeinated beverages in the morning before the visit.
tDCS
The battery-operated Starstim 8 (Neuroelectrics®) device was used to provide tDCS and a laptop with NIC 1.4 software was used to adjust the tDCS settings to active or sham conditions.
The electric current was ramped up to 2 mA, and ramping periods lasted 30 seconds at the beginning and end of the 15-minute sessions for all groups. In between ramping, a 2 mA current was applied to participants allocated to active tDCS, while no current was applied to
participants in the sham group.
The adverse effects questionnaire was administered after tDCS, evaluating expected potential adverse effects as well as an open-ended question on any other possible symptoms; symptom severity was ranked (1=absent, 2=mild, 3=moderate, 4=severe), and symptom relatedness to stimulation was ranked (from 1=none, 2=remote, 3=possible, 4=probable, 5=definite).
Offline EEG
Cap sizes were large and medium sized. Participants were asked to sit quietly in a relaxed position with their eyes on an X mark and to avoid dozing off. Prior to the post-tDCS EEG all participants had their right shoulders covered to avoid unblinding EEG assessors (in case of redness under the circular electrodes).
EEG analysis
All EEGs were exported in NEDF form to be cleaned on MatLab (EEGLab). M.M.E. manually cleaned all offline EEGs in the eyes closed state by rejecting artifactual channels and artifacts in the remaining channel EEG segments. As the priority was the left DLPFC, the right ear was considered a near optimal EEG reference as it is not involved and is outside the direction of current flow for all montages; thus, EEGs were analyzed in a referential montage with the right ear as a reference. 3 4 5 6 7 8 9 10 11 12 13 14 15 16 17 18 19 20 21 22 23 24 25 26 27 28 29 30 31 32 33 34 35 36 37 38 39 40 41 42 43 44 45 46 47 48 49 50 51 52 53 54 55
For Peer Review Only
RESULTSMissing data N (%) for delta post-pre PSD
F3
N (%) N (%)AF3 N (%)Fz N (%)FC1 N (%)FC5
Active and sham
groups – 24 (100) 1 (4.2) 7 (29.2) 0 (0) 1 (4.2) 3 (12.5) Active group – 19 (100) 1 (5.3) 7 (36.8) 0 (0) 1 (5.3) 3 (15.8) Sham group – 5 (100) 0 (0) 0 (0) 0 (0) 0 (0) 0 (0) Rectangular and circular groups – 19 (100) 1 (5.3) 7 (36.8) 0 (0) 1 (5.3) 3 (15.8) Rectangular group – 9 (100) 1 (11.1) 3 (33.3) 0 (0) 1 (11.1) 0 (0) Circular group – 10 (100) 0 (0) 4 (40) 0 (0) 0 (0) 3 (30) R shoulder and R DLPFC groups - 19 (100) 1 (5.3) 7 (36.8) 0 (0) 1 (5.3) 3 (15.8) R shoulder group – 9 (100) 0 (0) 3 (33.3) 0 (0) 0 (0) 1 (11.1) R DLPFC group – 10 (100) 1 (10) 4 (40) 0 (0) 1(10) 2 (20)
Supplementary Table 1: Missing PSD delta post-pre analysis data number (N) and percentage
(%) per group; rounded to first decimal point. 3 4 5 6 7 8 9 10 11 12 13 14 15 16 17 18 19 20 21 22 23 24 25 26 27 28 29 30 31 32 33 34 35 36 37 38 39 40 41 42 43 44 45 46 47 48 49 50 51 52 53 54 55 56
For Peer Review Only
Missing data N (%)for delta post-pre coherence pairs
F3-AF3
N (%) N (%)F3-Fz F3-FC1N (%) F3-FC5N (%)
Active and sham
groups – 24 (100) 8 (33.3) 1 (4.2) 1 (4.2) 4 (16.7) Active group – 19 (100) 8 (42.1) 1 (5.3) 1 (5.3) 4 (21.1) Sham group – 5 (100) 0 (0) 0 (0) 0 (0) 0 (0) Rectangular and circular groups – 19 (100) 8 (42.1) 1 (5.3) 1 (5.3) 4 (21.1) Rectangular group – 9 (100) 4 (44.4) 1 (11.1) 1 (11.1) 1 (11.1) Circular group – 10 (100) 4 (40.0) 0 (0) 0 (0) 3 (30.0) R shoulder and R DLPFC groups - 19 (100) 8 (42.1) 1 (5.3) 1 (5.3) 4 (21.1) R shoulder group - 9 (100) 3 (15.8) 0 (0) 0 (0) 1 (11.1) R DLPFC group - 10 (100) 5 (26.3) 1 (10) 1 (10) 3 (30)
Supplementary Table 2: Missing coherence pairs delta post-pre analysis data number (N) and
percentage (%) per group; rounded to first decimal point. 3 4 5 6 7 8 9 10 11 12 13 14 15 16 17 18 19 20 21 22 23 24 25 26 27 28 29 30 31 32 33 34 35 36 37 38 39 40 41 42 43 44 45 46 47 48 49 50 51 52 53 54 55
For Peer Review Only
Supplementary Figure 1: Coherence in a sample subject using 3 different techniques; top figure
shows the magnitude squared coherence method; middle figure shows pure coherence; bottom figure shows the multitaper method; the latter has the highest coherence, entirely in the 0.93-0.99 range 3 4 5 6 7 8 9 10 11 12 13 14 15 16 17 18 19 20 21 22 23 24 25 26 27 28 29 30 31 32 33 34 35 36 37 38 39 40 41 42 43 44 45 46 47 48 49 50 51 52 53 54 55 56
For Peer Review Only
Supplemental Figure 2: Comparison between the PSD estimation using periodogram vs.
Welch’s vs. multitaper methods for the same subject (Sigma PreEC); the multitaper method reduces outliers and variability
3 4 5 6 7 8 9 10 11 12 13 14 15 16 17 18 19 20 21 22 23 24 25 26 27 28 29 30 31 32 33 34 35 36 37 38 39 40 41 42 43 44 45 46 47 48 49 50 51 52 53 54 55
For Peer Review Only
Supplementary Figure 3: Average PSD post-pre differences at F3 and Fz using different electrode shapes (traditional rectangular vs. circular) and different reference locations (right shoulder at top figure vs. right DLPFC at bottom figure). The combined electrode shapes and reference locations appear to alter PSD modulation, but the samples were too small to do statistical comparisons for this figure.
3 4 5 6 7 8 9 10 11 12 13 14 15 16 17 18 19 20 21 22 23 24 25 26 27 28 29 30 31 32 33 34 35 36 37 38 39 40 41 42 43 44 45 46 47 48 49 50 51 52 53 54 55 56