Publisher’s version / Version de l'éditeur:
Applied and Environmental Microbiology, 77, 19, pp. 7016-7022, 2011-08-12
READ THESE TERMS AND CONDITIONS CAREFULLY BEFORE USING THIS WEBSITE. https://nrc-publications.canada.ca/eng/copyright
Vous avez des questions? Nous pouvons vous aider. Pour communiquer directement avec un auteur, consultez la première page de la revue dans laquelle son article a été publié afin de trouver ses coordonnées. Si vous n’arrivez pas à les repérer, communiquez avec nous à PublicationsArchive-ArchivesPublications@nrc-cnrc.gc.ca.
Questions? Contact the NRC Publications Archive team at
PublicationsArchive-ArchivesPublications@nrc-cnrc.gc.ca. If you wish to email the authors directly, please see the first page of the publication for their contact information.
NRC Publications Archive
Archives des publications du CNRC
This publication could be one of several versions: author’s original, accepted manuscript or the publisher’s version. / La version de cette publication peut être l’une des suivantes : la version prépublication de l’auteur, la version acceptée du manuscrit ou la version de l’éditeur.
For the publisher’s version, please access the DOI link below./ Pour consulter la version de l’éditeur, utilisez le lien DOI ci-dessous.
https://doi.org/10.1128/AEM.05246-11
Access and use of this website and the material on it are subject to the Terms and Conditions set forth at
Effect of light intensity on the relative dominance of toxigenic and
nontoxigenic strains of Microcystis aeruginosa
LeBlanc Renaud, Susan; Pick, Frances R.; Fortin, Nathalie
https://publications-cnrc.canada.ca/fra/droits
L’accès à ce site Web et l’utilisation de son contenu sont assujettis aux conditions présentées dans le site LISEZ CES CONDITIONS ATTENTIVEMENT AVANT D’UTILISER CE SITE WEB.
NRC Publications Record / Notice d'Archives des publications de CNRC:
https://nrc-publications.canada.ca/eng/view/object/?id=1b8196bc-cd3a-4ac2-b596-889248a1190f
https://publications-cnrc.canada.ca/fra/voir/objet/?id=1b8196bc-cd3a-4ac2-b596-889248a1190f
Published Ahead of Print 12 August 2011.
10.1128/AEM.05246-11.
2011, 77(19):7016. DOI:
Appl. Environ. Microbiol.
Susan LeBlanc Renaud, Frances R. Pick and Nathalie Fortin
Strains of Microcystis aeruginosa
Dominance of Toxigenic and Nontoxigenic
Effect of Light Intensity on the Relative
http://aem.asm.org/content/77/19/7016
Updated information and services can be found at:
These include:
REFERENCES
http://aem.asm.org/content/77/19/7016#ref-list-1
at:
This article cites 30 articles, 12 of which can be accessed free
CONTENT ALERTS
more»
articles cite this article),
Receive: RSS Feeds, eTOCs, free email alerts (when new
http://aem.asm.org/site/misc/reprints.xhtml
Information about commercial reprint orders:
http://journals.asm.org/site/subscriptions/
To subscribe to to another ASM Journal go to:
on January 20, 2012 by CANADA INST FOR STI
http://aem.asm.org/
Downloaded from
APPLIED ANDENVIRONMENTALMICROBIOLOGY, Oct. 2011, p. 7016–7022 Vol. 77, No. 19 0099-2240/11/$12.00 doi:10.1128/AEM.05246-11
Copyright © 2011, American Society for Microbiology. All Rights Reserved.
Effect of Light Intensity on the Relative Dominance of Toxigenic and
Nontoxigenic Strains of Microcystis aeruginosa
䌤
Susan LeBlanc Renaud,
1* Frances R. Pick,
1and Nathalie Fortin
2Department of Biology, Centre for Advanced Research in Environmental Genomics, University of Ottawa, 30 Marie Curie, Ottawa, ON, Canada,1and Biotechnology Research Institute, National Research Council of
Canada, 6100 Royalmount Avenue, Montre´al, QC, Canada2
Received 21 April 2011/Accepted 5 August 2011
In aquatic ecosystems, the factors that regulate the dominance of toxin-producing cyanobacteria over non-toxin-producing strains of the same species are largely unknown. One possible hypothesis is that limiting resources lead to the dominance of the latter because of the metabolic costs associated with toxin production. In this study, we tested the effect of light intensity on the performance of a microcystin-producing strain of
Microcystis aeruginosa(UTCC 300) when grown in mixed cultures with non-microcystin-producing strains with similar intrinsic growth rates (UTCC 632 and UTCC 633). The endpoints measured included culture growth rates, microcystin concentrations and composition, and mcyD gene copy numbers determined using quanti-tative PCR (Q-PCR). In contrast to the predicted results, under conditions of low light intensity (20 mol 䡠 mⴚ2䡠 sⴚ1), the toxigenic strain became dominant in both of the mixed cultures based on gene copy numbers and microcystin concentrations. When grown under conditions of high light intensity (80 mol 䡠 mⴚ2䡠 sⴚ1), the toxigenic strain still appeared to dominate over nontoxigenic strain UTCC 632 but less so over strain UTCC 633. Microcystins may not be so costly to produce that toxigenic cyanobacteria are at a disadvantage in competition for limiting resources.
Competition for common resources is an important mecha-nism structuring biological communities, particularly algal communities (28). Cyanobacteria appear to outcompete other algal taxa during eutrophication of freshwater ecosystems, leading in extreme cases to visible surface accumulations or blooms posing a risk to human health (7, 21, 26a). This shift toward cyanobacterial dominance can be explained by the unique ability of some species to fix nitrogen and to regulate their position in the water column via gas vacuoles (providing an advantage in capturing light and nutrients) as well as a variety of defense mechanisms. The latter may be based on morphological traits that counter grazing losses (22) or the production of secondary metabolites such as cyanotoxins that may also suppress the growth of other algal species (2).
While variations in a number of abiotic and biotic factors (e.g., nutrients, grazer abundance, and population composi-tion) may affect the outcome of algal competition, light in particular is a critical resource for all algal species in the aquatic environment and can be the key factor in determining which species become dominant. Huisman et al. (13) examined competition between various algal taxa for light in mixed-culture experiments and found that the species that maintained the lowest level of critical light intensity (the point at which the culture is so dense that not enough light is available for net growth) were superior competitors regardless of their maxi-mum growth rates (13).
In the case of cyanobacterial blooms, toxigenic species often dominate cyanobacterial blooms, with estimates suggesting
that more than 50% of cyanobacterial blooms typically pro-duce cyanotoxins (e.g., 10). Usually, by the time a bloom de-velops, nutrient resources are quickly used up and increased cell densities lead to reduced light availability. This change in the light regimen may affect the outcome of competition be-tween cyanobacterial species and strains. Several studies have suggested that nontoxigenic strains tend to dominate later in the summer (see, e.g., references 4, 14, and 17), presumably when light and nutrient resources are more limiting. However, other studies have indicated more stable coexistence of toxi-genic and nontoxitoxi-genic strains (e.g., 18, 25). The toxicity of cyanobacterial blooms can be difficult to predict, as the factors controlling bloom formation and toxin production may be en-tirely independent (23).
While there have been several examples of mixed-culture experiments using cyanobacteria and other algae, few studies have grown toxigenic and nontoxigenic cyanobacterial strains simultaneously (5, 16). The difficulty with such experiments is that toxigenic and nontoxigenic strains cannot be separated morphologically using traditional microscopy or flow cytom-etry techniques. However, the development of specific molec-ular probes can overcome this challenge. Kardinaal et al. determined the outcome of competition between two micro-cystin-producing and two non-micromicro-cystin-producing strains of the cyanobacterium Microcystis aeruginosa in light-limited chemostats (16). The population dynamics of the four strains was measured using both light absorbance spectra and molecular techniques, including denaturing gradient gel electrophoresis (DGGE) of the internal transcribed spacer (ITS) region gene. In all experiments, the toxigenic strain lost the competition for light and was completely replaced by the nontoxigenic strain within approximately 2 weeks. The nontoxigenic strains were therefore considered better
* Corresponding author. Mailing address: Department of Biology, University of Ottawa, 30 Marie Curie, Ottawa, Ontario K1N 6N5, Canada. Phone: (613) 562 5800, ext. 6364. Fax: (613) 562 5486. E-mail: serenaud@gmail.com.
䌤Published ahead of print on 12 August 2011.
7016
on January 20, 2012 by CANADA INST FOR STI
http://aem.asm.org/
competitors for light than the toxigenic strains, presumably because of the energy costs of producing toxins, although the limitations of using a small number of strains to gener-alize was acknowledged (16).
In contrast to these results, a separate line of evidence has suggested that microcystins may actually play a role in light adaptation processes (11, 15) and their physical association with photosynthetic membranes supports this hypothesis (33). If this hypothesis were correct, the prediction would then be that toxigenic strains would dominate over nontoxigenic strains when grown under light-limiting conditions. This was demon-strated in another competition experiment using microcystin-producing and non-microcystin-microcystin-producing strains of the fila-mentous cyanobacterium Planktothrix agardhii (5). Under growth-limiting conditions of low temperature and light, Bri-and et al. found that the microcystin-producing strains of P. agardhii grew better (exhibited greater fitness) than non-mi-crocystin-producing strains in mixed batch cultures (5). The reverse occurred under non-growth-limiting conditions (5).
Given these contrasting results, we examined the growth of a toxigenic strain of Microcystis aeruginosa in competition for light with nontoxigenic strains. Here, the toxigenic genotype was distinguished from nontoxigenic genotypes by quantitative PCR (Q-PCR) using primers for the -ketoacyl synthase (KS) portion of the mcyD gene (mcyDKS) of the microcystin
synthe-tase gene complex (9). Whereas many competition experi-ments have utilized continuous or semicontinuous cultures (see, e.g., references 13, 16, and 31), others have used batch cultures (see, e.g., references 5, 20, and 32). Batch cultures were chosen here, as they exhibit growth dynamics that are similar to those observed during algal blooms (8, 20).
MATERIALS AND METHODS
Cyanobacterial strains and culture conditions.Three strains of Microcystis
aeruginosawere obtained from the University of Toronto Culture Collection (UTCC; now the Canadian Phycological Culture Centre [CPCC]): the microcys-tin-producing UTCC 300 strain and the non-microcysmicrocys-tin-producing strains UTCC 632 and UTCC 633. UTCC 300 was chosen as it has a simple microcystin congener profile, producing only two microcystin congeners, microcystin-LR and [Dha7]desmethylmicrocystin-LR, and because, among the toxigenic strains tested, its growth rate was the most similar to those of UTCC 632 and UTCC 633. UTCC 632 and 633 both showed no evidence of microcystin production, as confirmed by both chemical and molecular analyses. All strains grew as single-cell populations, even though Microcystis aeruginosa normally grows in large colonies in nature. All strains contained phycocyanin as the dominant phycobili-protein photosynthetic accessory pigment, and none contained phycoerythrin. All cultures were grown under axenic conditions, to the degree possible for cyanobacteria, in 500-ml Erlenmeyer flasks containing 250 ml of BG-11 growth medium (Sigma C3061) (27) in a Conviron growth chamber, initially under conditions of light intensity of 60 mol 䡠 m⫺2
䡠 s⫺1and a 12-h day-night cycle at 25°C. Before the start of the experiment, strains were transferred in replicate aliquots to fresh BG-11 growth medium and allowed to acclimate for at least 1 week at two different light levels (20 mol 䡠 m⫺2
䡠 s⫺1and 80 mol 䡠 m⫺2䡠 s⫺1) on a 12-h day-night cycle at 25°C.
Mixed-culture experiments.On day 0 of the experiment, the cell densities of all three strains were determined using flow cytometry. With cell densities cal-culated, five cultures were initiated in fresh growth medium for growth under conditions of both low and high light intensity. Strains UTCC 300, 632, and 633 were each grown as single cultures, along with a mixed culture of UTCC 300 plus 632 and a mixed culture of UTCC 300 plus 633. Each mixed culture was estab-lished by adding the same cell density (1 ⫻ 105cells 䡠 ml⫺1) of each individual
culture to a flask containing new growth medium so that both strains would start with the same number of cells. Three replicate experiments for each type of culture were performed under both sets of light intensity conditions. The cultures were aseptically subsampled over 14 days, as the exponential phase had ended for
all by day 12. The three main variables measured were (i) growth rate, (ii) microcystin concentration, and (iii) mcyD gene copy number (for determinations of the proportion of toxigenic cells in the mixed cultures, assuming one copy of
mcyDper genome).
Growth rate measurements.The growth of each strain was monitored by measuring both optical density (OD) and cell density. The OD at 750 nm was measured daily using a Pye-Unicam spectrophotometer (27). OD was plotted versus time to obtain the growth curve for each replicate of each Microcystis strain, and the growth rate of each strain was estimated from the slope calculated for the exponential-growth phase. Growth was also measured by preserving a subsample of culture every second day in 10% paraformaldehyde and subse-quently counting cells using flow cytometry (Beckman Coulter FC500) based on the fluorescence of phycocyanin (FL4 channel). A solution of 20 l of YG (yellow-green) fluorescent 1-m beads (Polysciences 18660 Fluoresbrite YG microspheres) (calibration grade; 1.00-m diameter) was added to a 2-ml sub-sample of each replicate to achieve a final bead concentration of 1 ⫻ 106
beads 䡠 ml⫺1. Cell concentrations were calculated by adding the ratio of gated
beads per known concentration of beads to the ratio of gated cells per unknown concentration of cells. Cell density was plotted versus time to obtain a growth curve, and the growth rate was calculated from the slope of the exponential-growth phase (27).
Microcystin analysis.Microcystin analysis was carried out on days 2, 6, 10, and 14. For microcystin analysis, 20 ml of each strain was filtered onto a preashed (500°C for 2 h), preweighed Whatman GF/C filter (catalog no. 1822-047). Levels of dissolved microcystin concentrations were not significant compared to those of the particulate microcystins in any of the cultures (⬍5% of total). Filters were oven-dried overnight at 60°C, reweighed to determine net dry biomass, and frozen at ⫺20°C for subsequent analysis. Before extraction of microcystins, distilled water was added to all filters and they were refrozen at ⫺20°C. This freeze-thaw cycle ensures a more efficient extraction of the toxins (1). Microcys-tins were extracted using an accelerated solvent extractor (ASE) and 75% meth-anol under conditions of high temperature and pressure to burst the cells and elute the microcystins (1). Each filter was spiked with 50 l of nodularin (catalog no. ALX 350-061-C250; Alexis Biochemicals) (10 ppm) as an internal standard to calculate percent recovery for each sample. In most cases, more than 90% recovery of nodularin was achieved.
Microcystin extracts were analyzed using high-performance liquid chromatog-raphy (HPLC) with photodiode array (PDA) detection (Agilent Technologies 1100 series) and microcystin-LR, -YR, -RR, and -LA (Sigma M2912, M4069, M1537, and M4194) as routine standards. Standard curves were created for each congener by the use of concentrations of 0.05, 0.1, 0.5, 1, 2.5, 5, and 10 ppm. HPLC analysis was conducted using a Zorbax SB-C18 column (150 by 3 by 5 m). A two-step mobile phase, consisting of 0.05% (vol/vol) trifluoroacetic acid (TFA) in water and 0.05% (vol/vol) TFA in acetonitrile, was used. The absor-bance spectrum between 200 and 300 nm of each extract was examined for the presence of a peak at 238 nm, a value characteristic of microcystins. Microcystin concentrations were calculated by comparing the peak area from each sample to the standard curves. Concentrations were then adjusted to account for percent recovery of the nodularin standard.
DNA extraction.Molecular techniques were used to differentiate strains of
Microcystis aeruginosawith the mcyD gene from those without the gene. A subsample of 10 to 20 ml of each of culture was filtered with a Millipore 0.22-m-pore-size membrane filter on days 2, 6, 10, and 14 and immediately placed in a 50-ml Falcon tube and frozen at ⫺20°C pending subsequent analysis. DNA was extracted from each sample by a procedure adapted from Hisbergues et al. (12). Each filter was thawed and then subjected to the following processes: an initial 1-h incubation with 5 mg of lysozyme ml⫺1in TES buffer (50 mM
Tris-HCl [pH 8], 100 mM EDTA [pH 8], 25% sucrose) at 37°C, with gentle mixing on a Roto-Torque rotator (Cole-Parmer, Anjou, Canada); a second 1-h incubation at 37°C, after the addition of proteinase K (150 g ml⫺1); and a third
incubation (2 h) at 50°C in a water bath, with sodium dodecyl sulfate-polyacryl-amide gel electrophoresis (SDS) (2%) followed by a series of chloroform-isoamyl alcohol (24:1) and phenol-chloroform-isoamyl alcohol (25:24:1) extractions. DNA was also treated with RNase A at a final concentration of 100 ng l⫺1,
precipitated overnight in cold propan-2-ol, and subsequently spun down and reconstituted in TE buffer (10 mM Tris-Cl, 1 mM EDTA [pH 8]). DNA was stored at ⫺20°C until further analysis.
Quantitative PCR.Prior to Q-PCR analyses, all DNA extracts were quantified using a Quanti-T PicoGreen double-stranded DNA (dsDNA) assay kit from Invitrogen (Burlington, Ontario, Canada) and a Safire microplate detection system (Tecan, Ma¨nnedorf, Switzerland). DNA samples were then diluted with deionized water to a concentration of 10 ng 䡠 l⫺1(100). All samples were then
requantified using the same PicoGreen method to confirm the final
concentra-VOL. 77, 2011 LIGHT EFFECTS ON MIXED MICROCYSTIS CULTURES 7017
on January 20, 2012 by CANADA INST FOR STI
http://aem.asm.org/
tion of DNA in the dilution. The 100dilution was then further diluted to 10⫺1,
10⫺2, and 10⫺3.
For Q-PCR analysis, three dilutions for each sample were processed in dupli-cate on a RotorGene 6000 Q-PCR cycler (Corbett Research, Mortlake, New South Wales, Australia). The primers used were based on the -ketoacyl syn-thase (KS) portion of the mcyD gene (9). A Quantitect SYBR green PCR kit (Qiagen) and several reagents, including Rnase-free water (Qiagen, Mississauga, Canada), MgCl2(4 mM), an mcyDKSforward primer (20 M), and an mcyDKS
reverse primer (20 M) in a total reaction volume of 20 l (which included 5 l of the 100, 10⫺1, 10⫺2, or 10⫺3DNA dilution), were used for Q-PCR. Positive
and negative controls were included in every Q-PCR run: a standard curve was created using a plasmid from the toxigenic strain of Microcystis aeruginosa UTCC 299 at a concentration of 10⫺6and used as a positive control, and the
nontoxi-genic strain UTCC 632 and 5 mM Tris-Cl were used as the negative controls. Q-PCR conditions were as follows: (i) preheating at 95°C for 10 min and (ii) 45 cycles of 95°C for 10 s, 58°C for 15 s, and 72°C for 20 s.
In order to determine the number of mcyD gene copies per milliliter of culture, the number of gene copies detected via Q-PCR was adjusted based on the total quantity of DNA extracted for each sample. The number of mcyD gene copies detected was first divided by the quantity of DNA processed in each reaction (approximately 10 ng 䡠 l⫺1) to determine the number of gene copies per
nano-gram of DNA. This value was then multiplied by the total quantity of DNA extracted to get the number of mcyD copies per total DNA quantity. That number was divided by the value representing the volume of water filtered for a given sample, and the number of mcyD gene copes per milliliter of water was obtained.
Statistical analysis.One-way analysis of variance (ANOVA) determinations were carried out to determine the effect of light intensity on (i) the growth of each strain of Microcystis, (ii) the growth of all strains under a given light intensity, (iii) microcystin concentration differences among and between cul-tures, and (iv) the number of mcyDKSgene copies (determined for days 2, 6, 10,
and 14) for each culture under conditions of both low and high light intensity. In all statistical analyses, the assumptions of normality, homoscedasticity, and in-dependence were verified using the residuals from each analysis. All statistics were carried out using SYSTAT software (version 11.0; SYSTAT Software, San Jose, CA).
RESULTS
Growth rates.The growth rate of the toxigenic UTCC 300 strain under conditions of low light intensity was not signifi-cantly (P ⬎ 0.05) different from that seen under conditions of high light intensity (Table 1) when growth was measured ac-cording to changes in cell density. However, when changes in optical density were examined, UTCC 300 grew significantly (P ⬍ 0.001) faster under conditions of high light intensity. This was consistent with measurements of dry-weight changes through time, which showed a higher yield under conditions of high light intensity, suggesting an increase in cell size between light treatments. Both nontoxigenic strains had higher growth rates under conditions of low light intensity when growth rates
were calculated from changes in cell density (P ⬍ 0.05); how-ever, calculations of growth rates on the basis of changes in optical density showed that both nontoxigenic strains had higher growth rates when grown under conditions of high light intensity (for UTCC 632, P ⬍ 0.05; for UTCC 633, P ⬍ 0.01). When the growth rates of the unialgal cultures were com-pared, regardless of whether the comparisons were based on cell density or optical density (Table 1), there were no signif-icant differences between UTCC 300, UTCC 632, and UTCC 633 under conditions of low light intensity (P ⬎ 0.05). How-ever, under conditions of high light intensity, there was a sig-nificant difference, with UTCC 300 having the highest growth rate, followed by UTCC 632 and UTCC 633 (P ⬍ 0.05). With respect to the mixed culture of UTCC 300 plus 632 and the mixed culture of UTCC 300 plus 633, both had higher overall growth rates under conditions of low light intensity compared with high light intensity (P ⬍ 0.05) when growth rates were calculated using cell density values. When changes in optical density were used for the calculations, as with the unialgal cultures, the growth rate of the mixed culture of UTCC 300 plus 632 was higher under conditions of high light intensity (P ⬍ 0.05), as was the yield in biomass. For the mixed culture of UTCC 300 plus 633, however, when optical density values were used for the calculations, there was no significant differ-ence between low and high light intensities with respect to growth rates (P ⬎ 0.05).
Microcystin analysis.For UTCC 300 and the mixed culture of UTCC 300 plus 632, there were no significant differences between conditions of high and low light intensity in terms of total microcystin quantities (Fig. 1). For the mixed culture of UTCC 300 plus 633, the total microcystin content was slightly higher under conditions of low light intensity than of high light intensity (P ⬍ 0.01).
Total microcystin numbers were also compared between cul-tures grown under the two sets of light intensity conditions. Under conditions of high light intensity, UTCC 300 produced more microcystin than the mixed cultures of UTCC 300 plus 632 and UTCC 300 plus 633 (P ⬍ 0.001), but the mixed cul-tures produced well over half the quantity of microcystins found in the monoculture. When cultures were grown under conditions of low light intensity, UTCC 300 again produced significantly more microcystin (P ⬍ 0.05) but the mixed cul-tures produced either close to 50% as much as or less than (UTCC 633) the level produced by the monoculture.
Q-PCR analysis.Under conditions of low light intensity, the number of mcyD copies per milliliter increased over time in the UTCC 300 culture, the mixed culture of UTCC 300 plus 632, and the mixed culture of UTCC 300 plus 633 (Fig. 2A). Under conditions of low light intensity, however, there were no sig-nificant differences in the numbers of mcyD copies per millili-ter produced by the three different cultures on any of the 4 days on which they were sampled (days 2, 6, 10, and 14; P ⬎ 0.05). This suggests that there were similar numbers of toxi-genic UTCC 300 cells in each of these cultures throughout the experiment. Under conditions of high light intensity on day 2 (Fig. 2B), there were no significant differences between the three cultures in the number of copies of mcyD (P ⬎ 0.05). By day 6, however, there were significant differences between the three cultures (P ⬍ 0.01), with UTCC 300 having the highest copy number followed by the mixed culture of UTCC 300 plus
TABLE 1. Growth rates of Microcystis aeruginosa strains
Cultured
Microcystis aeruginosa
UTCC strain(s)a
Light intensity (mean ⫾ SD) (n ⫽ 3)b Low (20 mol 䡠 m⫺2 䡠 s⫺1) High (80 mol 䡠 m⫺2䡠 s⫺1) OD CD OD CD 300 0.045 ⫾ 0.005 0.372 ⫾ 0.019 0.074 ⫾ 0.004 0.376 ⫾ 0.015 632 0.041 ⫾ 0.009 0.374 ⫾ 0.010 0.052 ⫾ 0.002 0.331 ⫾ 0.008 633 0.030 ⫾ 0.003 0.392 ⫾ 0.004 0.040 ⫾ 0.002 0.225 ⫾ 0.013 300 ⫹ 632 0.053 ⫾ 0.005 0.328 ⫾ 0.006 0.065 ⫾ 0.003 0.306 ⫾ 0.004 300 ⫹ 633 0.053 ⫾ 0.004 0.329 ⫾ 0.003 0.055 ⫾ 0.002 0.259 ⫾ 0.004 aStrain UTCC 300 is a microcystin producer; strains UTCC 632 and UTCC 633 do not produce microcystins.
bResults represent growth rates (day⫺1) of Microcystis aeruginosa strains
grown individually and in mixed batch cultures as calculated by changes in optical density (OD) or total cell density (CD).
7018 LEBLANC RENAUD ET AL. APPL. ENVIRON. MICROBIOL.
on January 20, 2012 by CANADA INST FOR STI
http://aem.asm.org/
632 and the mixed culture of UTCC 300 plus 633. This trend continued under conditions of high light intensity through days 10 and 14. Under conditions of high light intensity (Fig. 2B) there appeared to be fewer mcyDKScopies per milliliter for all
three cultures at day 14 than were detected under conditions of low light intensity, and yet overall cell counts indicated that there were higher cell densities under conditions of high versus low light intensity.
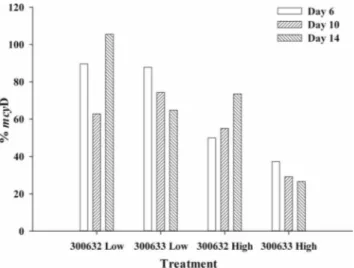
The proportion of toxigenic cells in each mixed culture was determined by dividing the number of mcyD copies per milli-liter determined for each of the mixed cultures by the number of mcyD copies per milliliter determined for the monoculture of UTCC 300 on a given sampling day. For the toxigenic strain, all cells (i.e., 100%) should have been toxigenic genotypes, regardless of the stage of batch growth. Under conditions of low light intensity, the level of mcyD in the mixed cultures was ⬎60% on days 6, 10, and 14 (Fig. 3). Under conditions of high light intensity, the mcyD level in the mixed culture of UTCC 300 plus 632 was also 50% or more of the level seen with UTCC 300, with the percentage appearing to increase with time. However, the mcyD level in the mixed culture of UTCC 300 plus 633 was less than 40% of the UTCC 300 level.
These results suggest that growth of the toxigenic UTCC 300 strain was dominating that of both nontoxigenic strains under conditions of low light intensity, whereas growth of the non-toxigenic UTCC 633 strain under conditions of high light in-tensity dominated that of UTCC 300. However, the results should also be examined with respect to changes in cell density: under conditions of low light intensity, there was a significant linear relationship between the number of mcyD copies per milliliter and cell density in the UTCC 300 monoculture, the mixed culture of 300 plus 632, and the mixed culture of 300 plus 633 (P ⬍ 0.05) (data not shown). Under conditions of high light intensity, however, whereas mcyD gene copy numbers were increasing over time in the UTCC 300 culture and in the
mixed culture of UTCC 300 plus 632, there appeared to be a flatter relationship between gene copy number and elapsed time for the mixed culture of UTCC 300 plus 633 (Fig. 2B); the results obtained by plotting mcyD copies per milliliter versus cell density showed the same trend. Under conditions of high light intensity, the slopes of the regression equations of cell density versus mcyD copy number for the UTCC 300 culture and the mixed culture of UTCC 300 plus 632 were very similar (0.23 compared with 0.24); however, the slope of the regression for the mixed culture of UTCC 300 plus 633 was flat (0.02). This indicates that growth of UTCC 300 was not increasing over time in the mixed culture of UTCC 300 plus 633 under conditions of high light intensity, and UTCC 633 appeared to outcompete UTCC 300 based on the lack of increase in mcyD gene copy numbers as time passed and cell density increased. Another way of expressing the results is to calculate the gene copy number per Microcystis cell (regardless of the strain) under the two sets of light treatment conditions. Under con-ditions of low light intensity during the exponential phase of growth (around day 10), the mixed cultures had per cell gene copy numbers of 2.0 (for the mixed culture of UTCC 300 plus 632) and 0.865 (for the mixed culture of UTCC 300 plus 633) compared to 1.50 for the monoculture.
DISCUSSION
In aquatic environments, there are two main factors that can affect light quality and quantity: the depth of the mixed layer (the epilimnion) and its turbidity. Turbidity increases as bio-mass increases and thus may favor those organisms adapted to lower light intensities (26). In this study, not only was light manipulated by growing the cultures at two different light in-tensities, but light resources became reduced over time as biomass increased within each batch culture. In this study, there were no significant differences in terms of the intrinsic
FIG. 1. Total microcystin content of the toxigenic strain alone (UTCC 300) and of mixed cultures that included nontoxigenic strains (UTCC 300 plus 632 and UTCC 300 plus 633) (data represent micrograms per gram of dry weight ⫾ standard errors [SE]; n ⫽ 3) in early stationary phase under growth conditions of low versus high light intensity.
VOL. 77, 2011 LIGHT EFFECTS ON MIXED MICROCYSTIS CULTURES 7019
on January 20, 2012 by CANADA INST FOR STI
http://aem.asm.org/
growth rates of the three strains of Microcystis aeruginosa un-der conditions of low light intensity (Table 1). Therefore, in theory, if no one strain had a particular growth advantage, the expected result in a mixed-culture experiment would be a 50/50 mix of any two strains. Yet, under conditions of low light intensity, the number of mcyD copies in the mixed cultures was greater than 50% of the number of mcyD copies of the toxi-genic monoculture (UTCC 300) on all the days of batch growth tested (Fig. 2 and 3). This suggests that the toxigenic strain was the superior competitor for light. In contrast, although UTCC 300 had a much higher intrinsic growth rate than UTCC 632 or UTCC 633 under conditions of high light intensity (Table 1), the latter nontoxigenic strain ended up dominating the toxi-genic UTCC 300 in the mixed cultures (Fig. 3).
Further evidence that the toxigenic strain most likely out-competed the nontoxigenic strains under conditions of low light intensity comes from the chemical analyses of the total microcystin: the mixed cultures under conditions of low light intensity contained significantly more than half of the total microcystin numbers determined for the monocultures of the toxigenic strain under the same conditions (Fig. 1). Interestingly, while the mixed culture with UTCC 633 showed higher microcystin numbers than the other mixed culture (with UTCC 632) under conditions of low light in-tensity, the converse was true for the mcyD gene copy num-bers (Fig. 2). However, the two variables are not the same: microcystins have a tendency to persist long after popula-tions have begun to senesce and DNA is no longer
func-FIG. 2. mcyDKSgene copy numbers per milliliter (⫾SE; n ⫽ 3) over time (in days) for Microcystis aeruginosa UTCC 300 cultures and mixed
cultures of UTCC 300 plus 632 and UTCC 300 plus 633 grown under conditions of low (A) and high (B) light intensity.
7020 LEBLANC RENAUD ET AL. APPL. ENVIRON. MICROBIOL.
on January 20, 2012 by CANADA INST FOR STI
http://aem.asm.org/
tional (19). It is possible that cell death dynamics were different in the two cultures.
Previous studies have suggested that microcystins may play a role in light adaptation processes (11, 15). In this study, there was no significant increase in microcystin production at low light intensity that might indicate that the toxigenic strain was increasing microcystin production to facilitate acclimation to low light. For this toxigenic strain of Microcystis aeruginosa, there was no significant difference between conditions of high and low light intensity in terms of microcystin content; this is consistent with the similar intrinsic growth rates associated with the two light levels, although biomass volume was higher under conditions of high light intensity. Therefore, production of microcystins per se does not appear to be a driving factor in explaining the dominance of UTCC 300 under conditions of low light intensity. Compared to other toxigenic strains de-scribed, including those used in competition experiments (see, e.g., references 5, 16, and 31), UTCC 300 has a relatively high microcystin cell content (274 to 300 fg 䡠 cell⫺1
) such that the cost of the investment in microcystin production should, at least in theory, be substantial. Two of the main microcystin congeners (microcystin-LR and [Dha7]desmethylmicrocystin-LR) were detected, and the relative proportions of these geners did not differ under the two sets of light intensity con-ditions or between the mixed cultures. This is in contrast to the significant shift in microcystin congener composition as a func-tion of increasing light intensity observed in a study of Plank-tothrix agardhii(29).
Overall, the results of this study are in contrast to those of another mixed culture study with Microcystis aeruginosa (16) but are consistent with those of a study examining another microcystin-producing cyanobacterium, Planktothrix agardhii (5). In the first study, Kardinaal et al. examined how compe-tition for light would affect the dominance of toxigenic or nontoxigenic strains of Microcystis aeruginosa. In the two cases examined, the toxigenic strains lost to the nontoxigenic strains in the competition for light and the toxigenic strain was com-pletely replaced by the nontoxigenic strain within approxi-mately 2 weeks. Even when the toxigenic strain was given a
significant advantage in terms of the numbers of cells at the start of the experiment, the nontoxigenic strain still grew to dominate. However, one of the pairs of strains examined was a toxigenic strain that included the photosynthetic accessory pig-ment phycoerythin (PE), whereas the nontoxigenic strain did not have PE, and this difference might explain the dominance of the former over the latter under conditions of low light intensity (16).
In contrast, in the present study, only when light resources were greater did both nontoxigenic strains fare better than the toxigenic strain. This is in agreement with the results of a study by Briand et al. (5), who found that under growth-limiting conditions the microcystin-producing strains of Planktothrix aghardiiexhibited greater fitness than non-microcystin-produc-ing strains and concluded that, while microcystin production may involve high energy costs for toxigenic cells, the benefits of producing microcystins under growth-limiting conditions, for whatever purpose, outweighed the cost (5).
Conclusion. These results do not support the hypotheses that (i) microcystins are agents of acclimation or adaptation to low light and that (ii) microcystins are costly to produce and a hindrance in competition for limiting resources. Microcystins may in fact provide some (as yet unknown) advantage negating any extra metabolic cost. However, few studies of this type that included both toxigenic and nontoxigenic cyanobacteria have been conducted, and other types of limiting resources, as well as other species and strains of cyanobacteria, need to be con-sidered. It should be noted also that in this and other studies, it is assumed that the genome copy number per cell is not changing; however, cyanobacteria have been known to exhibit changes in those numbers (3). Furthermore, other traits may be more important in determining why one strain has a com-petitive advantage over another. Cyanobacteria produce a wide range of other peptide-like compounds (see, e.g., refer-ences 24 and 30) whose involvement in competitive interac-tions could be as significant as that of the microcystins.
ACKNOWLEDGMENTS
This work was supported by the NSERC (Natural Sciences and Engineering Research Council of Canada) Discovery Grant program. We thank Charles Greer (National Research Council, Montreal, Canada) for advice in microbial molecular biology and Ammar Saleem (Laboratory for the Analysis of Natural and Commercial Environmen-tal Toxins, University of Ottawa) and Rocio Aranda-Rodriguez (Health Canada, Ottawa) for advice on chemical analysis of microcys-tins. Michael Quilliam (National Research Council, Halifax) con-firmed the identities of microcystin congeners.
REFERENCES
1. Aranda-Rodriguez, R., et al. 2005. Pressurized liquid extraction of toxins from cyanobacterial cells. Environ. Toxicol. 20:390–396.
2. Babica, P., L. Blaha, and B. Marsalek. 2006. Exploring the natural role of microcystins—a review of effects on photoautotrophic organisms. J. Phycol.
42:9–20.
3. Becker, S., M. Fahrbach, P. Bo¨ger, and A. Ernst. 2002. Quantitative tracing, by Taq nuclease assays, of a Synechococcus ecotype in a highly diversified natural population. Appl. Environ. Microbiol. 68:4486–4494.
4. Bozarth, C. S., A. D. Schwartz, J. W. Shepardson, F. S. Colwell, and T. W.
Dreher.2010. Population turnover in a Microcystis bloom results in predom-inantly nontoxigenic variants late in the season. Appl. Environ. Microbiol.
76:5207–5213.
5. Briand, E., C. Ye´pre´mian, J. F. Humbert, and C. Quiblier. 2008. Competi-tion between microcystin- and non-microcystin-producing Planktothrix
agard-hii(cyanobacteria) strains under different environmental conditions. Envi-ron. Microbiol. 10:3337–3348.
6. Reference deleted.
FIG. 3. Percentages of mcyDKScopies relative to a pure culture of
UTCC 300 for the mixed cultures of UTCC 300 plus 632 and UTCC 300 plus 633 grown under conditions of low and high light intensity.
VOL. 77, 2011 LIGHT EFFECTS ON MIXED MICROCYSTIS CULTURES 7021
on January 20, 2012 by CANADA INST FOR STI
http://aem.asm.org/
7. Codd, G. A., and G. Bell. 1985. Eutrophication and toxic cyanobacteria in freshwaters. Water Pollut. Control 84:225–231.
8. Fogg, G. E., and B. Thake. 1987. Algal cultures and phytoplankton ecology. The University of Wisconsin Press, Madison, WI.
9. Fortin, N., et al. 2010. Detection of microcystin-producing cyanobacteria in Mississquoi Bay, Quebec, Canada, using quantitative PCR. Appl. Environ. Microbiol. 76:5105–5112.
10. Graham, J. L., J. R. Jones, S. B. Jones, J. A. Downing, and T. E. Clevenger. 2004. Environmental factors influencing microcystin distribution and con-centration in the Midwestern United States. Water Res. 38:4395–4404. 11. Hesse, K., E. Dittmann, and T. Bo¨rner. 2001. Consequences of impaired
microcystin production for light-dependent growth and pigmentation of
Mi-crocystis aeruginosaPCC 7806. FEMS Microbiol. Ecol. 37:39–43. 12. Hisbergues, M., G. Christiansen, L. Rouhiainen, K. Sivonen, and T. Bo¨rner.
2003. PCR-based identification of microcystin-producing genotypes of dif-ferent cyanobacterial genera. Arch. Microbiol. 180:402–410.
13. Huisman, J., R. R. Jonker, C. Zonneveld, and F. J. Weissing. 1999. Compe-tition for light between phytoplankton species: experimental tests of mech-anistic theory. Ecology 80:211–222.
14. Janse, I., et al. 2004. Toxic and nontoxic Microcystis colonies in natural populations can be differentiated on the basis of rRNA gene internal tran-scribed spacer diversity. Appl. Environ. Microbiol. 70:3979–3987. 15. Kaebernick, M., B. A. Neilan, T. Bo¨rner, and E. Dittmann. 2000. Light and
the transcriptional response of the microcystin biosynthesis gene cluster. Appl. Environ. Microbiol. 66:3387–3392.
16. Kardinaal, W. E. A., et al. 2007. Competition for light between toxic and nontoxic strains of the harmful cyanobacterium Microcystis. Appl. Environ. Microbiol. 73:2939–2946.
17. Kardinaal, W. E. A., et al. 2007. Microcystis genotype succession in relation to microcystin concentrations in freshwater lakes. Aquat. Microb. Ecol. 48: 1–12.
18. Kurmayer, R., and T. Kutzenberger. 2003. Application of real-time PCR for quantification of microcystin genotypes in a population of the toxic cyano-bacterium Microcystis sp. Appl. Environ. Microbiol. 69:6723–6730. 19. Lahti, K., J. Rapala, M. Fardig, M. Niemela, and K. Sivonen. 1997.
Persis-tence of cyanobacterial hepatotoxin microcystin-LR in particulate material and dissolved lake water. Water Res. 31:1005–1012.
20. Lyck, S. 2004. Simultaneous changes in cell quotas of microcystin, chloro-phyll a, protein and carbohydrate during different growth phases of a batch culture experiment with Microcystis aeruginosa. J. Plankton Res. 26:727–736.
21. Pick, F. R., and D. R. S. Lean. 1987. The role of macronutrients (C, N, P) in controlling cyanobacterial dominance in temperate lakes. N. Z. J. Mar. Freshw. Res. 21:425–434.
22. Porter, K. G., and R. McDonough. 1984. The energetic cost of response to blue-green algal filaments by cladocerans. Limnol. Oceanogr. 29:365–369. 23. Rinta-Kanto, J. M., et al. 2009. Lake Erie Microcystis: relationship between
microcystin production, dynamics of genotypes and environmental parame-ters in a large lake. Harmful Algae 8:665–673.
24. Rohrlack, T., R. Skulberg, and O. M. Skulberg. 2009. Distribution of oligo-peptide chemotypes of the cyanobacterium Planktothrix and their persistence in selected lakes of Fennoscandia. J. Phycol. 45:1259–1265.
25. Sabart, M., et al. 2010. Spatiotemporal variations in microcystin concentra-tions and in the proporconcentra-tions of microcystin-producing cells in several
Micro-cystis aeruginosapopulations. Appl. Environ. Microbiol. 76:4750–4759. 26. Sedmak, B., and G. Kosi. 1998. The role of microcytins in heavy
cyanobac-terial bloom formation. J. Plankton Res. 20:691–708.
26a.Sivonen, K., and G. Jones. 1999. Cyanobacterial toxins, p. 55–124. In I. Chorus and J. Bartram (ed.), Toxic cyanobacteria in water: a guide to their public health consequences, monitoring, and management. World Health Organization, Geneva, Switzerland.
27. Stein, J. R. (ed.). 1973. Handbook of phycological methods. Culture methods and growth measurements. Cambridge University Press, London, United Kingdom.
28. Tilman, D. 1977. Resource competition between planktonic algae: an exper-imental and theoretical approach. Ecology 58:338–348.
29. Tonk, L., et al. 2005. The microcystin composition of the cyanobacterium
Planktothrix agardhiichanges toward a more toxic variant with increasing light intensity. Appl. Environ. Microbiol. 71:5177–5181.
30. Welker, M., and H. von Do¨hren. 2006. Diversity of cyanobacterial peptides– nature’s own nonribosomal combinatorial biosynthesis. FEMS Microbiol. Rev. 30:530–563.
31. Wiedner, C., et al. 2003. Effects of light on the microcystin content of
Microcystisstrain PCC 7806. Appl. Environ. Microbiol. 69:1475–1481. 32. Yamamoto, Y., and H. Nakahara. 2005. Competitive dominance of the
cya-nobacterium Microcystis aeruginosa in nutrient-rich culture conditions with special reference to dissolved inorganic carbon uptake. Phycol. Res. 53:201– 208.
33. Young, F. M., C. Thomson, J. S. Metcalf, J. M. Lucocq, and G. A. Codd. 2005. Immunogold localization of microcystins in cryosectioned cells of
Mi-crocystis. J. Struct. Biol. 151:209–214.
7022 LEBLANC RENAUD ET AL. APPL. ENVIRON. MICROBIOL.