Contents lists available atScienceDirect
Sustainable Cities and Society
journal homepage:www.elsevier.com/locate/scsA detailed study of climate change and some vulnerabilities in Indian Ocean:
A case of Madagascar island
Modeste Kameni Nematchoua
a,b,e,⁎, Paola Ricciardi
a,e, José A. Orosa
c,e, Cinzia Buratti
d,eaDepartment of Civil Engineering and Architecture, University of Pavia, Via Ferrata1, 27100 Pavia, Italy bFluid and Energy Laboratory, University of Antsiranana, Madagascar
cDepartment of Energy and M.P., E.T.S.NyM.UniversityofACoruna˜Paseode Ronda51, 15011, Spain dDipartment of Industrial Engineering, University of Perugia, via G. Duranti 67, 06125 Perugia, Italy eDepartment of Chemistry, University of Pavia, 27100 Pavia, Italy
A R T I C L E I N F O Keywords: Vulnerability Climate change Detailed study Madagascar A B S T R A C T
Climate change continues to remain the main concern of all nations, and the adverse effects of this problem are enormous. This research was aimed to study the variation of outdoor climate in some regions of Madagascar, and also the assessment of impacts and vulnerabilities related to global warming. Toward this end, the daily data relating to the last 44 years have been studied. Afirst analyse has been carried out with several GCMs models, and scenarios(A2, A1B and B1), then RCM models associated to Representative Concentration Pathway(RCP) scenarios(RCP2.6, RCP4.5, RCP 6.0 and RCP 8.5). Chi-square Pearson tests and probabilities have been assessed to compare observed values and generated values. A significant values showed(P < 0.05). Finally, INCM3 model and A2 scenario showing an important correlation coefficient Pearson was used to carried out the fore-casting in many cities in Madagascar.The results that were obtained show that temperature evolves more rapidly in the dry season than in the rainy season in these regions. An increase of more than 2 °C will be observed over the next decade. From 1990–2015, the degree of heat enhancement and multiple flooding resulted in the fall in farm production of more than 50%. In 1971, only two of cholera were registered in all the country. This number has increased up to 29,305 in 2000. In some areas, rice production had dropped by 75% between 2012 and 2014. Moreover, 3000 people were affected by “storms” between 1981 and 1989. The dry season was prolonged in recent years in areas with humid climate, and the degree of humidity decreased to 10% in the hot tropical climate. The prevalence of malnutrition increased conditions of vulnerability on every front.
1. Introduction
Climate has always had a powerful impact on the health and well-being of humans. Changes in rainfall are typically harder to detect (Rabefitia, Randriamarolaza, & Rakotondrafara, 2008; Tadross, Randriamarolaza, Rabefitia, & Yip, 2008). The reasons and causes of climate change are mainly natural, but have also been influenced by human actions. The consequences of this scourge have altered the carbon cycle. The greenhouse effect is the main cause for this. Several summit conferences bringing together researchers, businessmen, and policies have been convened to study these problems. Comments are direct, but its provisions are not always respected by the developed countries. Although the consequences are visible everywhere in the world, the poorest countries of Africa and Asia are the most badly af-fected. Climate change poses unique threats to human health including direct threats from heat waves or storms, and indirect effects, such as
heat-exacerbated air quality impacts on health (Milen Dyoulgerov, 2011). It is widely accepted that there has been a detectable rise in global temperature during the last few years. In some regions, an in-crease of 4 °C in temperature has been provided for each century. The International Panel on Climate Change (IPCC), since its creation in 1988 by the World Meteorological Organization (WMO), established several reports, thanks to the results of several environmental specia-lists who helped humanity in the fight against this phenomenon (Solomon et al., 2007;IPCC, 2007a;IPCC, 2007b;IPCC, 2014). Changes in the physical systems of coastal zones related to regional warming trends include trends in sea ice and coastal conditions (Hughes, 2000). Several studies have shown that changes in the external climate were not the same in all regions (Goldemberg, 2000;Roshan & Orosa, 2012; Delfani, Karami, & Pasdarshahri, 2010; Onerc, 2007;Jetten & Focks, 1997;Joussaume et al., 2006;Lacaux, T, & ourre, 2006;Lacaux et al., 2007). Climate change was expected to alter pest and disease outbreaks,
https://doi.org/10.1016/j.scs.2018.05.040
Received 9 January 2018; Received in revised form 24 February 2018; Accepted 23 May 2018
⁎Corresponding author at: Department of Civil Engineering and Architecture, University of Pavia,Via Ferrata1,27100 Pavia, Italy.
E-mail addresses:kameni.modeste@yahoo.fr(M.K. Nematchoua),paola.ricciardi@unipv.it(P. Ricciardi),jaorosa@udc.es(J.A. Orosa),cinzia.buratti@unipg.it(C. Buratti).
Available online 26 May 2018
2210-6707/ © 2018 Elsevier Ltd. All rights reserved.
increase the frequency and severity of droughts andfloods, and increase the likelihood of poor yields, crop failure, and livestock mortality (Kevan, 1999). The paradoxical curse of climate change is that those who have contributed the least to its causes are those who are suffering most from its effects (Angie, 2011;Patricia & Farmer, 2014). There is an urgent need for the global community to focus its attention on identi-fying adaptation measures that can help poor countries to reduce their vulnerability to climate change. The choice of Madagascar as the place for this study was not made randomly; Madagascar, according to WMO, is considered as the third-ranking country in the world that is most vulnerable to climate change. Many global risks of climate change are concentrated in urban areas (IPCC, 2014). The continental drift has shown that India, Australia, Madagascar, Southern Africa and America were unified in a land called "Gondwana", and that after 240 million years this continent broke up to form the present continents. The island of Madagascar has many potential resources. Madagascar has a variety of landscapes of extraordinary diversity. The geographic isolation of Madagascar, and the variety of climates and reliefs existing there, are favorable to the development of fauna andflora that are most unique in the world. Farmers are frequently exposed to pest and disease outbreaks and extreme weather events, which cause significant crop and income losses, and exacerbate food insecurity (Harvey et al., 2014). Mada-gascar is ranked among those countries that are rich in solar energy, with an estimated potential of around 2000 kW h/m²/year. Mada-gascar’s largely rural population mainly depends on subsistence agri-cultural activities, which contribute to habitat degradation, particularly loss of forest (Andrade, Herrera, & Cazzolla, 2010). Several areas of the island have over 2800 h of sunshine per year. According to the report of the Diagnosis of Energy Sector (Rapport, 2012), Madagascar has a po-tential of over 2000 MW of wind power. The biomass represents about 90% of the primary energy resources used in the country (Friedrich-E, 2013). All these natural resources are highly threatened by the in flu-ence of climate change. Madagascar has severe problems with soil erosion and deforestation, which reduces soil fertility and productivity, increasing the vulnerability of agriculture andfishing-based livelihoods (WSUP, 2015). In recent years in the country, agricultural production fell by almost 20%, while the disease rate due to drought has been on the rise. During these past 25 years, the number of violent cyclones (with superior winds up to 150 km/h) has doubled. Tropical cyclones are a prominent feature of Madagascar’s climate, often leading to heavy rainfall and strong winds, which can cause significant damage and loss of life (Tadross et al., 2008).
Madagascar, despite the efforts made up to now, remains one of those countries in the world that is most vulnerable to climate change. This work presents, in detail, the instability and vulnerability of Madagascar in the face of climate change, and encourages the business leaders, international bodies, private companies and the Malagasy po-pulation to support the government in its policy of fighting against climate change.
2. Materials and methods
2.1. Study area
Located between 20 °S and 47 °E, Madagascar lies almost entirely within the tropical region. It is an island in the Indian Ocean, covering an area of 592,000 km². It is the fourth largest island in the world, and is separated from Africa by about 400 km by the Mozambique Channel. A mountainous spine of 1200–1500 m runs through the island from the north to the south along its length. This geographic situation, the landform, the maritime influence, and wind conditions aid in causing extremely varied climatic conditions encountered on the island. There are basically two seasons in Madagascar: dry from May to October, and rainy from November to April. Two short seasons of approximately 1 month duration separate these two seasons. From May to October, the climate is conditioned by an anticyclone to the Indian Ocean level that
directs a wind regime of trade winds to the southeastern part of Madagascar. During this season, the eastern part of the island experi-ences a humid climate“in the wind”, while the western part undergoes a drought-like climate termed“down wind”. In this section, we shall discuss about dry season or cool season (or winter) depending on the altitude of the region. During the summer or the warm seasons, the anticyclone of the Indian Ocean weakens, and the trade wind regime becomes less regular, although the eastern part of Madagascar always remains under this influence. During this season, unstable storm-like conditions develop almost daily in all the regions. The Intertropical Convergence Zone extends its influence intermittently on Madagascar. The southwest coast experiences rainfall of 350 mm to nearly 4000 mm. Some climatic characteristics of different regions are listed inTables 1 and 2.
2.2. Climatic data
The daily outdoor data pertaining to the past 44 years (1961–2005) for temperature (minimum and maximum), precipitation, and sunshine were obtained from 16 meteorological stations(Laboratory of dynamic meteorology-Marie-Curie University, Paris). The various data were measured from 3 to 10 m in height from the ground, with a frequency of 10–15 min. According to (Tadross et al., 2008, in Madagascar, the an-nual average temperature was 14–27.5 °C. On the coast, the tempera-ture changed with the latitude and ranged from 27 °C in the north and 23 °C in the south. The west coast is warmer than the east coast by Table 1
The geographical coordinates of the zones studied in MAGICC (Google Map Madagascar).
Region City Latitude Longitude Altitude(m)
1 Antsiranana 12°28S 49°28E 50 2 Mahajunga 15°43S 46°19E 22 3 Morondava 20°17S 44°19E 08 4 Toliara 23°21S 43°40E 11 5 Taolagnaro 27°10S 47°01E 129 6 Mahanoro 19°54S 48°48E 03 7 Toamasina 18°09S 49°24E 06 8 Sainte-Marie 14°47 N 60°59O 767 9 Sambava 14°10S 50°06E 10 10 Maevatana 13°52S 48°70E 70 11 Antananarivo 18°54S 47°31E 1276 12 Antsirabe 19°51S 47°02E 1500 13 Fianarantsoa 21°27S 47°05E 1115 14 Vohemar 13°22S 50°00E 10 15 Ambohitsilaozana 17°41S 48°27E 761 16 Farafangana 12°34S 49°17E 1200 Table 2
Some characteristics of study regions(Modeste Kameni, 2017; Ministy of Population, 2014).
Region Area(km2) Population(2014) Climate
1 43406 260000 Transition tropical 2 150023 2463185 Transition tropical
3 46121 70000 Humid tropical
4 16140 161405 Hot and semi-arid
5 878 46000 Humid tropical 6 3968 238467 Humid tropical 7 71911 3807075 Humid tropical 8 200 74948 Altitude tropical 9 4780 339250 Humid tropical 10 30 025 236 500 Humid tropical 11 58283 5932607 Altitude tropical 12 16599 250245 Altitude tropical 13 103272 4586775 Altitude tropical 14 8269 255080 Transition tropical 15 31 948 118194 Semi-arid tropical 16 5360 587041 Altitude tropical
1–3 °C. On the plateaus, the average annual temperature is 14–22 °C. The average temperature reaches its minimum in July across the country, while the maximum is encountered in January and February at most regions, except in a few places in The Highlands and the northwest region, where the maximum temperature was noted in November. Ac-cording to thesefigures, in Madagascar, warming began in the southern part in 1950 and then spread to the north by 1970. In 2000, the warming level of the southern part of Madagascar was more noticeable than that of the north. The dry sequences lie in the Central Highlands and the eastern coast. On The Highlands, this is due to the decline in the rainy season. The changes in precipitation in Madagascar vary from one region to that in another. Rainfall has become more intense in the western region. Over the past 100 years, the level of rainfall in Mada-gascar has seen large variability. In the southern part, rainfall increases with temperature. In the northern part, precipitation increases with decreasing temperature. The annual precipitation decreases from the east to the west, with a maximum of 3700 mm/year, and from the north to the south with a minimum of 350 mm/year, while the seasonal in-creases take place in the same directions. From the west to the south, the dry season becomes longer and more and more pronounced (IPCC, 2001).
2.3. Climate change models
Several types of models and different scenarios can be used to si-mulate the variation in air temperature and rate of precipitation. Firstly, we used 13 GCM models (BCM2,CGMR,CNCM3,FGOALS, HADCM3,INCM3,IPCM4,NCCCSM…), and three scenarios A2 and A1B and B1. The A2 scenario (society will continue to use fossil fuels at a moderate rate, there will be less economic integration, and populations will continue to increase), and A1B (a future world in which economic growth will be very fast, and new and more efficient technologies will be rapidly introduced). Then, RCM models associated to Representative Concentration Pathway(RCP) scenarios(RCP2.6, RCP4.5, RCP 6.0 and RCP 8.5).For instance, CMIP5 (Coupled Model Inter-comparison Project 5) used four RCPs identified by the stabilization value of the radiative forcing (in W m-2): the lowest RCP, RCP2.6 (also referred as RCP3-PD), which peaks at 3 W m-2 and then declines to approximately 2.6 W m-2 by 2100; the medium-low RCP4.5 and the medium-high RCP6.0 aiming for stabilization at 4.5 and 6.0 W m-2 respectively around 2100; and the highest one, RCP8.5, which implies a radiative forcing of 8.5 W m-2 by 2100. IPCC AR5 settled for RCP4.5. The simulation with RCM models required the computers with important memory, also an enormous calculate time. It is seen inFig. 1that, RCP8.5 is the highest, A2, and A1B scenarios are more significant than new scenarios(RCP4.5 and RCP6.0), the RCP2.6 is the lowest.
In fact, several discrepancies between the results of RCMs and GCMs have been found in recent studies (e.g.Mariotti, Coppola, Sylla, Giorgi, & Piani, 2011;Mariotti, Diallo, Coppola, & Giorgi, 2014;Laprise et al., 2013; Teichmann et al., 2013; Bouagila & Sushama, 2013; Saeed, Haensler, Weber, Hagemann, & Jacob, 2013; Coppola et al., 2014).Meanwhile, the projected increase of seasonal temperature is found to be relatively similar between GCMs and RCM, although large differences (more than 1 °C) exist locally. Differences are also found for extreme-event related quantities, such as the spread of the upper end of the maximum temperature probability distribution function and, in turn, the duration of heat waves. The historical runs, forced by observed natural and anthropogenic atmospheric composition, cover the period from 1950 until 2005, whereas the projections (2006–2100) are forced by two Representative Concentration Pathways (RCP) (Moss et al., 2010;van Vuuren et al., 2011), namely, RCP4.5 and RCP8.5.
The most significant input of GCM models is the rate of emission of greenhouse gases in the future eras. However, a precisefinal determi-nation is not possible. Accordingly, different emission scenarios invol-ving a variety of gases have been considered for the future. On the other hand, to define the effect of global warming by means of the rise in global temperature.
LARS-WG was known as one of best software used to carried-out a forecast in tropical climate. by IPPC.LARS-WG was used for the simu-lation of weather data at a single site (Racsko, Szeidl, & Semenov, 1991; Semenov, Brooks, Barrow, & Richardson, 1998; Semenov & Brooks, 1999), under both current and future climate conditions. These data are in the form of daily time-series for a suite of climate variables, namely, precipitation (mm), maximum and minimum temperatures (°C), and solar radiation (MJm−2day−1). Stochastic weather generators were originally developed for two main purposes:
1. To provide a means of simulating synthetic weather time-series with statistical characteristics corresponding to the observed statistics at a site, but which were long enough to be used in an assessment of risk in hydrological or agricultural applications.
2. To provide a means of extending the simulation of weather time-series to unobserved locations, through the interpolation of the weather generator parameters obtained from running the models at neighboring sites. Thefirst version of the LARS-WG weather generator was devel-oped in Budapest in 1990 as part of the Assessment of Agricultural Risk in Hungary, a project funded by the Hungarian Academy of Sciences (Racsko et al., 1991). The main focus of this work was to overcome the limitations of the Markov chain model of precipitation occurrence (Richardson, 1981). This widely used method of modeling precipitation occurrence (which generally considers two precipitation states, wet or dry, and considers conditions on the previous day only) is not always able to correctly simulate the maximum length of the dry spell, which is crucial for a realistic assessment of agricultural production in some regions of the world, Hungary included. This resulted in the new “series” approach, in which the simulation of dry and wet spell lengths is thefirst step in the weather-generation process. A modified version of this weather generator, now called LARS-WG (the location at which it was developed in its current form), was used in the construction of the climate change scenarios used in two major European Union-funded research projects examining the impacts of climate change on agri-cultural potential in Europe, i.e., CLAIRE (Harrison, Butterfield, & Downing, 1995) and CLIVARA (Downing, Harrison, Butterfield, & Lonsdale, 2000). LARS-WG is based on the series weather generator described in (Racsko et al., 1991). It utilizes semiempirical distributions for the lengths of wet and dry day series, daily precipitation, and daily solar radiation. The semiempirical distribution Emp= {a0, ai; hi, i = 1,.
…,10} is a histogram with 10 intervals, (ai-1, ai), where ai-1< ai, and hi
denotes the number of events from the observed data in the i-th in-terval. Random values from the semiempirical distributions are chosen byfirst selecting one of the intervals (using the proportion of events in each interval as the selection probability), and then selecting a value within that interval from the uniform distribution. For solar radiation, Fig. 1. Evolution of the radiative balance of the earth over the period
the intervals (ai-1, ai) are equally spaced between the minimum and
maximum values of the observed data for the month, whereas for the lengths of dry and wet series and for precipitation, the interval size gradually increases as i increases. In the latter two cases, there are ty-pically many small values, but also a few very large ones, and this choice of interval structure prevents a very coarse resolution being used for the small values. The simulation of precipitation occurrence is modeled as alternate wet and dry series, where a wet day is defined to be a day with precipitation > 0.0 mm. The length of each series is chosen randomly from the wet or dry semiempirical distribution for the month in which the series starts. In determining the distributions, ob-served series are also allocated to the month in which they start. Daily minimum and maximum temperatures are considered as stochastic processes with daily means and daily standard deviations conditioned on the wet or dry status of the day. The technique used to simulate the process is very similar to that presented in (Racsko et al., 1991). The seasonal cycles of means and standard deviations are modeled byfinite Fourier series of order 3, and the residuals are approximated by a normal distribution. The Fourier series for the mean is fitted to the observed mean values for each month. In this assessment, Madagascar’s temperature data in the time intervals of 1901–2000 were selected as the basic data, and the temperature changes for the years 1961–2005 were studied based on the proposed scenario such that the proper model accords with the experimental data of temperature in the pro-posed years. After testing the best model with Pearson correlation coefficient, the changes in the temperatures of the 16 regions of Ma-dagascar were predicted in the worldwide heating bed for a 100-year period (2000–2100).
2.4. Others sectors
The results of this study concerning other sectors threatened by the effects of climate change were obtained following the interviews with farmers, medical personnel,fishermen, and business leaders, and the data from several international bodies, private companies, and para-statals, among others.Fig. 2illustrates the distribution of rainfall and temperature over Madagascar.
3. Results and discussions
Chi-square Pearson tests showed a almost linear trends with future generated values.
3.1. Study of outdoor variation climate in some regions in Madagascar
3.1.1. Case of center
The following equations were established after analysis of the evo-lution of different temperatures in Antananarivo City, as in (Modeste Kameni, Tchinda, Roshan, Ricciardi, & Nasrabadi, 2015).
Δtmax= 0.032·τ (1)
Δtmin= 0.029·τ (2)
where,ΔtmaxandΔtminare the maximum and minimum annual
tem-perature increment (°C), respectively, andτ is the time (years). Eqs (1) and (2), show that in Madagascar’s capital, the maximum and minimum annual temperature increase of (0.032 °C and 0.029 °C), respectively, with a trend significance of 99% confidence level. These equations can be established for every city in this region.
Fig. 3shows the temperature variation in three major regions: An-tananarivo (hot and humid tropical climate of altitude), Antsirabé (cold and humid tropical climate of altitude), and Ambohitsilaozana (humid tropical climate), located in the center of Madagascar, in the period from 1960 to 2100. These different regions are divided between the altitude tropical climate. The original temperature incrementation was selected from 1960, which represents the year when the temperature
first began to increase in this region for most cities. The rate of pre-cipitation increases when the temperature decreases. After about 100 years, in the central region of Madagascar, the minimum annual tem-perature is estimated to increase by 2.0 °C and 3.1 °C, respectively, with the maximum annual temperature increase of 1.3–4.3 °C, in comparison to that in the period between 1901 and 2000.
3.1.1.1. Case of variation in the annual maximum temperature. The maximum annual temperature increases are 0.032, 0.043, and 0.013 °C (Fig. 3a, c, and e) in the hot and humid tropical climate of altitude (Antananarivo), cold and humid tropical climate of altitude (Antsirabé), and tropical humid climate of altitude (Ambohitsilaozana), respectively. Unless something is done to fight against the climate change, a maximum increase in temperature of 1.3, 0.875, and 1.075 °C is expected in the dry season, rainy season, and yearly, respectively, for 2025, as compared to that in the 1960–2000 period. In the cold and humid tropical climate of altitude (Antsirabé), during the same year (2025), the maximum temperature increase of up to1.3, 0.85, and 1.075 °C is expected in the dry season, rainy season, and yearly, respectively. In the tropical humid climate of altitude, during the year 2025, the increase may reach 0.825, 0.875, and 0.80 °C in the dry season, rainy season, and yearly, respectively. In the tropical humid climate of altitude, the maximum temperature is expected to increase by up to 0.3 °C (dry season), 0.40 °C (rainy season), and 0.325 °C (yearly). In addition, in 2050, the maximum variation in the maximum temperatures in the studied region will probably reach 2.6 °C (dry season), 1.75 °C (rainy season), and 2.15 °C (yearly), as compared to that in the 1960–2000 period. In Antananarivo, during 2050, the maximum temperature is expected to increase by 1.65, 1.75, and 1.6 °C in the dry season, rainy season, and yearly, respectively. However, in the humid tropical climate of altitude, during the dry season, rainy season, and annually, the maximum temperature will increase by up to 0.6, 0.8, and 0.65 °C, respectively. Finally, in 2075, as compared to the 1960–2000 period, the maximum variation of the maximum temperatures in these region will probably be 3.9 °C (dry season), 2.625 °C (rainy season), and 3.225 °C (yearly). During the same year, in the humid and cold altitude of tropical climate, the maximum temperature increase will be 2.475 °C (dry season), 2.625 °C (rainy season), and 2.4 °C (annually). These results show that the maximum temperature is rising faster in the rainy season than in the dry season, except in the humid tropical climate region.
3.1.1.2. Case of variation in the annual mean air temperature. In January of 1975, for relative humidity of 48.21–92.51%, the mean temperature was 20.52, 20.169, and 22.88 °C in the humid and hot altitude tropical climate, humid and cold altitude tropical climate, and humid altitude tropical climate, respectively. During July of the same year, the respective temperatures were 14.25, 13.33, and 16.58 °C. On the other hand, in January and July of 2000, the mean temperature reached (21.28 and 14.91 °C in Antananarivo, 21.094, and 14.25 °C in Antsirabé, and 23.37 and 17.07 °C in Ambohitsilaozana. In addition, in 2025, the mean air temperature in January and July is expected to be 22.045 and 15.67 °C in Antananarivo, 22.019 and 15.179 °C in Antsirabé, and 23.46 and 17.08 °C in Ambohitsilaozana. Further, in 2075, the mean air temperature will increase in January and July by up to 23.57 °C and 17.20 °C in the humid and hot altitude tropical climate (Antananarivo), and reach 23.86 and 17.09 °C in Antsirabé.
3.1.1.3. Case of variation in the annual minimum temperature. The minimum annual temperature increases were 0.029, 0.031, and 0.020 °C in the hot and humid tropical climate of altitude (Antananarivo), cold and humid tropical climate of altitude (Antsirabé), and the humid altitude tropical climate (Ambohitsilaozana), respectively. (Fig. 3b, d, and f). In the year 2025, a maximum increase in the minimum temperature in this region may reach 0.775 °C during both the seasons as compared to
that in the 1960–2000 period. In the hot and humid tropical climate of altitude (Antananarivo) during the same year (2025), the minimum temperature is expected to increase up to 0.775, 0.775, and 0.725 °C in the dry season, rainy season, and yearly, respectively. In the cold and
humid tropical climate of altitude (Antsirabé) during 2025, the respective temperature increase is expected to rise by 0.58, 0.775, and 0.775 °C as compared to that in the 1960–2000 period. In addition, in the year 2050, the maximum change in the minimum temperatures Fig. 2. Studied cities and outdoor climate.
in the region could probably reach 1.55 °C during both the seasons, as compared to that in the 1960–2000 period. In 2050 in Antananarivo, the minimum temperature will increase by up to 1.55, 1.55, and 1.45 °C in the dry season, rainy season, and yearly, respectively. However, in Antsirabé, during the dry season, rainy season, and annual, the
maximum temperature will increase by up to 1.45, 1.55, and 1.55 °C, respectively. Finally, for the year 2075, as compared to that in the 1960–2000 period, the maximum change in the minimum temperatures in the studied region could probably reach 2.325 °C for both the seasons. During the same year, in the humid and hot region, the minimum temperature will increase by up to 2.325 °C (dry season), 2.325 °C (rainy season), and 2.175 °C (annually). Meanwhile, in the humid region, during dry season and rainy season of 2075, the minimum temperature is expected to increase by 1.425 and 1.5 °C, respectively. These results may show that the minimum temperature in the area is increasing faster in the rainy season than in the dry season. The different temperature variations of the cities studied in this region are shown inTable 3. Our results show that the external environment does not evolve in the same way in different regions. The change trend in this region of Madagascar is similar to those of many countries in Africa (Modeste Kameni, Fitiava, na, & Aro-ZoRakotonirina, 2016). Fig. 3. Yearly temperature increment in the central of Madagascar(a,b, c,d).
Table 3
Variation in the air temperature in some regions of the central Madagascar.
Center
Cities Maximum temperature increment(°C) Minimum temperature increment(°C) Dry season Rainy season yearly Dry season Rainy season yearly Antananarivo 0.033 0.035 0.032 0.031 0.031 0.029 Antsirabe 0.052 0.034 0.043 0.029 0.031 0.031 Ambohitsilaozana 0.012 0.016 0.013 0.019 0.020 0.020
3.1.2. Case of East
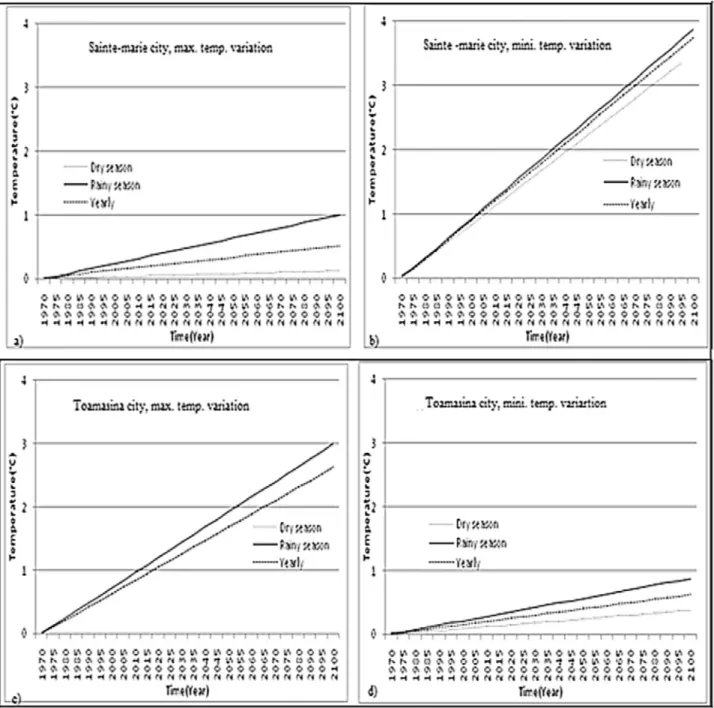
The following equations were established after conducting an ana-lysis of the evolution of different temperatures in the city of Sainte-Marie.Δtmax= 0.004·τ (3) Δtmin= 0.030·τ (4) In Saint-Marie City, the
maximum and minimum annual temperature increase was 0.004 and 0.030 °C, respectively, with a trend significance of 98% confidence level. These equations can be established for every city in East Madagascar.
Fig. 4shows the temperature variation in three major regions from 1970 to 2100: Sainte-Marie (altitude tropical climate), Toamasina (humid tropical climate), and Mahanoro (humid tropical climate), lo-cated in the East of Madagascar. Thefirst increment in temperature was selected as 1970, which is the year in which the temperature began to rise in this region for most cities. The rainfall varies in the same di-rection as the temperature. The minimum and maximum temperatures showed similar patterns of variation. Furthermore, the minimum tem-perature is changing faster than the maximum temtem-perature everywhere, except in Toamasina (Tamatav). About 100 years later, in the area of
eastern Madagascar, the minimum and maximum annual temperatures would increase from 0.5 °C to 3.0 °C, and from 0.4 °C to 2.1 °C, re-spectively, as compared to that in the period between 1901 and 2000.
3.1.2.1. Case of variation in the annual maximum temperature. The maximum annual temperature increased by 0.021 °C in the humid tropical climate, by 0.004 °C in Sainte-Marie, and by 0.013 °C in Mahanoro (Fig. 5). In 2025, unless some steps are taken to combat climate change, the maximum temperature increase may rise by 0.485, 0.6, and 0.485 °C in the dry season, rainy season, and yearly, respectively, as compared to that in the 1970–2000 period. In Sainte-Marie, during the same year (2025), the maximum temperature is expected to increase by up to 0.025, 0.2, and 0.1 °C in the dry season, rainy season, and yearly, respectively. In Mahanoro, during the same year (2025), the increase could reach 0.325, 0.375, and 0.325 °C in the dry season, rainy season, and yearly, respectively.
In addition, in the year 2050, the maximum variation in the max-imum temperatures in the studied region could probably be 0.97 °C (dry Fig. 4. Yearly temperature increment in the East of Madagascar(a,b,c,d).
season), 1.2 °C (rainy season), and 0.97 °C (yearly), as compared to that in the period between 1970 and 2000. In Sainte-Marie, in 2050, the maximum temperature will increase by up to 0.05, 0.40, and 0.20 °C in the dry season, rainy season, and yearly, respectively. However, in Mahanoro, during the dry season, rainy season, and annually, the maximum temperature will increase by up to (0.65, 0.75, and 0.65 °C, respectively). Finally, in 2075, as compared to the period between 1970 and 2000, the maximum variation in the maximum temperatures in the region could probably be 1.45 °C (dry season), 1.8 °C (rainy season), and 1.455 °C (yearly). During the same year, in Sainte-Marie, the maximum temperature would increase by up to 0.075 °C (dry season), 0.6 °C (rainy season), and 0.3 °C (annually). These results suggest that in east Madagascar, the maximum temperature is rising faster in the rainy season than in the dry season.
3.1.2.2. Case of variation in the annual mean air temperature. In January of 1975, for a relative humidity of 44.15–84.11%, the mean temperature was 25.28, 25.15, and 23.18 °C in Sainte-Marie, Toamasina, and Mahanoro, respectively. On the other hand, in
January of 2000, the mean temperature reached 25.58 °C in Sainte-Marie, 25.48 °C in Toamasina, and 23.62 °C in Mahanoro. In addition, in 2025, the mean air temperature in January will be 25.88 °C in Sainte-Marie, 25.80 °C in Toamasina, and 24.059 °C in Mahanoro. Furthermore, in 2075, the mean air temperature will increase in January by up to 26.48 °C (Sainte-Marie) and 24.93 °C (Mohanoro).
3.1.2.3. Case of variation in the annual minimum temperature. The minimum annual temperature increases of 0.030, 0.005, and 0.022 °C in Sainte-Marie, Toamasina, and Mohanoro, respectively (Fig. 4b, d, and f). In 2025, a maximum increase in the minimum temperature in this region could reach 0.775 °C in both the seasons as compared to the 1970–2000 period. In the humid tropical climate region of Toamasina, during 2025, the minimum temperature will increase up to 0.075, 0.175, and 0.125 °C in the dry season, rainy season, and yearly, respectively. In Sainte-Marie, during 2025, the increase could reach 0.58, 0.775, and 0.75 °C in the dry season, rainy season, and yearly, respectively, as compared to the period between 1970 and 2000. In addition, in 2050, the maximum variation in the minimum temperature Fig. 5. Yearly temperature increment in the East of Madagascar(e,f,g,h).
in this region could probably reach 1.55 °C in both the seasons, as compared to the period between 1970 and 2000. In Sainte-Marie, during 2050, the minimum temperature is expected to increase by 1.4, 1.55, and 1.50 °C in the dry season, rainy season, and yearly, respectively. However, in Toamasina, during the dry season, rainy season, and annually, the maximum temperature is expected to increase by up to 0.15, 0.35, and 0.25 °C, respectively. Finally, in the year 2075, as compared to the period between 1970 and 2000, the maximum changes in minimum temperatures in this region could probably reach 2.325 °C for both the seasons. During the same year, in Sainte-Marie, the minimum temperature will increase by up to 2.10 °C (dry season), 2.325 °C (rainy season), and 2.25 °C (annually). Meanwhile, in Mohonoro, during the dry and rainy seasons of 2075, the minimum temperatures will increase by 1.575 °C and 2.025 °C, respectively. These results may show that the minimum temperature in this region is increasing faster in the rainy season than in the dry season.
The different temperature variations of the cities examined in this region are shown inTable 4. These variations can be due to the various human anthropogenic activities in this region (Saseendran et al., 2016).
3.1.3. Case of other regions
The following equations were established after an analysis of the evolution of different temperatures in the city of Maevatanana. Δtmax=
−0.069·τ(5) Δtmin= 0.006·τ(6)
Equations (5) and (6), show that in Maevatanana City, the max-imum and minmax-imum annual temperatures varied by up to−0.069 and 0.006 °C, respectively, with a trend of significance of 95% confidence level. These equations can be established for every city in this region.
Figs. 6 and 7depict the temperature variation in three major re-gions: Maévatanana (humid tropical), Morondava (humid tropical cli-mate), and Mahajunga (transition tropical clicli-mate), located in the other regions of Madagascar between 1970 and 2100. The original tem-perature increment was selected starting from 1970, which is the year when the temperature began to rise in most of these cities. It was found that the precipitation rate increases with decreasing temperature in these regions. The minimum and maximum temperatures did not al-ways follow the same pattern of variation. Sometimes, the annual minimum temperature varied 75% more rapidly than the maximum temperature. About 100 years from now, in other regions of Mada-gascar, the minimum annual temperature could increase from 0.1 to 3.5 °C, and the maximum annual temperature could increase from 1.9 to 3.3 °C, as compared to that in the period between 2000 and 1901.
3.1.3.1. Case of variation in the annual maximum temperature. The maximum annual temperature increased by 0.033 °C in the humid tropical climate, and by 0.019 °C in the transition tropical climate, but decreased by 0.069 °C in Maévatanana City (Fig. 6). In the year 2025, unless concrete steps are taken to fight against climate change, the maximum increase in temperature could reach 0.8, 0.925, and 0.825 °C in the dry season, rainy season, and yearly, respectively, as compared to that in the period between 1970 and 2000. In the humid tropical climate of Morondava, during 2025, the maximum temperature is
estimated to increase by up to 0.525, 0.375, and 0.475 °C, in the dry season, rainy season, and yearly, respectively. In Maévatanana, during 2025, the decrease in temperature could reach 2.100, 1.375, and 1.725 °C in the dry season, rainy season, and yearly, respectively. In addition, in the year 2050, the maximum variation of the maximum temperatures in this region will probably be 1.6 °C (dry season), 1.85 °C (rainy season), and 1.65 °C (yearly), as compared to that in the period between 1970 and 2000. In Morondava, during 2050, the maximum temperature will increase by up to 1.05, 0.75, and 0.95 °C in the dry season, rainy season, and yearly, respectively. However, in Maévatanana, during the dry season, rainy season, and annually, the maximum temperature is expected to decrease by up to 4.20, 2.75, and 3.45 °C, respectively. Finally, in the year 2075, as compared to that in the 1970–2000 period, the maximum variation in the maximum temperatures in the region will probably reach 2.40 °C (dry season), 2.775 °C (rainy season), and 2.475 °C (yearly). During the same year, in the humid tropical region, the maximum temperature is expected to increase by 1.575 °C (dry season), 1.125 °C (rainy season), and 1.425 °C (annually). These results show that the maximum temperature decreased faster in the dry season than in the rainy season in Maevatanana.
3.1.3.2. Case of variation in the annual mean air temperature. In January of 1975, with a relative humidity of 48.06–90.50%, the mean temperatures were 25.828, 25.57, and 26.87 °C in Maévatana, Morondava, and Mahajunga, respectively. On the other hand, in January and July of 2000, the mean temperature reached 25.04 °C and 22.867 °C in Maévatana, 26.24 °C and 21.57 °C in Morondava, and 27.302 °C and 25.02 °C° in Mahajunga. In addition, in 2025, the mean air temperatures in January and July are estimated to be 24.25 °C and 22.08 °C in Maévatanana, 26.92 °C and 22.24 °C in the tropical humid region, and 27.73 °C and 25.45 °C in Marondava.
3.1.3.3. Case of variation in the annual minimum temperature. The minimum annual temperature increased by 0.006, 0.001, and 0.035 °C in Maévatanana, Mahajunga, and Marondava, respectively (Figs. 6 and 7). In 2025, the maximum increase in the minimum temperature in this region would reach 0.95 °C during both the seasons, as compared to that in the 1970–2000 period. In the humid tropical climate of Morondava, during 2025, the minimum temperature would increase by 0.95, 0.775, and 0.875 °C in the dry season, rainy season, and yearly, respectively. In the tropical transition region, during 2025, the increase could reach 0.45 and 0.15 °C in the rainy season and yearly, respectively; however, a decrease of 0.375 °C (dry season), as compared to that in the 1970–2000 period. In addition, in the year 2050, the maximum change in the minimum temperatures in the region could probably reach 1.90 °C in both the seasons, as compared to that in the 1970–2000 period. In Mahajunga, during 2050, the minimum temperature will increase by up to 0.35, 0.045, and 0.050 °C in the dry season, rainy season, and yearly, respectively. However, in Morondava, during the dry season, rainy season, and annually, the maximum temperature will increase up to 1.9, 1.55, and 1.75 °C, respectively. Finally, in 2075, as compared to that in the1970–2000 period, the maximum change in minimum temperatures in the region will probably be 2.85 °C and 2.325 °C during the dry and rainy seasons, respectively. During the same year, in Mahajunga, the minimum temperature will be increased by up to 0.525 °C (dry season), 0.0675 °C (rainy season), and 0.075 °C (annually). Meanwhile, in Maévatanana, during the dry and rainy seasons of 2075, the variation in the minimum temperature will be−1.125 and 1.35 °C, respectively. These results may show that the minimum temperatures in these regions grow faster in the rainy season than in the dry season, except in the humid tropical area, where the minimum temperature decreases in the dry season. The different temperature variations in the different cities examined in this region are shown inTable 5.
Overall, in the three studied regions, the average outdoor Table 4
Variation in the air temperature in some regions of the East of Madagascar.
East
Cities Maximum temperature increment(°C) Minimum temperature increment(°C) Dry season Rainy season yearly Dry season Rainy season yearly Sainte-Marie 0.001 0.008 0.004 0.028 0.031 0.030 Toamasina 0.021 0.024 0.021 0.003 0.007 0.005 Mahanoro 0.013 0.015 0.013 0.021 0.027 0.022
temperature increases to more than 3 °C per decade. This is one of the proofs which shows the enormity of suffering that global warming causes to Madagascar. This increase is attested by one of the arguments given by (IPCC, 2014): a variation of more than 2 °C will be observed in Africa if nothing is done now in the struggle against climate change in next decade. Air temperature increases the least in the center of Ma-dagascar than in the other regions (east, south…), which can be due to altitude effect and the passing of humid and cool wind coming from the Indian Ocean. In Madagascar, the coastal climate is more harsh than the continental climate (Harvey et al., 2014).
3.2. Impact, exposure, and vulnerability to climate change in Madagascar
In recent years, global warming has been evident in several cities of Madagascar. The temperature has been constantly increasing or de-creasing in every region. The heat has continued to increase in all the regions, while cooling has been rapidly decreasing each year. In many areas, including the north and south, changes in rainfall pattern have disrupted the hydrological systems and affected the quality and quan-tity of water resources. In many terrestrial and marine species, an
evolution of the distribution area has been observed for seasonal ac-tivities and migration. The effects of extreme climatic events have also been seen recently, such as heat wave (regions 1, 2, and 12), drought (regions 4 and 10),floods (regions 6 and 7), and cyclone (central east and central west), highlighting the vulnerability and the high degree of exposure of Madagascar to climate change. In this country, the cyclone season begins in November and ends in March and can cause significant damage across the island nation. In the last decades, several damaging cyclones have hit the country. Among these there were cyclones Elita and Gafilo in 2004 which caused an estimated 2.3% loss in GDP, and cyclone Boloetse in 2006, which caused a 0.7% decline in GDP. According to the World Food Program (WFP, 2015) in Madagascar, between 1980 and 2009, droughts have caused widespread failure of maize crops in the southern regions affecting more than 230,000 chil-dren. In 1981, droughts affected over one million people, while in 1988, over 200 deaths were registered. Furthermore, Over 30 events offloods have affected Madagascar in the past 30 years, killing hundreds of people and affecting thousands. The most damaging floods were those caused by hurricanes Eline and Gloria, which killed 20 people, and tropical cyclone Elita, which killed 363 people and affected one million Fig. 6. Yearly temperature increment in others region of Madagascar.
(Ratsimamanga & Bettencourt, 2010). All these disasters (cyclone, drought,flood, storm….) have many impacts on human health, human security, food production, economic sectors, etc.
3.2.1. Climate change and human health in Madagascar
Interviews with several medicine specialists from the hospitals of Madagascar and surveys of some NGOs suggested that, among the cases of illness recorded in recent years in their consulting services, over 50%
of these diseases can be attributed to the damaging effects of climate change. This rate continues to grow each year. In the 21 st Century, the warming of the Earth would lead to deterioration in health in several regions of Madagascar. One example of this is an increased likelihood of injury, as children are especially prone to injury and are more likely to experience severe and prolonged effects (e.g., burns, broken bones, head injuries), diseases, and deaths due to heat waves and intensefires. The decline in agricultural production can lead to undernourishment and malnutrition following the shortage of basic elements. The survey results revealed that more than 90% of the families in Madagascar (in all previously studied regions) eat rice every day. Malnutrition in-creases the vulnerability on every front, risking the loss of work capa-city and reduced productivity in the number of hands available for work within the vulnerable population; increased risk of diseases; hy-brid or alimentary and vector-borne diseases. Malaria remains a major public health problem in Madagascar. Climate change has favored the multiplication of Anopheles fluviatilis malaria vector from coastal areas. For 10 years, much effort has been deployed to reduce the ma-laria prevalence rate. Health facility data show that the share of mama-laria morbidity varied from 21.57% in 2003 to 5% in 2011, for children under 5 years, and from 17.57% to 2.3%, in 2011
for those over 5 years. It represents the 8th cause of morbidity in Fig. 7. Yearly temperature increment in the hottest region in Madagascar.
Table 5
Variation in the air temperature in the other regions of Madagascar.
Others regions
Cities Maximum temperature increment (°C) Minimum temperature increment(°C) Dry season Rainy season yearly Dry season Rainy season yearly Maevatanana −0.084 −0.055 −0.069 −0.015 0.018 0.006 Mahajunga 0.032 0.037 0.033 0.007 0.009 0.001 Morondava 0.021 0.015 0.019 0.038 0.031 0.035
2011 at the country level compared to 2010 where it represented the 6th cause. For mortality, the rate went from 25.92% to 19% for children under 5 years, and from 13.5% to 5% for people over 5 years. The number of cases of cholera observed in the country was not stable, as according to the World Health Organization, there were two cases of illness in 1971; 9973 in 1999; 29,305 in 2000; 27 in 2002, and fol-lowing the efforts of the government, only 5 cases of diseases in 2003. The number of cases of tuberculosis was 16,447 in 2001; 20,001 in 2004; 22,034 in 2008; and 25,782 in 2012. The rate of infection had thus increased by 57% compared to the year 2001. Moreover, the number of cases of leprosy was 1536 in 2006; 1763 in 2008; 1520 in 2010, and 1474 in 2012.The leprosy rate had decreased by 4% com-pared to the year 2006. In Madagascar, 51% of children under 5 years of age suffer from acute diarrhea, and nearly 7000 children under 5 years die each year from diarrhea due to lack of drinking water and basic hygiene. The latest statistics from the Ministry of Health reveal that 25% of children brought to the hospital in rural areas have diar-rhea, and 24% of these children die.
3.2.2. Climate change and human security in Madagascar
In Madagascar, young children are particularly at risk in several areas affected by disasters and their consequences. The dispropor-tionate consequences suffered by children are almost all exacerbated by poverty, and the difficult choices made by low-income households to adapt to difficult conditions. In the regions 1–13, for example, it can be seen that most deaths following extreme events happened in low-in-come neighborhoods, particularly among children, women, and the elderly. High poverty rates and lack of functional institutions increase vulnerability to climatic hazards such as floods, droughts, cyclones, extreme temperatures, and sea level rise. According to the World Bank, during this last decade, the average distribution of disasters reported in Madagascar was 68% forfloods, 11% for epidemics, 10% for drought, 9% for earthquakes, and 2% others. The number of people affected by these different disasters is given inFig. 8. From 1970–1980, over 3000 people were affected by storms. Between 1981 and 1989, the popula-tion was affected by over 85% of drought, and 12% by storms. Over 400 people were affected by floods between 1997 and 2008.
3.2.3. Climate change and food production in Madagascar
In Madagascar, the most consumed food remains rice (paddy rice). Analysis of the results following the interviews with some farmers and agricultural companies revealed that the rice culture is experiencing a rather worrying vulnerability in all regions. In some areas, the pro-duction had reduced to 75% (from 1.2 t/capita in 1975 to 0.3 t/capita
in 2013). According to FAO, in 2013, the paddy rice production de-clined by 21% (estimated at 3.6 million tons) in comparison with yields of earlier years. A deficit of about 240,000 tons of rice (milled) was estimated at the national level for the marketing year 2013/14 (April/ March). Furthermore, production of corn and cassava also decreased by 15% and 14%, respectively, as compared to that in the previous season. Uneven distribution of rainfall and delay of the 2012/13 rainy season by 1–2 months were observed in areas at the north and center of the country, which are the areas of intensive rice production. Therefore, significant decreases in rice production (up 60%) were registered in the northeast regions in comparison with the harvested yield of 2012. The damages caused by locusts were higher in the southwest areas, with a maximum contribution of around 7% (average) of the national rice production. According to 1990 estimates, 17% of the country’s rural population is classified as food insecure. This rate has increased to 25% in 2005, and 28% in 2012 (which is about 3,957,618 rural people). Only 11.3% of the rural households enjoy food security in Madagascar (IPCC, 2007b;IPCC, 2007a). The use offirewood as the primary source of fuel, has aggravated deforestation and erosion. In Madagascar, coffee is one of the main resources of the country and is the third most im-portant source of agricultural products exported in foreign currency after vanilla and crustaceans. According to the latest statistics, the coffee sector in the big island is currently experiencing enormous dif-ficulties to export its product to foreign markets. The production esti-mated at 10,000 tons in 2007, decreased by 83% in January 2015 and 86% in the following month. This sharp decline was caused by the heavy rains and cyclones that pollute the soils of plantations over the years. Madagascar's cocoa is ranked among the best cocoa in the world. Domestic production was estimated at 650 t/year before 1976; 3500 t between 1990 and 2002, and 6000 t from 2007. In 2013, this produc-tion slightly decreased to 25%. In addiproduc-tion, banana producproduc-tion was 444,030 t in 1975 ; 306,665 in 1983; 224,950 in 1985, and 210,000 t in 1994. This shows that production is decreasing. Wheat production was 14,000 t in 1995; 13,314 in 2005, and 500 t in 2015. Finally, produc-tion of soybeans (beans) was 7000 t in 1980; 5000 t in 1990; 4900 in 2000, and 4000 t in 2014. These variations reflect the effects of climate change on agricultural production.
3.2.4. Climate change and marine system in Madagascar
Madagascar has 56,000 km of coastal length. In 1997, the coastal zone of Madagascar was estimated at between 5.71 and 6.54 m, which is likely to engulf about 225 m in 2100 (IPCC, 2001). The Madagascar marine and coastal ecosystem is home to 75% of the marine macro-fauna in the western Indian Ocean. According to the ministry in charge of beaches, a decrease in the number of some marine species (mollusks, crustaceans, and coral reefs of cold water), in seasonal activities, and migration have been observed. The cost offish increased by up to 30% in these last few years.
The different results found in this study, can testify to the fragility of Madagascar against climate change. A prospecting on the southwest coast of Madagascar reveals, an unprecedented coral bleaching: some coral reefs have lost up to 99% of their coral cover (Harding, Quirke, & Cattle, 2007). A coral mortality of up to 80–90% in some coastal areas of the island has been noted (McClanahan & Obura, 1998). In addition, a loss of 40% infish species was observed (Andrade et al., 2010). 4. Conclusion
In this work, we have evaluated the rate of vulnerability that cli-mate change has on Madagascar. The different methods of forecasting were studied using several GCM models in varying scenarios. Several investigations in different sectors evidenced Madagascar’s rate of vul-nerability vis-a-vis climate change. Today, despite the importance of using scientific resources, the inherent incertitude ratios with numeric models are always used during climatic projections. The climate change impacts in Madagascar are visible. While the degree of heat continues Fig. 8. People affected by storm, drought and flood this last decade in
to increase in almost all the regions, the precipitation decreases to 3% per annum in some regions. Theflooding has considerably increased over these last few years in the coastal cities, and consequently, crop failures. Rice production has varied from 1.2 t/capita in 1975 to 0.3 t/ capita in 2013. Coffee production that was estimated at 10,000 tons in 2007, decreased by 86% in February 2015. The malnutrition ratio has increased enormously. Diarrhea and malaria continue to be the main reasons for mortality in the country. The minimum and maximum temperatures did not always follow the same pattern of variation. Sometimes, the annual minimum temperature varied 75% more rapidly than the maximum temperature. The maximum temperature is rising faster in the rainy season than in the dry season, except in the humid tropical climate region and cold altitude in the center of Madagascar. A more detailed study taking into account other aspects acting on the nature of the ecosystem can help to establish a database on climate change in Madagascar.
Acknowledgments
The authors of this article acknowledge the Centre for International Cooperation and Development (CICOPS) Project for their support in this work.
References
Andrade, P., Herrera, F. B., & Cazzolla, G. (2010). Building resiliene to climate change: Ecosystem-based adaptation and lessons from thefield. Gland, Switzerland: IUCN Chapter 3, 32(33).
Angie, D. (2011). Understanding vulnerability to climate change, insights from application of care’s climate vulnerability and capacity analysis (CVCA) methodology, care, Environment and climate change network. Chapter 1.
Bouagila, B., & Sushama, L. (2013). On the current and future dry spell characteristics over Africa. Atmosphere, 4(3), 272–298.http://dx.doi.org/10.3390/atmos4030272.
Harvey, C. A., ZoLalaina, R., Nalini, S., Radhika, D., Razafimahatratra, H., Hasinandrianina, R., et al. (2014). Extreme vulnerability of smallholder farmers to agricultural risks and climate change in Madagascar. The royal society B.1(12).
Coppola, E., Giorgi, F., Raffaele, F., Fuentes-Franco, R., Giuliani, G., LLopart-Pereira, M., et al. (2014). Present and future climatologies in the phase I CREMA experiment. Climatic Change, 23–38.
Delfani, M., Karami, H., & Pasdarshahri (2010). The effects of climate change on energy consumption of cooling systems in Tehran. Energy and Buildings, 42(11), 2169–2176.
Downing, T. E., Harrison, P. A., Butterfield, R. E., & Lonsdale, K. G. (2000). Climate change, climatic variability and agriculture in Europe: An integrated assessment. Environmental Change Institute, University of Oxford313–332.
Friedrich-E, S. (2013). Energie Durable pour Tous les ménages, les collectivités et les en-treprises. Antananarivo, fondation Friedrich Ebert Stiftung(FES)6–55.
Goldemberg (2000). World energy assessment, energy and the challenge of sustainability. New York: UNDP, Maximizing new opportunities 2(18).
Harrison, P. A., Butterfield, R. E., & Downing, T. E. (1995). Climate change and agriculture in Europe : Assessment of impacts and adaptations, environmental change unit research report No. 9Environmental Change Unit, University of Oxford 1(29).
Harding, M., Quirke, D., & Cattle, W. R. (2007). The economic and Policy environment for smallholde. Chapter3, aciar.gov.au/publication.
Hughes, L. (2000). Biological consequences of global warming. Ecology and Evolution, 15(2), 56–61.
IPCC, et al. (2007a). The physical science basis. In S. Solomon, D. Qin, M. Manning, Z. Chen, M. Marquis, & K. B. Averyt (Eds.). Contribution of working group I to the Fourth Assessment Report of the Intergovernmental Panel on Climate ChangeCambridge: Cambridge University Press 1(180).
IPCC (2001). Climate change 2001: The scientific basis. Contribution of working group 1 to the third assessment report of the intergovernmental panel on climate changeCambridge, UK. New York, US: Cambridge University Press 25 (39).
IPCC (2007b). Climate change : The physical science basis. Contribution of working group I to the fourth assessment report of the intergovernmental panel on climate changeCambridge University Press 1(21).
IPCC (2014). Climate change: Impact, adaptation and vulnerability. Summary for policy-makers, working group ii contribution to thefifth assessment report of the climateCambridge University Press 1(34).
Joussaume, S., Armand, D., Delecluse, P., et al. (2006). Les recherches françaises sur le changement climatique. INSU 6(20).
Jetten, T. H., & Focks, D. A. (1997). Potential changes in the distribution of dengue.
Transmission under climate warming. American Journal Of Tropical Medicine And Hygiene, 57, 285–297.
Kevan, P. G. (1999). Pollinators as bioindicators of the state of the environment: Species, activity and diversity. Agriculture Ecosystem and Environment, 71, 325–352.
Lacaux, J.-P., & Tourre, Y. M. (2006). Le climat et sa variabilité ont-ils un impact sur la santé humaine? Biofutur, 270, 22–25.
Lacaux, J.-P., Tourre, Y. M., Vignolles, C., Ndione, J. A., & Lafaye, M. (2007). 2006: classification of ponds from high-spatial resolution remote sensing: Application to Rift Valley Fever epidemics in Senegal. Remote Sensing of Environment, 106, 66–74. Laprise, R., Hernández-Díaz, L., Tete, K., Sushama, L.,Šeparović, L., Martynov, A., et al.
(2013). Climate projections over CORDEX Africa domain using the ifth-generation Canadian Regional Climate Model (CRCM5). Clim Dyn..http://dx.doi.org/10.1007/ s00382-012-1651-2.
Mariotti, L., Coppola, E., Sylla, M. B., Giorgi, F., & Piani, C. (2011). Region climate model simulation of projected 21st century clima change over an all-Africa domain: Comparison analysis of neste and driving model results. Journal Of Geophysical Research, 116(D15),http://dx.doi.org/10.1029/2010JD015068D15,11.
Mariotti, L., Diallo, I., Coppola, E., & Giorgi, F. (2014). Seasonal and inter seasonal changes of African monsoon climates in 21st centur CORDEX projections. Climatic Change, 125, 53–65 10.100 s10584-014-1097-0.
McClanahan, T., & Obura, D. O. (1998). Monitoring, training and assessment of the coral reefs of the Masoala Peninsula. Wildlife Conservation Society report.
Milen Dyoulgerov (2011). Vulnerability, risk reduction and adaptation to climate change in Madagascar. The world bank group Chapter9.
Modeste Kameni, N., Tchinda, R., Roshan, G. R., Ricciardi, P., & Nasrabadi, T. (2015). Climate change and its role on forecasting the energy demand in buildings, case study of Douala City, Cameroon. Journal of Earth Systeme Science, 124, 269–281.
Modeste Kameni, N., Fitiavana, A. H. A. R., & Aro-ZoRakotonirina, A. F. (2016). Climate change and effect on frequency curves of precipitation and radiation: An statistical study in equatorial area, Cameroon. Journal of Buildings and Sustainability, 1(46), 36.
Moss, R. H., Edmonds, J. A., Hibbard, K. A., Manning, M. R., Rose, S. K., van Vuuren, D. P., Carter, T. R., Emori, S., Kainuma, M., Kram, T., Meehl, G. A., Mitchell, J. F., Nakicenovic, N., Riahi, K., Smith, S. J., Stouffer, R. J., Thomson, A. M., Weyant, J. P., & Wilbanks, T. J. (2010). The next generation of scenarios for climate change re-search and assessment. Nature, 463(7282), 747–756.
Onerc (2007). Stratégie nationale d’adaptation au changement climatique, La documentation française. FRS 1(30).
Patricia, C., & Farmer, A. (2014). Spatial climate change vulnerability assessments: A review of data, methods, and issues. Book1, 1(70).
Rabefitia, L. Y. A., Randriamarolaza, M. L., & Rakotondrafara (2008). Changement cli-matique à Madagascar, site web. Direction Générale de la météorologie2–4.
Racsko, P., Szeidl, L., & Semenov (1991). A serial approach to local stochastic weather models; Ecological modeling. 5727–5741.
Roshan, J. A., & Orosa, T. N. (2012). Simulation of climate change impact on energy consumption in buildings: Case study of Iran. Energy Policy, 49, 731–739.
Ratsimamanga, A., & Bettencourt, S. (2010). A disaster risk management in Madagascar: A policy note” World Bank publication. 1(15).
Richardson, C. W. (1981). Stochastic simulation of daily precipitation, temperature, and solar radiation. Water Resources Research, 17, 182–190.
Saeed, F., Haensler, A., Weber, T., Hagemann, S., & Jacob, D. (2013). Representation of extreme precipitation events leading to opposite climate change signals over the Congo Basin. Atmosphere, 4(3), 254–271.http://dx.doi.org/10.3390/atmos4030254.
Saseendran, S. A., Fisher, D. K., Reddy, K. N., Pettigrew, W. T., Sui, R., & Ahuj, L. R. (2016). Vulnerabilities and adapting irrigated and rainfed Cotton to climate change in the Lower Mississippi delta region. Climate, 1(20).
Semenov, A., Brooks, R. J., Barrow, E. M., & Richardson, C. W. (1998). Comparison of the WGEN and LARS-WG stochastic weather generators for diverse climates. Climate Research, 10, 95–107.
Semenov, M. A., & Brooks, R. J. (1999). Spatial interpolation of the LARS-WG stochastic weather generator in Great Britain. Climate Research, 11, 137–148.
Solomon, S., Qin, D., Manning, M., Chen, Z., Marquis, M., Averyt, K. B., Tignor, M., & Miller, H. L. (Eds.). (2007). Contribution of Working Group I to the Fourth Assessment Report of the Intergovernmental Panel on Climate Change (pp. 996). Cambridge, United Kingdom and New York, NY, USA: Cambridge University Press.
Tadross, M., Randriamarolaza, L., Rabefitia, Z., & Yip, Z. K. (2008). Climate change in Madagascar:Recent past and future. Meteo Malgasy, 1–18.
Teichmann, C., Eggert, B., Elizalde, A., Haensler, A., Jacob, D., Kumar, P., et al. (2013). How does a regional climate model modify the projected climate change signal of the driving GCM: A study over different CORDEX regions using REMO. Atmosphere, 4(2), 214–236.
van Vuuren, D. P., et al. (2011). The representative concentration pathways: An overview. Climatic Change.http://dx.doi.org/10.1007/s10584-011-0148-z.
World food programms(WFP) (2015). The state of food insecurity in the world.https:// www.wfp.org/content/state-food-insecurity-world-2015.
WSUP (2015). Programme D’action National D’adaptation Au Changement Climatique, Ministere De L’environnement, Des Eaux Et Forêts Direction Generale De L’environnement. chapter 3, Available at:Global Environment Fund World Bank Republic