Publisher’s version / Version de l'éditeur:
Journal of Power Sources, 195, 17, pp. 5514-5519, 2010
READ THESE TERMS AND CONDITIONS CAREFULLY BEFORE USING THIS WEBSITE. https://nrc-publications.canada.ca/eng/copyright
Vous avez des questions? Nous pouvons vous aider. Pour communiquer directement avec un auteur, consultez la
première page de la revue dans laquelle son article a été publié afin de trouver ses coordonnées. Si vous n’arrivez pas à les repérer, communiquez avec nous à [email protected].
Questions? Contact the NRC Publications Archive team at
[email protected]. If you wish to email the authors directly, please see the first page of the publication for their contact information.
NRC Publications Archive
Archives des publications du CNRC
This publication could be one of several versions: author’s original, accepted manuscript or the publisher’s version. / La version de cette publication peut être l’une des suivantes : la version prépublication de l’auteur, la version acceptée du manuscrit ou la version de l’éditeur.
For the publisher’s version, please access the DOI link below./ Pour consulter la version de l’éditeur, utilisez le lien DOI ci-dessous.
https://doi.org/10.1016/j.jpowsour.2010.03.061
Access and use of this website and the material on it are subject to the Terms and Conditions set forth at
Hydrogen production in a microbial electrolysis cell with nickel-based
gas diffusion cathodes
Manuel, M.-F.; Neburchilov, V.; Wang, H.; Guiot, S. R.; Tartakovsky, B.
https://publications-cnrc.canada.ca/fra/droits
L’accès à ce site Web et l’utilisation de son contenu sont assujettis aux conditions présentées dans le site LISEZ CES CONDITIONS ATTENTIVEMENT AVANT D’UTILISER CE SITE WEB.
NRC Publications Record / Notice d'Archives des publications de CNRC:
https://nrc-publications.canada.ca/eng/view/object/?id=161b6955-aa46-4ccc-b831-804f96e17c50
https://publications-cnrc.canada.ca/fra/voir/objet/?id=161b6955-aa46-4ccc-b831-804f96e17c50
Contents lists available atScienceDirect
Journal of Power Sources
j o u r n a l h o m e p a g e :w w w . e l s e v i e r . c o m / l o c a t e / j p o w s o u r
Hydrogen production in a microbial electrolysis cell with nickel-based gas
diffusion cathodes
M.-F. Manuel
a, V. Neburchilov
b, H. Wang
b, S.R. Guiot
a, B. Tartakovsky
a,∗aBiotechnology Research Institute, National Research Council of Canada, 6100 Royalmount Ave, Montreal, QC, Canada H2P 2R2 bInstitute for Fuel Cell Innovation, National Research Council of Canada, 4250 Westbrook Mall, Vancouver, BC, Canada V6T 1W5
a r t i c l e
i n f o
Article history:
Received 29 January 2010
Received in revised form 18 March 2010 Accepted 19 March 2010
Available online 25 March 2010 Keywords:
MEC HER Ni alloy
Gas diffusion cathode
a b s t r a c t
Gas diffusion cathodes with Ni alloy and Ni catalysts manufactured by chemical deposition were tested for H2production in a microbial electrolysis cell (MEC). In a continuous flow MEC, multi-component cathodes
containing Ni, Mo, Cr, and Fe, at a total catalyst load of 1 mg cm−2on carbon support demonstrated stable
H2production at rates of 2.8–3.7 L L−1R d−1with only 5% methane in the gas stream. Furthermore, a Ni-only
gas diffusion cathode, with a Ni load of 0.6 mg cm−2, demonstrated a H2production rate of 4.1 L L−1 R d−1.
Overall, H2production was found to be proportional to the Ni load implying that inexpensive gas diffusion
cathodes prepared by chemical deposition of Ni can be successfully used for continuous production of H2in a MEC.
Crown Copyright © 2010 Published by Elsevier B.V. All rights reserved.
1. Introduction
Today’s ever increasing energy demand coupled with concern over fossil fuel emissions has prompted scientists to explore alter-native energy carriers such as hydrogen which are sustainable, and affordable[1]. Unfortunately, 95% of commercial hydrogen pro-duced today is by Steam Methane Reforming and coal gasification. These polluting processes emit carbon monoxide and carbon diox-ide[2]. Alternatively, hydrogen production by water electrolysis is a non-polluting process, which can be achieved industrially. How-ever, high energy requirements of at least 5–6 Wh L−1 of H
2 and
electrode limitations make it operationally and economically less than practical. Biohydrogen by dark fermentation shows promise in its use of renewable carbon sources[3], however the overall hydrogen yield is limited to a maximum of 4 mol-H2mol-hexose−1
[4].
More recently, biocatalyzed electrolysis[5,6]or electrohydro-genesis was demonstrated to maximize the hydrogen yield from an organic substrate by overcoming endothermic limitations of fermentation end products through a unique electrically driven process. In this way, a higher hydrogen recovery can be obtained and at a much lower energy input than that used in water elec-trolysis. More importantly, biocatalyzed electrolysis enables the possibility of direct fuel production from a diverse range of waste streams[7–9]. Most microbial electrolysis cells (MFCs) are operated
∗ Corresponding author. Tel.: +1 514 496 2664; fax: +1 514 496 6265. E-mail address:[email protected](B. Tartakovsky).
using Pt-based cathodes[10–13]. However from a cost perspective this poses a major disadvantage as platinum or platinum group metals are scarce and expensive. As a result, attention has turned towards non-noble catalysts, which are readily available and inex-pensive. Nickel alloys with additives such as Fe, Cr, and Mo are known to have a high electrocatalytic activity for the hydrogen evolution reaction (HER) and are low in cost[14].
Hydrogen production in an MEC equipped with cathodes made with stainless steel, nickel alloys[15–17]and electrodeposited Ni alloys[18]has recently been demonstrated. These studies were per-formed in single chamber MECs with sheet metal or cloth cathodes immersed in anodic liquid. Best performance was observed with Ni alloy cathodes or with a stainless steel cathode containing a sig-nificant amount of Ni. In the study presented below we evaluate the impact of a Ni alloy composition on hydrogen production in a MEC by comparing several Ni alloys chemically deposited on gas diffusion cathodes.
2. Materials and methods 2.1. Ni-alloy cathode fabrication
The cathodes were manufactured by dissolving selected salts (Mn(NO3)2·H2O, Co(NO3)2·6H2O, Cr(NO3)3·6H2O, Fe(NO3)3·9H2O,
Ni(NO3)2·6H2O and Mo7O24(NH4)6, all purchased from
Sigma–Aldrich Canada, Oakville, ON, Canada) in water fol-lowed by solution mixing. Carbon black BP2000 (1450 m2g−1) was
dispersed in 50% isopropanol alcohol by ultrasonication (1 s On:1 s Off cycle) for 1 h at T < 40◦C. Then the carbon dispersion and metal
0378-7753/$ – see front matter. Crown Copyright © 2010 Published by Elsevier B.V. All rights reserved. doi:10.1016/j.jpowsour.2010.03.061
Table 1
A description of cathodes tested.
Cathode Me catalyst composition (wt%) and percentage Ni load (mg cm−2) GDC-0 None 0 GDC-1 30% Pt 0a GDC-2 65.0% Ni, 10.6% Mo, 21.3% Cr, 3.2% Fe (40% Me) 0.65 GDC-3 74.5% Ni, 22.8% Cr, 2.7Fe (40% Me) 0.745 GDC-4 61% Ni, 34% Cr, 1.0 Mn (40% Me) 0.61 GDC-5 40% Ni 0.4 GDC-6 60% Ni 0.6 a0.5 mg-Pt cm−2.
salts solutions were mixed. The resulting solution was ultrason-ically treated for 3 h at 20◦C (1 s On:1 s Off cycle). The pH of the
solution was adjusted to 10 using 1 M NaOH while being stirred, then a 5% solution of NaBH4was added drop-wise to the solution
(molar ratio of metals: NaBH4= 1:30). The resulting solution was
heated to 80◦C for 2 h while being stirred. The reduction of metal
nitrates was continued by stirring the solution at 20◦C for 12 h.
The reduced catalyst was washed until a filtrate with a pH of 7 was obtained. The washed catalyst was dried in a vacuum oven for 2 h, then ground at 25,000 rpm in EKA (Germany) grinder. Energy dispersive X-ray microanalysis (EDX) was used to estimate actual catalyst composition.
The cathodes were prepared by manual spraying of the cata-lyst ink with 30% Nafion on GDL 25BC carbon paper (SGL Group, Germany), with a pre-fabricated microporous sub-layer. The spray-ing on a hot plate at 80◦C was followed by drying at 90◦C for
20 min. Total metal load for all multi-component electrodes was 1.0 mg metal cm−2. In addition, a blank GDL 25BC carbon paper
con-taining no metal catalyst and an E-TEK ELAT®GDE LT120EW carbon
cloth gas diffusion cathode with a Pt load of 0.5 mg cm−2(E-TEK
Division, PEMEAS Fuel Cell Technologies, Somerset, NJ, USA) were used in the tests. A complete list of gas diffusion cathodes (GDCs) used in the tests is given inTable 1.
2.2. MEC construction
A continuous flow membrane-less MEC was constructed using polycarbonate plates arranged to form 50 mL anodic compart-ment and a gas collection compartcompart-ment of the same volume. The anodic compartment contained a 5-mm thick carbon felt measuring 10 cm × 5 cm (Speer Canada, Kitchener, ON, Canada). The cathode was installed between the anodic and gas collection compartments. The anode and cathode were separated by a 0.7 mm thick J-cloth, as suggested by Fan et al.[19]. More details on MEC design can be found elsewhere[11,20].
2.3. MEC operation and characterization
The MEC was inoculated with 5 mL of homogenized anaerobic mesophilic sludge from a food processing industry (A. Lassonde Inc., Rougemont, Quebec, Canada) and continuously fed a stock solu-tion of carbon source and nutrients. This stock solusolu-tion contained (in g L−1): sodium acetate (90.7), yeast extract (6.7), NH4Cl (18.7),
KCl (148.1), K2HPO4(64.0), and KH2PO4(40.7). The stock solution
was fed by an infusion pump (model PHD 2000, Harvard Apparatus, Canada) at a rate of 5 mL d−1, which corresponded to an acetate load
(per liter of reactor volume) of 4 g L−1
R d−1. A dilute solution of trace
metals was prepared according to Tartakovsky et al.[20]and fed at a rate of 180–190 mL d−1using a peristaltic pump (Cole-Parmer,
Chicago, IL, USA) providing a retention time of 6.3–6.7 h. The acetate and dilution streams were combined before entering the anodic chamber. A peristaltic pump (0.57 L h−1) installed in the external
recirculation line provided homogeneous distribution of acetate throughout the anodic chamber. MEC temperature was maintained at 30◦C by a heating plate secured on the anodic compartment side
of the MEC. More details on MEC operation can be found elsewhere
[11,20].
Applied voltage was controlled using a controllable power supply (2400 SourceMeter, Keithley, Cleveland, OH, USA). Unless otherwise indicated the MEC was operated at an applied voltage of 1.0 V in order to maximize hydrogen production. All cathodes were tested using the same anode and all testes were carried out for a minimum of 4 days with some tests lasting 7–15 days in order to ensure steady state conditions.
MEC performance was characterized in terms of the volumetric H2 production rate, the Coulombic efficiency, cathodic efficiency
and power consumption per liter of hydrogen recovered in the off-gas. The H2production rate was expressed per liter of reactor
volume (LR), the Coulombic efficiency was calculated as the ratio
of electrons recovered as current to the total electron equivalent available from acetate consumption, and cathodic efficiency was calculated as the ratio of electrons recovered as hydrogen gas to the total number of electrons that reach the cathode. A detailed explanation of these calculations can be found elsewhere[8,16].
MEC electrochemical characteristics were acquired using volt-age scans performed 1–2 days after the beginning and at the end of each cathode testing period. The scans were performed by chang-ing the applied voltage between 0.4 and 1.2 V and measurchang-ing the resulting current. Also, anode potential was measured against a reference electrode (Ag/AgCl, 222 mV vs NHE). A 10-min interval was allowed after each voltage change for current stabilization. The total internal resistance (Rint) was calculated as a slope using
the linear part of the voltage vs current curve. Similarly, the total internal anode resistance (Ran) was estimated using anode potential
measurements against the reference electrode.
2.4. Analytical measurements
Acetic acid was analyzed on an Agilent 6890 gas chromatograph (Wilmington, DE) equipped with a flame ionization detector and a 1 mm × 2 mm 60/80 mesh Carbopack C column (Supelco, Bella-fonte, PA, USA) coated with 0.3% Carbowax 20 M and 0.1% H3PO4.
The carrier gas was nitrogen, which had a flow rate of 20 mL min−1.
The injector and the detector were maintained at 200◦C. Samples
(0.5 L) were fortified at a ratio of 1:1 (v/v) using an internal stan-dard of iso-butyric acid dissolved in 6% formic acid. Gas production in the MEC was measured on-line by means of bubble counters (Innoray, Montreal, Canada). Gas composition was measured using a gas chromatograph (6890 Series, Hewlett Packard, Wilmington, DE) equipped with an 11 m × 3.2 mm 60/80 mesh Chromosorb 102 column (Supelco, Bellefonte, PA, USA) and a flame ionization detec-tor. The carrier gas was argon.
3. Results and discussion
3.1. Influence of the cathode catalyst on hydrogen production In a fed-batch MEC, Selembo et al. [16] demonstrated high hydrogen production rates with Ni alloy cathodes. Based on these findings we manufactured several Ni-based GDCs and evaluated their performance in a continuous flow MEC. For basis of compar-ison, the MEC was also operated with a Pt-based GDC-1 (positive control) and with a cathode lacking a metal catalyst (negative con-trol, GDC-0 inTable 1).
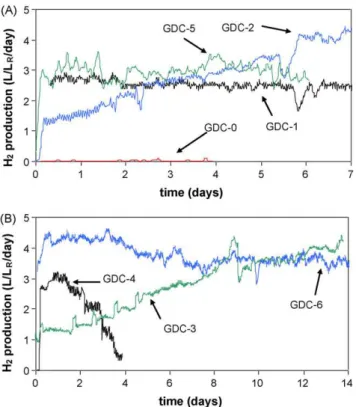
Fig. 1. Volumetric hydrogen production rates observed in (A) GDC-0, GDC-1, GDC-2, GDC-5 and (B) GDC-3, GDC-4, GDC-6 cathode tests. All tests were carried out at an applied voltage of 1 V and an acetate load of 4 g L−1
R d −1. H
2production for GDC-1 is shown starting from day 10 of the test.
At startup, a MEC equipped with a Pt-based GDC-1 (Table 1) was inoculated and immediately operated with an applied voltage of 1.0 V and an acetate load of 4 g L−1
R d−1 (per anodic
compart-ment volume). After 10 days, a steady state current density of 2.9 ± 0.2 A m−2was achieved, which corresponded to a hydrogen
gas production rate of 2.6 L L−1
R d−1(Fig. 1, H2production for GDC-1
is shown starting from day 10 of the test). After MEC characteriza-tion by a voltage scan, GDC-1 was replaced with GDC-0 lacking a Me catalyst, while the same anode was kept. The MEC with GDC-0 was maintained at the same operating conditions in terms of applied voltage and acetate load. Almost immediately after GDC-0 installa-tion, a steady current density of 2.47 ± 0.23 A m−2was measured,
but no hydrogen production was observed during the 4 days of test-ing (Fig. 1). Previous reports have demonstrated H2production in a
MEC with a bio-cathode through the development of electrochem-ically active microbial populations[21]. However by limiting test duration to 4 days, the contribution of these microbial populations to H2formation was minimized. The absence of observable
hydro-gen production agreed with the results of Hu et al.[18]where no hydrogen production was observed without a Ni alloy catalyst. At the same time, current density was only slightly lower than in the GDC-1 test.
The next cathode tested was GDC-2, a 4 component cathode, which consisted of a Me catalyst resembling that of the Ni alloy used by Selembo et al.[16]. The Me catalyst was composed of Ni, Cr, Fe, and Mo (Table 1). H2 production resumed
immedi-ately after cathode replacement (Fig. 1). Continuous MEC operation with this cathode for 7 days showed a progressively increasing hydrogen production rate corresponding to a steady state value of 3.7 L L−1
R d−1, i.e. GDC-2 outperformed the Pt-based GDC-1 in
terms of volumetric hydrogen production. Also, methane con-centration in the off-gas did not exceed 5%, while a methane concentration of 8-10% was measured during MEC operation with GDC-1. This difference can be attributed not only to the differ-ence in cathode composition, but also to the introduction of some methanogenic microorganisms with the inoculum sludge. Indeed, the inoculum originated from an anaerobic digestor and thus contained a significant methanogenic population. Although this population is expected to decline over time due to the proliferation of anodophilic microorganisms, some methane production might be expected shortly after inoculation, i.e. during GDC-1 testing.
In the following test, the impact of Mo on cathode performance was evaluated. Consequently, a 3-component cathode GDC-3 con-taining Ni, Cr, and Fe was installed (Table 1). The test demonstrated that in the absence of Mo hydrogen production remained at 3.6 L L−1
R d−1 (Fig. 1andTable 2). Nevertheless, a comparison of
cathodic efficiencies inTable 2shows higher efficiency for GDC-2 (94.5%) as compared to GDC-3 (79%) suggesting that the presence of Mo could have improved cathodic efficiency, at least as compared to GDC-3.
Further evaluation of the catalytic effect of alloys continued with the installation of GDC-4. In this cathode Fe was replaced with Mn to compare their catalytic activities. Initial results demonstrated a hydrogen production rate comparable to that of previous cathodes, with a cathodic efficiency similar to that observed with GDC-3. However, this was short lived, and after two days cathode perfor-mance deteriorated significantly, suggesting a negative impact of Mn on cathode stability (Fig. 1b).
The next cathodes evaluated were manufactured with Ni as the only catalyst and would serve to elucidate the impact of Cr and Fe additives on the HER. GDC-5 and GDC-6 were prepared with Ni loads of 0.4 and 0.6 mg cm−2, respectively (Table 1). Here, both
cathodes demonstrated stable H2production almost immediately
after each test startup (Fig. 1a and b). When H2production rates
obtained from all cathode tests were plotted against their corre-sponding Ni loads, a proportional increase in hydrogen production rate was observed up to a maximum Ni load of 0.6 mg cm−2(Fig. 2).
For the most part, H2 production rates observed with cathodes
GDC-2, GDC-3, and GDC-6 containing similar amounts of Ni were within the same margin of error with the best rate obtained for GDC-6 (Table 2). GDC-4 was a notable exception due to the adverse effect of Mn. Also, A Ni load above 0.6 mg cm−2, as demonstrated
with GDC-3, did not yield a better H2production rate, at least in
the presence of other metals. Overall, it was apparent that the Ni load and not the presence of metal additives was the predominant factor influencing the HER.
Table 2
MEC performance in hydrogen production tests.
Cathode no Ni load (mg cm−2) H2(L L−1
R d−1) Y (mol mol−1) Efficiency (%) Current (A m−2) Rint()
Flow Stdev Coulombic Cathodic
GDC-0 0 0.02 0.08 0.0 56.6 0.6 2.47 25.5 GDC-1 0 2.61 0.51 2.4 75.3 80.8 2.90 28.4 GDC-2 0.65 3.72 0.59 2.6 69.0 94.5 3.54 29.8 GDC-3 0.75 3.58 0.51 2.4 77.3 78.7 4.09 31.1 GDC-4 0.61 2.77 0.61 1.9 64.9 73.3 3.39 51.3 GDC-5 0.40 2.85 0.46 1.9 51.0 95.4 2.69 36.5 GDC-6 0.60 4.14 0.52 2.8 68.0 103.3 3.60 28.5
Fig. 2. Dependence of H2production at steady state on Ni load in Ni alloy and Ni cathodes. H2production in GDC-4 test was estimated using first 2 days of operation.
Furthermore, H2production rates observed with Ni-based
cath-odes were as good as or higher than that obtained when a Pt catalyst was used. Again, the only exception was GDC-4, where H2
production was negatively affected by the presence of Mn. Hu et al.[18]reported superior volumetric hydrogen production rates for a NiMo cathode catalyst as compared to a Pt-based cathode. This is not contradictory to the results of this study since Hu et al.[18] did not compare performance of NiMo against Ni cath-odes. Notably, the hydrogen production rate observed for GDC-1 (Pt) was somewhat lower than the rate obtained in our previous experiments[20], which were carried out in a similar experimen-tal setup but with a longer HRT of 10 h as opposed to 6.4 h in the GDC-2 test. While a shorter HRT circumvented acetate-limitation in the anodic compartment providing acetate concentrations in a range of 100–180 mg L−1, likely it resulted in lower H
2production
rates because the bioreaction time was too short. An HRT optimiza-tion study might be required to establish condioptimiza-tions maximizing hydrogen production rate in a MEC.
H2 yield calculations presented inFig. 3suggested a
correla-tion between the yield and the rate of H2production. The highest
yields were obtained for GDC-2 and GDC-6 (2.6 and 2.8 mol mol−1,
respectively), which also demonstrated the best performance in terms of hydrogen production rates. A similar value was obtained
Fig. 3. Estimated H2yield at an applied voltage of 1 V for cathodes tested.
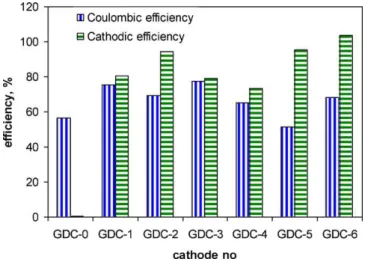
Fig. 4. Estimated Coulombic and cathodic efficiencies.
with GDC-3 with a hydrogen yield of 2.4 mol mol−1. Lower H2yields
were associated with a lower performance, as observed with GDC-4 and GDC-5. With respect to GDC-4, reasonable Coulombic efficiency once again suggested the problem to be associated with the cath-ode and not with the ancath-ode. With respect to GDC-5, low H2yield
was related to poor anodic rather than cathodic performance, as was evidenced by a high cathodic efficiency of 95.4%. Indeed, due to a technical error the MEC had been re-inoculated during this test thus affecting microbial community. Somewhat lower acetate concentration of the anodic liquid and higher methane content in the cathodic off-gas suggested metabolic activity of acetoclastic methanogens, which might be present in the inoculum sludge.
3.2. Coulombic and cathodic efficiencies
Coulombic efficiency was calculated to estimate the efficiency of electron transfer at the anode. The results presented inFig. 4show that Coulombic efficiency varied between 65 and 77% for all Ni-based cathodes except GDC-5 where a value of 51% was obtained. Relatively low Coulombic efficiency was also observed in GDC-0 and GDC-1 tests. Notably, GDC-1 and GDC-5 tests were performed after a recent MEC inoculation and were characterized by 8–10% methane concentration in the off-gas. It can be hypothesized that in addition to methane production from hydrogen by hydrogenophilic methanogens[20,22], part of the acetate was also consumed by the acetoclastic methanogens present in the inoculum (anaerobic sludge). Given a relatively short hydraulic retention time of 6.4 h, it can be also suggested that in time, acetoclastic methanogenic pop-ulations declined as conditions suitable for attached anodophilic microorganisms persisted resulting in lower levels of methane in the tests performed at a later time.
Interestingly, current density and accordingly Coulombic effi-ciency in GDC-0 test was only slightly lower than the values obtained in other GDC tests, while hydrogen production was negli-gible. It can be suggested that electrochemical reactions other than HER such as reactions involving salts (e.g. Fe and Mn salts present in the microelements solution) occurred in the absence of a Me cat-alyst at the cathode. Furthermore, bioelectrochemical reduction of CO2to CH4at the cathode[23,24]and electricity production
cou-pled to ammonium[25]has been recently reported in the absence of a Me catalyst.
Cathode efficiency was also evaluated in terms of electron recovery as hydrogen gas. A comparison of cathodic efficiencies confirmed good catalytic properties of all Ni alloys except when Mn was present. Cathodic efficiency was found to correlate well with H2yield and MEC performance, as described above. Overall,
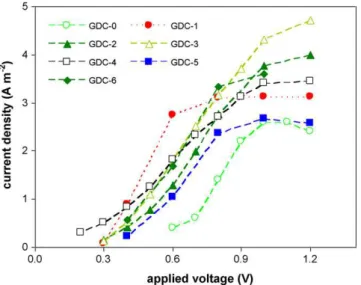
Fig. 5. MEC voltage scans obtained at the end of each cathode test (except MFC-4 where the scan was performed on day 2 of the test) with 10 min intervals between each voltage change.
the cathodes with best cathodic efficiencies were GDC-2, GDC-5 and GDC-6 which on average demonstrated a cathodic efficiency of 98%. Hydrogen production was lower when a lower Ni content was used. The lowest cathodic efficiency was obtained for GDC-1 (Pt) cathode. Apparently, high catalytic activity of Pt led to several con-current reactions[26]thus resulting in lower hydrogen production efficiency.
3.3. Voltage scans
Fig. 5summarizes the results of the voltage scans performed at the end of each test (except GDC-4, where results of the volt-age scan obtained two days after the startup are shown because MEC performance deteriorated shortly after the test,Fig. 1b). The voltage vs current curves obtained in these tests were used to estimate MEC internal resistance. While estimations obtained by this method could be biased and better accuracy can be obtained using electrochemical impedance spectroscopy[27], this method still facilitated a comparison of MEC characteristics, as summarized inTable 2. Overall, Rintvaried between 25 and 37 (except
GDC-4). Estimation of anodic resistances ranged from 11 to 16 in all tests. Ran values were well within the estimation accuracy of the
method, i.e. similar resistances were obtained in all tests. Although the anodic compartment had to be re-inoculated during the GDC-5 test due to a technical error in MEC operation, the inoculation was performed with the same inoculum and the MEC was maintained under the same conditions throughout the tests. Consequently, the anodophilic microbial population had a consistent performance in all tests. Interestingly, estimated Ran and Rintvalues were almost
unchanged during the test of GDC-0 lacking a metal catalyst. This agrees with Coulombic efficiency calculations and confirms that electrochemical reactions other than HER proceeded at the cathode, while anode performance is not significantly affected.
Analysis of current densities obtained in voltage scans (Fig. 5) confirmed better electrochemical performance of the Ni and Ni-alloy cathodes, GDC-2, GDC-3, and GDC-6. For most cathodes including best performing GDC-6 current density reached a plateau above an applied voltage of 0.8–1.0 V, apparently due to anode reaction limitations. It can be hypothesized that at applied volt-ages above 0.8–1.0 V, electron transfer to the anode by anodophilic microorganisms, rather than HER, became a rate limiting factor. Therefore, MEC operation at approximately 0.8 V should result in similar volumetric rates of hydrogen production, while
consum-ing less energy. Indeed, energy consumption in the tests described above was in a range of 2.0–2.3 Wh L-H2−1, but when the MEC was
operated at an applied voltage of 0.7 V or 0.8 V (cathodes GDC-1 and GDC-6) energy consumption decreased to 1.8–2.1 Wh L-H2−1
(results not shown). MECs are often operated at an applied voltages in a range of 0.4–0.8 V, which results in lower energy consumption, although the volumetric rate of hydrogen production is also lower
[18]. An applied voltage of 1 V was chosen to maximize the volu-metric rate of hydrogen production and facilitate a comparison of cathodic performance.
4. Conclusion
A comparison of hydrogen production rates in a MEC operated with several Ni alloy and Ni gas diffusion cathodes demonstrated the high efficiency of Ni as the cathode catalyst. A Ni load of 0.6 mg cm−2was sufficient to maintain a stable hydrogen
produc-tion at a volumetric rate of 4.1 L L−1
R d−1. In addition to the high HER
activity, Ni-based cathodes showed a better reaction selectivity in comparison to a Pt-based gas diffusion cathode, resulting in close to 100% cathodic efficiency, as opposed to 81% cathodic efficiency observed with the Pt-based cathode. Considering that the cost of Ni is orders of magnitude lower than Pt[16,18], Ni-based gas diffusion cathodes might significantly decrease the cost of MEC construc-tion, thus making this novel technology more feasible for practical applications in areas such as hydrogen production from wastew-ater. Also, the use of gas diffusion cathodes as opposed to solid metal sheet cathodes facilitated fast removal of hydrogen formed at the cathode thus minimizing hydrogen loses due to activity of hydrogenophilic methanogens.
Acknowledgment
This research was supported by the National Research Council of Canada, NRC publication number 50018.
References
[1] G. Marban, T. Valdes-Soulis, Int. J. Hydrogen Energy 32 (2007) 1625–1637. [2] F.T. Mueller-Langer, E.M. Kaltschimitta, S. Peteves, Int. J. Hydrogen Energy 32
(2007) 3797–3810.
[3] K. Nath, App. Microb. Biotechnol. 65 (2004) 520–529.
[4] H.-S. Lee, M.B. Salerno, B.E. Rittmann, Environ. Sci. Technol. 42 (2008) 2401–2407.
[5] R.A. Rozendal, H.V.M. Hamelers, G.J.W. Euverink, S.J. Metz, C.J.N. Buisman, Int. J. Hydrogen Energy 31 (2006) 1632–1640.
[6] H. Liu, S. Grot, B.E. Logan, Environ. Sci. Technol. 39 (2005) 4317–4320. [7] R.C. Wagner, J.M. Regan, S.E. Oh, Y. Zuo, B.E. Logan, Water Res. 43 (2009)
1480–1488.
[8] A. Escapa, M.-F. Manuel, A. Morán, X. Gómez, S.R. Guiot, B. Tartakovsky, Energy Fuels 23 (2009) 4612–4618.
[9] B.E. Logan, D. Call, S. Cheng, H.V.M. Hamelers, T.H.J.A. Sleutels, A.W. Jeremiasse, R.A. Rozendal, Environ. Sci. Technol. 42 (2008) 8630–8640.
[10] D. Call, B.E. Logan, Environ. Sci. Technol. 42 (2008) 3401–3406.
[11] B. Tartakovsky, M.F. Manuel, V. Neburchilov, H. Wang, S.R. Guiot, J. Power Sources 182 (2008) 291–297.
[12] R.A. Rozendal, H.V.M. Hamelers, R.J. Molenkamp, C.J.N. Buisman, Water Res. 41 (2007) 1984–1994.
[13] H. Hu, Y. Fan, H. Liu, Water Res. 42 (2008) 4172–4178.
[14] D.E. Brown, M.N. Mahmood, M.C.M. Man, A.K. Turner, Electrochim. Acta 29 (1984) 1551–1556.
[15] D.F. Call, M.D. Merrill, B. Logan, Environ. Sci. Technol. 43 (2009) 2179–2183. [16] P.A. Selembo, M.D. Merill, B.E. Logan, J. Power Sources 109 (2009) 271–278. [17] P.A. Selembo, M.D. Merrill, B.E. Logan, Int. J. Hydrogen Energy 35 (2010)
428–437.
[18] H. Hu, Y. Fan, H. Liu, Int. J. Hydrogen Energy 34 (2009) 8535–8542. [19] Y. Fan, H. Hu, H. Liu, J. Power Sources 171 (2007) 348–354.
[20] B. Tartakovsky, M.F. Manuel, H. Wang, S.R. Guiot, Int. J. Hydrogen Energy 34 (2009) 672–677.
[21] R.A. Rozendal, A.W. Jeremiasse, H.V.M. Hamelers, C.J.N. Buisman, Environ. Sci. Technol. 42 (2008) 629–634.
[22] P. Clauwaert, W. Verstraete, Appl. Microbiol. Biotechnol. 82 (2008) 829–836. [23] S. Cheng, D. Xing, B. Logan, Environ. Sci. Technol. 43 (2009) 3953–3958.
[24] M. Villano, F. Aulenta, C. Ciucci, T. Ferri, A. Giuliano, M. Majone, Bioresour. Technol. 101 (2010) 3085–3090.
[25] Z. He, J. Kan, Y. Wang, Y. Huang, F. Mansfeld, K.H. Nealson, Environ. Sci. Technol. 43 (2009) 3391–3397.
[26] F. Harnisch, S. Wirth, U. Schröder, Electrochem. Commun. 11 (2009) 2253–2256.
[27] A.K. Manohar, O. Bretschger, K.H. Nealson, F. Mansfeld, Bioelectrochemistry 72 (2008) 149–154.