HAL Id: hal-02934867
https://hal.archives-ouvertes.fr/hal-02934867
Submitted on 21 Sep 2020HAL is a multi-disciplinary open access archive for the deposit and dissemination of sci-entific research documents, whether they are pub-lished or not. The documents may come from teaching and research institutions in France or abroad, or from public or private research centers.
L’archive ouverte pluridisciplinaire HAL, est destinée au dépôt et à la diffusion de documents scientifiques de niveau recherche, publiés ou non, émanant des établissements d’enseignement et de recherche français ou étrangers, des laboratoires publics ou privés.
Rare-earth-free zinc aluminium borate white phosphors
for LED lighting
P Gaffuri, M. Salaün, I Gautier-Luneau, G Chadeyron, A Potdevin, L
Rapenne, E Appert, Vincent Consonni, Alain Ibanez
To cite this version:
P Gaffuri, M. Salaün, I Gautier-Luneau, G Chadeyron, A Potdevin, et al.. Rare-earth-free zinc aluminium borate white phosphors for LED lighting. Journal of Materials Chemistry C, Royal Society of Chemistry, 2020, 8 (34), pp.11839-11849. �10.1039/d0tc02196b�. �hal-02934867�
1
Rare-earth-free zinc aluminium borate white phosphors for LED lighting
P. Gaffuri,
a,b,
aI. Gautier-Luneau,
aG. Chadeyron,
cA. Potdevin,
cL. Rapenne,
bE.
Appert,
bV. Consonni,
bA. Ibanez,
aFOOTNOTES
aUniv. Grenoble Alpes, CNRS, Grenoble INP, Institut Néel, 38000 Grenoble, France.
b
Univ. Grenoble Alpes, CNRS, Grenoble INP, LMGP, 38000 Grenoble, France.
c
Université Clermont Auvergne, CNRS, SIGMA Clermont, Institut de Chimie de Clermont-Ferrand, F-63000, Clermont-Ferrand, France.
Corresponding author
’s
e-mail: Mathieu.salaun@neel.cnrs.fr Electronic Supplementary Information (ESI) available.ABSTRACT
The use of rare-earth elements (Y, Ce, Eu...) in commercial phosphor-converted white light-emitting
diodes (pc-WLEDs) raises environmental and geopolitical concerns. Lanthanide-free white emitting
phosphors based on amorphous yttrium aluminium borate (YAB) have previously been synthesized by
the polymeric precursor (PP) method, showing high internal quantum yields (iQY) and a broad
emission band in the visible range. However, yttrium has still been largely present in the amorphous
YAB matrix. Here we synthesize zinc aluminium borate (ZAB) powder by the PP method, a novel
family of rare-earth-free phosphor producing broad and intense photoluminescence emissions when
excited by near-UV from 300 to 400 nm, with high iQYs up to 60%. The photoluminescence band is
easily tuneable in the visible range of the electromagnetic spectrum, from warm- to cold-white
emissions by adjusting either the precursor ratio or the calcination temperature used to prepare the
ZAB powders. Finally, we report spectroscopic arguments that reinforce the hypothesis of the
molecular origin of the photoluminescence in ZAB phosphors. Our results demonstrate the essential
role of the composition (Al / B ratio) and thermal treatment in the transformation and trapping of
carbonaceous species (i.e. black carbon or luminescent molecular species) in amorphous ZAB matrix.
2
for the integration of rare-earth-free single phosphors synthesized by wet chemistry into WLEDs
lighting devices.
INTRODUCTION
Phosphor-converted white light emitting diodes (pc-WLEDs) have recently dominated the lighting
market through their energy efficiency, stability, and ease of integration into smart lighting
technologies, thanks to the development of efficient blue- and near-UV (NUV) emitting gallium
nitride based LEDs1–3 that excite a phosphor to complete the emission and produce white light. The
canonical phosphor for LED lighting consists of the Y3−xCexAl5O12 (YAG:Ce) micron-sized powders
emitting around 550 nm, sometimes associated with Eu2+ doped sulphide or nitride to obtain
warm-white emissions. The strong efficiency of YAG:Ce is related to the unique optical properties of Ce3+ ions - i.e. fast optical transition from 5d- and 4f-electronic levels - as well as to the good hosting
properties of YAG.4,5 Nevertheless, the use of rare-earth (RE) elements in such commercial phosphors,
as emitter (cerium, europium) and host matrix (yttrium), raises environmental and geopolitical
concerns.6,7 Thus, efficient RE-free single phosphors, excitable in the blue / NUV range and exhibiting
a broad emission band extended in the whole visible range, are strategic materials to be developed,
although it remains a major scientific challenge.8,9
On one hand, a tremendous effort has been devoted to the identification of a suitable WLED phosphor
matrix to host RE ions,10–13 including RE-free matrix, which decreases the overall RE content in
phosphors, yet does not remove them completely. On the other hand, phosphors based on a RE-free
photoluminescence (PL) have extensively been studied. Among them, defect-related luminescent
materials, synthesized by chemical methods, are good candidates since they typically combine high PL
efficiency, good stability, ease of fabrication, as well as a broad PL emission.14 Pioneering works on
these materials were done on silicate-based matrices,15,16 which now includes phosphates,17,18 metal
oxides,19–25 boron carbon oxynitride (BCNO),26–28 and carbon-based nanomaterials.29 These phosphors
are promising, although they generally produce blue or bluish-white light, their quantum efficiencies
3
Recently, amorphous yttrium aluminium borate (YAB) have been synthesized by the polymeric
precursor (PP) method, showing high internal quantum yields (iQY) and a warm-white emission.30,31
Amorphous YAB was also synthesized by the sol-gel method, where the emission of polycyclic
aromatic hydrocarbon molecules, trapped in the amorphous matrix during the synthesis process of the
micron-sized powders, was for the first time evidenced by coupling thermal analyses (differential
thermal analysis, thermogravimetry, mass spectrometry), PL spectroscopy, nuclear magnetic
resonance and electron paramagnetic resonance measurements coupled with DFT calculations.32
Nevertheless, yttrium was still used in significant amounts to form the glassy aluminium borate
matrix, acting as a cation glass network modifier.
In this article, we present a novel matrix of RE-free phosphor made of zinc aluminium borate (ZAB)
synthesized by the PP method. The content of zinc, aluminium, and boron is varied, along with the
thermal treatment conditions, in order to elucidate their effects on the morphology, the microstructure
and the trapping of black carbon and molecular PL emitters in the ZAB network. The corresponding
evolution of the PL properties are thoroughly analysed, also by varying the excitation wavelength, to
provide spectroscopic insights into the origin of the luminescence in ZAB phosphors.
EXPERIMENTAL
Synthesis methodThe preparation of ZAB powders was based on the PP methods, also labelled as modified Pechini
methods.30 Zn(NO3)2.6H2O (1 g, 99%, Alpha Aesar), Al(NO3)3.9H2O (3.85 to 9.4 g, 99%, Fisher
Scientific) and citric acid monohydrate (32 g, Fisher Scientific) were dissolved in 50 mL of ultrapure
water (0.63 µS/cm, Fisher Scientific) heated at 80°C under stirring for 15 min. Simultaneously, in a
second solution, H3BO3 (1.20 to 2.46 g, 99.8%, Fisher Scientific) and D-sorbitol (20 g, Fisher
Scientific) were dissolved in 50 mL of ultrapure water heated at 80°C under stirring for 15 min. This
polyalcohol has been chosen instead of conventional ethylene glycol to improve boron complexation,
thus avoiding boron losses during thermal annealings.33,34 The Al / B molar ratio between aluminium
4
precursors (Zn, Al and B) and citric acid was kept at 1:3. The two solutions were then mixed together
and heated under reflux at 100 °C for 44 hours. The solution was partially evaporated at 80 °C to
promote the esterification reactions, leading to a yellowish and viscous resin, which was further dried
at 250 °C during 30 min, under air atmosphere. The resulting dried resin was crushed in a planetary
mill to obtain fine brown powders, then pyrolysed under N2 continuous flux at 700°C during 24 hours,
releasing a large amount of organic moieties through mainly CO2 and H2O losses related to citrate
groups decomposition35 without any drastic combustion reactions. Pyrolysed powders were
subsequently sieved with a 20 m stainless steel mesh. Finally, grains with size under 20 m powders were calcinated at different temperatures ranging from 600 to 1000 °C for 24 hours under O2, forming
the ZAB particles.
Microstructural characterizations
The morphology of ZAB particles was observed in a field emission scanning electron microscope
(FESEM) ZEISS Ultra+ operating with an acceleration voltage V = 20 kV. Analysis of the chemical
composition was carried out on the FESEM equipped with a Bruker EDS system with a Silicon Drift
Detector. Transmission electron microscopy (TEM) and scanning transmission electron microscopy
(STEM) specimens were prepared by depositing a drop of ZAB powders dispersed in absolute ethanol,
onto carbon grids. The surface of the particles was investigated by TEM with a JEOL-JEM 2010
microscope operating at 200 kV with a 0.19 nm point to point resolution. The chemical homogeneity
was assessed with STEM-EDS elemental maps of single particles that were collected with a JEOL
SDD Centurio detector having a large solid angle of up to 0.98 steradians incorporated in the JEOL
2100F field-emission-gun scanning electron microscope operating at 200 kV and having a 0.2 nm
resolution in the scanning mode.
In situ temperature-dependent powder X-ray diffraction (PXRD) was used to record the structural
changes occurring during the calcination step. The powder was dispersed on an alumina crucible
placed at the focal point of the X-ray (Cu K1) incident beam. Diffracted X-rays were recorded from 20° to 120° in 2 under air, from room temperature to 900 °C with a heating rate of 1 °C /min.
Room-5
temperature PXRD patterns were collected with a Brucker D8 Endeavour diffractometer using Cu
radiation in configuration. Optical characterizations
The optical properties were investigated by recording the PL spectra with a Jobin-Yvon set-up
consisting of a Xenon lamp operating at 400 W and two monochromators (Triax 550 and Triax 180)
combined with a cryogenically cold charge coupled device (CCD) camera (Jobin-Yvon Symphony
LN2 series) for emission spectra (exc= 385 nm) and with a Hamamatsu 980 photomultiplicator for
excitation ones. iQY efficie cies d bsorb ce were recorded usi g C9920−02G PL-QY
measurement system from Hamamatsu. The setup comprised a 150W monochromatized Xe lamp, an
integrating sphere (Spectralon Coating, Ø = 3.3 inch) and a high sensitivity CCD spectrometer for
detecting the whole spectral luminescence. Trichromatic coordinates were also determined thanks to
this equipment. All luminescence experiments were performed at room temperature.
RESULTS AND DISCUSSION
Powder synthesisZAB phosphors were synthesized by the PP method, which is suitable to form multi-metal oxides with
a high homogeneity at the molecular level.36 This method has previously been used to synthesize YAB
particles having a strong and broad PL band in the visible range when excited from 250 to 400
nm.30,31,35 In order to synthesize RE-free phosphors, yttrium should be substituted from the
composition, but without major modification of the amorphous structure. Zinc was selected to
substitute yttrium, as their field strengths (i.e. the charge divided by the square of the radius) of 0.52
and 0.53, respectively, are similar37,38. As a result, both cations belong to the category of glass network
modifier, according to Dietzel theory.39 Moreover, Zn2+ (3d10) ions as well as Y3+ (4d0) ions do not
give rise to any absorption in the NUV and visible region.
The powders with the strongest PL were obtained with a Al / B precursor molar ratios of 0.25, 0.5, and
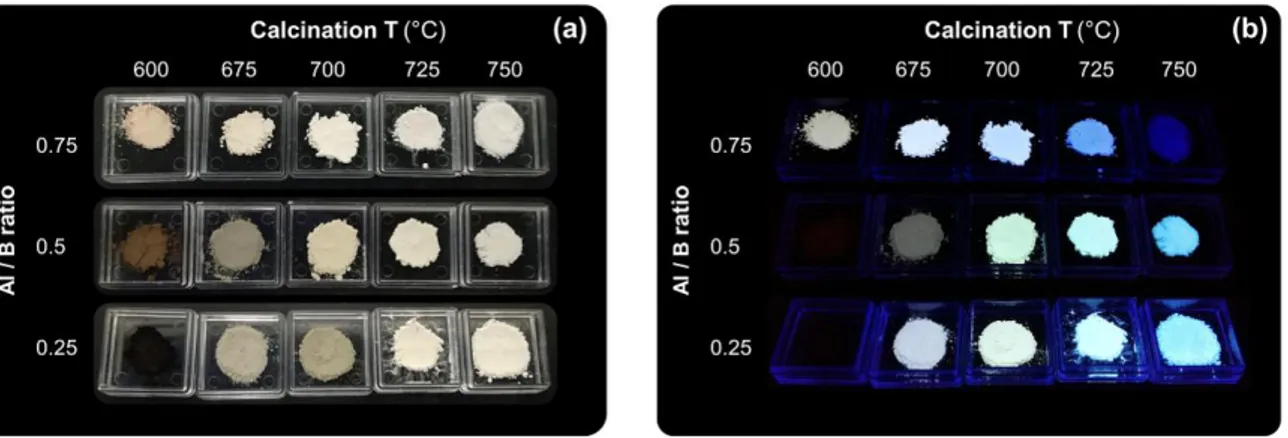
0.75 and a constant ZnO molar ratio of 12%. Photographs of those three optimized ZAB powders
6
a function of the calcination temperature (TCa) ranging from 600 to 750°C. Before the calcination step,
the black colour of carbon-rich pyrolysed powder is attributed to the presence of black carbon arising
from the decomposition of organic precursors, as confirmed by the typical Raman bands of such
disordered carbon shown in Fig. S1.40–42 Accordingly, the brown colour under daylight illumination of
powders calcined with low TCa is attributed to the remaining of small clusters of black carbon formed
during the pyrolysis step.36 When TCa is raised, this trapped black carbon is further oxidized and
released as CO2 gas, as shown by thermogravimetric analysis (TGA) coupled with differential thermal
analysis (DTA) and mass spectrometry (MS) (Fig. S2), as well as SEM-EDS (Fig. S3), leading to the
whitening of the powder. Interestingly, the whitening if the powder occurs at a lower TCa when the Al /
B ratio is increased. Indeed, as shown in Fig. S2, the mass ratio of carbon in calcinated ZAB powder at
600°C is less than 1%, 5%, and 20% for Al / B ratios of 0.75, 0.5 and 0.25, respectively, evidencing
the lower carbon trapping of the matrix when the Al / B ratio is increased.
Fig. 1 (a) Photographs of the optimized ZAB phosphor powders, under daylight and (b) under NUV illumination at 365 nm.
Similarly, the luminescence is strongly affected by TCa. No PL emission occurs with the naked eye in
the ZAB particles calcinated at a low temperature (Fig. 1b), due to the large amount of black carbon
they contain and which absorbs all lights. Increasing the TCa leads to a warmer PL under NUV,
particularly for Al / B ratios of 0.25 and 0.5, which is blue shifted by further raising the TCa, regardless
of the Al / B ratio of the ZAB particles. Finally, the ZAB powders lose their PL properties for a TCa
comprised between 750 and 800 °C (Fig. S4). Hence, there is an optimum TCa range, at which the
7
The chemical purity of the three optimized powders was assessed by SEM-EDS, as shown in Fig. S5a
where the absence of peaks related to other chemical elements in the EDS spectra is clearly shown,
considering the high electron acceleration voltage of 20 kV. The inset shows an enlargement of the
SEM-EDS spectra normalized with respect to the oxygen peak. The good match between the decrease
in the Al / B precursor ratios and the decrease in the intensity of the A Kα pe k shows the successfu
adjustment of the composition of the final oxide particles.
Finally, in addition to the optimized compositions, Fig. S5b shows the other chemical compositions
tested which are very weakly or not luminescent (as observed in Fig. S4), due to the formation of
crystallized solids, as specified in the following paragraph on particle microstructure.
Particle morphology
The morphology of the ZAB particles is shown in the FESEM micrograph in Fig. 2a. A representative
particle with a Al / B ratio of 0.75 and TCa of 675 °C presents a smooth surface and conchoidal
fractures (Fig. 2b) characteristic of a glassy structure, as previously observed in YAB phosphors.43 On
the other hand, a typical particle with Al / B ratio of 0.25 also calcinated at 675 °C has a rough surface
(Fig. 2c). Indeed, the surface of such particles was observed at higher magnification by TEM, showing
a thin shell of crystalline nanowires indexed as phase similar to Al4B2O9, 44
as shown in Fig. 2d, 2e, and
S6. These surface differences between Al-rich and B-rich particles are highlighted for a TCa of 700°C
in Fig. S7, while varying the chemical composition had no significant effect on particle size. Finally,
raising TCa to 1000 °C leads to the formation of entangled non-luminescent whiskers for all Al / B
8
Fig. 2 FESEM micrographs showing (a) a global view of ZAB particles, and single ZAB particles (b) with Al / B = 0.75 and (c) with Al / B = 0.25. (d-e) Bright-field TEM micrographs of the surface of particles with Al / B = 0.25. (f) STEM-EDS elemental maps of ZAB luminescent particles, here for Al / B = 0.75, and TCa = 650°C, showing their good chemical homogeneity. The scale bars are 250 nm.
EDS elemental maps of glassy ZAB particles calcinated at TCa = 650 °C (i.e. below their
crystallization temperature, see next section) were collected by STEM (see Fig. 2f). No element is
shown to be segregated, unlike similar AlBCNO white emitting phosphors.45 The more intense regions
of the elemental maps are only due to larger probed area in overlapping particles, as shown in the
bright-field image. Indeed, the poly-esterification reactions between Al and Zn citrates complexes and
the alcoholate boron ones during the first step of the synthesis avoid the segregation of the metal
cations during the formation of the oxide network, promoting in turn its high molecular homogeneity.
Particle microstructure
As the exothermic peaks observed in TGA-DTA analyses (Fig. S2) can both be attributed to the
9
crystallization behaviour of the powders with Al / B ratios of 0.75 and 0.25 was assessed by in situ
temperature-dependent XRD (Fig. 3). Besides, contrary to our previous work carried out on YAB
vitreous powders,30 we could not clearly identify in this study the glassy transition for ZAB samples
on the DTA curves.
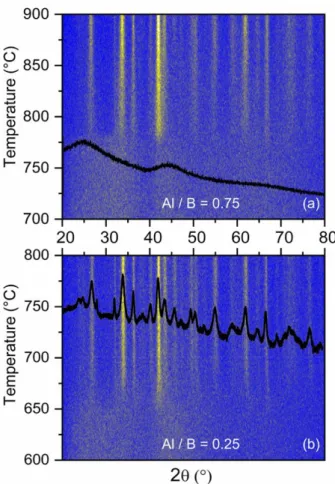
Two broad bands of X-ray scattering centred around 2 = 25° and 45° that are characteristic of the amorphous structure turn into diffraction peaks within a few degrees at around 660 °C for both Al / B
ratios of 0.25 and 0.5 (Fig. S9). In contrast, for the Al / B ratio of 0.75, the crystallization into the
same crystallographic phase is delayed to 775 °C, showing the significant effect of the Al / B ratio on
the amorphous matrix, between Al / B ratio of 0.5 and 0.75. It has been reported in the literature that
increasing the Al content in borate glasses leads to a higher Tg and a decrease in the atomic packing
density. This is attributed to an increase of the coordination number of Al from 4 to 5 and 6,46,47
observed by solid-state NMR when the Al molar ratio exceed 30%,48 i.e. when Al / B > 0.5 in our
case. The increase in Tg should account for the increase in crystallization temperature, while the
atomic packing density affects the release of carbonaceous moieties from ZAB particles. Indeed, we
believe that the larger content of carbon measured in boron-rich particles is due to a denser packing of
the amorphous network, thus trapping the carbonaceous species more efficiently during the calcination
process. It is remarkable that microstructural considerations in melt-quenched glasses seem to apply to
10
Fig. 3 In situ temperature-dependent PXRD diffractogram of ZAB particles (previously pyrolysed) calcinated under air for the compositions (a) Al / B = 0.75 and (b) Al / B = 0.25. To highlight the scattering bands and diffraction peaks, and to overcome the low instrumental counts bellow 225°, conventional room-temperature diffractograms of ZAB powder with corresponding Al / B ratio, calcinated at 750°C, have been superimposed. The diffractogram shown in (b) is indexed in Fig. S10.
In order to identify the resulting crystalline phases, PXRD patterns were registered. The
crystallographic phase could not be found in any databases, yet it showed similarities with that of
Al4B2O9 together with those of Cu2Al6B4O17 or LiAl7B4O17 (see Powder Diffraction Files
00-029-0010, 04-15-3532 and 00-052-1131 respectively),49,50 as shown in Fig. S10, suggesting a zinc
aluminium borate phase. Similarly, the first phase to crystalize in YAB phosphors is Al4B2O9. 30
Very interestingly, the formation of Cu2Al6B4O17 whiskers nucleating from the surface of aluminium
borate particles, before growing as independent micrometric whiskers at higher temperature, has been
reported previously, 49 similarly to ZAB particles in Fig. S8. Nevertheless, the strong PL of fully
11
calcinated from 800 to 1000°C (Fig. S4), rich in the crystalline phase, rules out the hypothesis of
luminescent crystalline phase.
The FESEM and TEM micrographs, together with the analogy with the Cu2Al6B4O17 phase clearly
indicates that only the surface of boron-rich luminescent ZAB particles crystallizes at 660 °C, leaving
a large amorphous core where carbonaceous species are trapped. Inversely, the composition leading to
non-luminescent powders (Fig. S4) are characterized by a strong crystallization. Indeed, an increase in
the ZnO content from 12 % to 20 % led to sharp peaks corresponding to ZnB4O7, in addition to the
previous metal aluminium borate phase (Fig. S11), and the removal of Al led to sharp peaks
corresponding to ZnB4O7 as well as B(OH)3 (Fig. S12). We correlate this crystallization and phase
segregation with their non-luminescence due to the loss of molecular emitters during the complete
crystallization of the matrix, as observed in ZAB and previously in YAB30,35 phosphors, when the TCa
is above 800°C (Fig. S4). These observations show that the presence of a large majority of amorphous
phase in ZAB phosphors through an optimized metallic precursor ratio is necessary for their
luminescence properties.
Photoluminescence properties of ZAB phosphors
In the first part of the article, we showed that Al / B ratios of 0.5 and 0.25 led to similar structural
properties in ZAB powders. The rest of the article will focus on Al / B = 0.5, leaving the very similar
Al / B = 0.25 in the supporting information, to highlight the critical effect of the composition between
Al / B = 0.75 and 0.5 on the PL properties of ZAB phosphors.
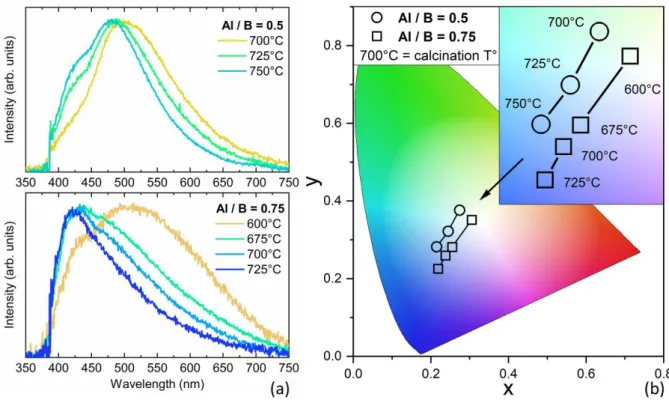
Fig. 4 shows the room-temperature emission spectra of ZAB particles under NUV excitation at
385 nm, which corresponds to the typical emission wavelength of some commercial NUV LEDs. This
analysis hence allows us to estimate the potential of these phosphors for their application as single
12
Fig. 4 (a) Normalized room-temperature PL spectra and (b) chromaticity (CIE 1931) of the ZAB particles excited at 385 nm, for Al / B = 0.5 and 0.75, with TCa ranging from 600 °C to 725 °C and 700
°C to 750 °C, respectively.
The normalized room-temperature PL spectra of ZAB phosphors with Al / B ratios of 0.25, 0.5, and
0.75 are shown in Fig. S13 and Fig. 4a. For all compositions, a broad emission band is observed from
400 to 700 nm which blue shifts by raising TCa. In the case of the Al / B ratio of 0.5, the PL spectra are
centred at 500 nm, and by raising TCa, the warm colour contribution from 550 to 700 nm decreases in
favour of shorter wavelengths from 400 to 450 nm. For the Al / B ratio of 0.75, the PL emission is
extended in the whole visible wavelengths for TCa = 600 °C, while it gradually narrows towards
shorter wavelengths (400-550 nm) when TCa is raised from 675 °C to 725 °C. Finally, the PL spectra
and the variation with respect to TCa are very similar for phosphors with the Al / B ratios of 0.25 and
0.5, as seen in Fig. S13.
The corresponding colour points of ZAB phosphors are depicted in Fig. 4b in a standard
two-dimensional CIE 1931 chromaticity diagram. As expected, the distribution of emitted photons from
ZAB phosphors excited at 385 nm changes from white (pure white being located at x = y = 0.33) to
13
the PP method as well as by the sol-gel process, where a red shift of the emission band has commonly
been observed by raising TCa 30–32
. This can be first attributed to the different role of Zn comparing to Y
in the formation and structure of the amorphous network, thus trapping different molecular emitters.
Moreover, ZAB particles have a significantly lower diameter and size distribution than YAB
phosphors (diameters from 30 to 70 µm) due to the sieving of pyrolysed particle with a 20 µm mesh,
which strongly affects particle formation, as well as the oxidation of carbonaceous species during the
calcination step. Finally it should be noted here that the PL of ZAB phosphors with the highest Al / B
ratio of 0.75 shifts at a significantly lower TCa than for the other two, similarly to the carbon content
(Fig. S2).
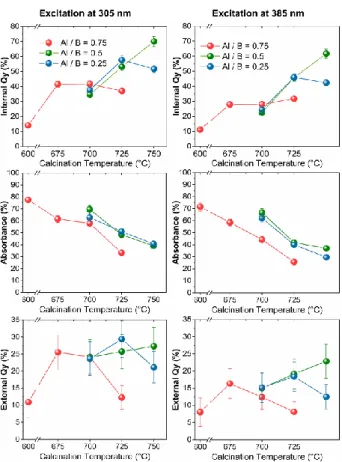
The PL iQY, absorbance (Abs) and external quantum yields (eQY) of the most luminescent ZAB
phosphors are shown in Fig.5, and correspond to the following formulae: 51
(1)
(2) (3)
exc was set to 385 nm, but also to 305 nm, because the excitation-dependent iQY and Abs
measurements showed a maximum for this higher energy value (Fig. S14). iQY and Abs are
consistently higher for exc= 305 nm, and follow the same trends when TCa is varied, regardless of the
14
Fig. 5 Internal quantum yield (iQY), optical absorbance (Abs), and external quantum yield (eQY) of the most luminescent ZAB particles with the Al / B ratios of 0.75, 0.5, and 0.25, and TCa in the range of
600 to 750°C. The phosphors with TCa leading to poor PL quality due to black carbon are not shown.
iQY increases by raising TCa and then stabilizes or even decreases slightly. Abs decreases from more
than 75% for TCa = 600 °C, to less than 40% for TCa = 750 °C. Consequently, the external quantum
yields (eQY) shows a maximum for TCa ranging from 675 °C to 750°C depending on the Al/B ratio.
The increase in iQY by raising TCa is attributed to the gradual loss of black carbon clusters in the
glassy ZAB matrix, as shown in Fig. 1, Fig. S2 and S3. Black carbon is a strong absorber of visible
and NUV light. It therefore absorbs, without radiative relaxation, both NUV photons, which would
otherwise excite the emitters, and the visible photons from the PL - i.e. from the relaxation of exited
emitters.
The decrease in the Abs by raising TCa basically has two main causes. First, similarly to the evolution
of iQY, when black carbon is oxidized during the calcination step, it no longer absorbs NUV photons
that would otherwise excite the emitters. The lower Abs value recorded for the Al / B = 0.75 is
15
luminescence is attributed to molecular emitters (see next section), which are very likely also oxidised
further by raising TCa, resulting in the loss of photoluminescence. Finally, the similar PL, iQY and Abs
of ZAB phosphors with the Al / B ratios of 0.25 and 0.5 are consistent with their similar structural
properties.
To conclude, internal and external QY as well as trichromatic coordinates of elaborated ZAB powders
are presented in Table S1 and show that they are suitable for pc-WLED in the single phosphor
configuration. Boron-rich phosphors (i.e. Al / B = 0.5 - 0.25) are more efficient than Al-rich ones, with
both the best compromise between a high eQY and a warm colour temperature obtained for TCa =
700°C, and the most efficient cold-white emissions for TCa = 725°C, having a high iQY of 49% when
excited at 385 nm. If the iQY values of 50% is nowadays regularly reached in top-tier carbon-based
phosphors emitting blueish light,52–54 it is particularly high for white-emitting phosphors.55 While the
excitation of ZAB phosphors at 305 nm offers even higher QYs, it however leads to a very bluish
emission, as shown in Fig. S15, due to the excitation-dependent emission mechanisms described in the
next section. Moreover, technically, the loss in eQY at higher excitation wavelengths in the NUV
would be compensated by the higher efficiency of the current LEDs emitting at 385 nm compared to
those emitting at 305 nm.
Photoluminescence excitation
A detailed investigation of the PL excitation of ZAB phosphors is presented here, providing new
insights into the molecular origin of PL. Indeed, if the emission of polycyclic aromatic hydrocarbon
molecules have clearly been observed in YAB phosphor synthesized by sol-gel methods,32 the
molecular origin of the PL of YAB phosphors by the PP method has only been suggested from
time-resolved PL studies.56 The PL spectra of ZAB phosphors with the Al / B ratios of 0.75 and 0.5,
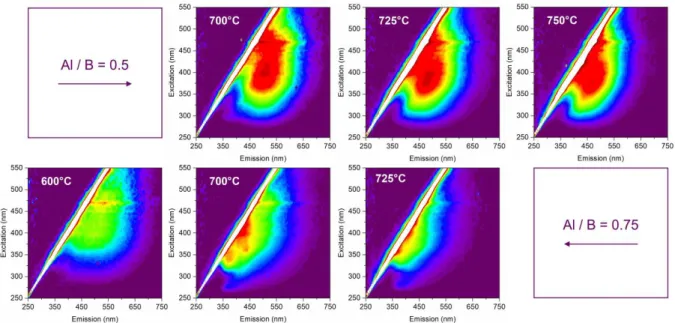
recorded for excitations ranging from 250 to 550 nm have been compiled to form excitation-emission
maps as shown in Fig. 6. The overall TCa-dependent behaviour of the PL is in good agreement with
Fig. 4, with a shift of the emission band towards shorter wavelengths (i.e. blue shift), for all excitation
wavelengths. We can also observe the strong effect of the chemical composition on the PL properties,
16
blue shift in PL spectra, for all excitation wavelengths. Consistently, excitation-emission maps of ZAB
phosphors with the Al / B ratio of 0.25 (shown in Fig. S16) are very similar to that of 0.5. It should be
noted that the ZAB can be efficiently excited in a wide wavelength range compatible with UV and
blue commercial LED.
Fig. 6 Excitation-emission maps of ZAB phosphors with the Al / B ratio of 0.5 and 0.75, and calcination temperature in the range of 700 to 750°C and 600 to 725°C, respectively. The emission spectra were recorded for excitation with a step of 5 nm, from 250 to 550 nm. Relative intensities are indicated by a rainbow coloured map, with red being the most intense, and dark purple the least intense, to show the variation in emission for each exc. The higher intensities for excitation at 450 and
470 nm are measurement artefacts.
Interestingly, these excitation-emission maps show an excitation-dependent emission for all
phosphors, typically observed in small graphene oxide derivatives (GODs) and larger carbon
nano-dots (CNDs).57 This feature is attributed to the presence of many different GODs / CNDs, having each
different radiative energy states. Thus, the set of excited GODs / CNDs varies with the excitation
wavelength, and the PL spectra varies accordingly. This diversity of energy states in GODs / CNDs is
classically attributed to their size: due to quantum confinement, a small sized GODs / CNDs has a
wide energy gap and vice versa.55,58,59 Therefore it is often argued that excitation-dependent emission
17
If luminescent molecular species are primarily suspected in the case of ZAB phosphors, the analogy
with GODs / CNDs is supported by recent results showing the molecular origin of the PL in GODs /
CNDs synthesised by chemical methods.60–63 Thus, the measured excitation-dependent emission may
also indicate a broad distribution of luminescent molecular species, and the blue shift of the PL with
increasing TCa could be attributed to the degradation of luminescent molecular species with a small
energy gap (larger entities), favouring the wide energy gap ones (smaller entities). Accordingly, in
Fig.6, the emission for excitation in the range of 500-550 nm, ascribed to luminescent molecular
species with a small energy gap, vanishes as TCa is raised. Overall, the blue shift of the emission band
of ZAB phosphor is systematically associated with a loss of carbon, which is either due to an increase
in TCa (fig. S3) or to an increase in the Al / B ratio of ZAB particles that traps less carbon (Fig. S2) due
to a more open amorphous network. During the calcination, larger carbonaceous species characterized
by small energy gaps would be more fragile and sensitive to degradation, especially when the
amorphous matrix is less dense. Finally it should be noted that the broad emitting phosphors exhibit a
lower excitation-dependent emission effect. We attribute this to the reabsorption of most energetic
emissions (350 to 450 nm) by molecular emitter with small energy gaps.
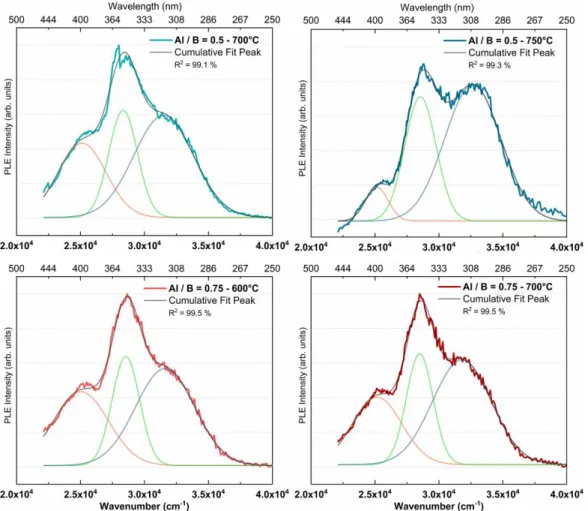
Eventually, calibrated room-temperature PLE spectra of phosphors with the Al / B ratios of 0.5 and
0.75 are shown in Fig. 7, for calcination at 700 and 750 °C, and at 600 and 700 °C, respectively. The
excitation profiles were recorded for em= 500 nm, i.e. 20000 cm -1
. For both compositions, a very
broad excitation signal was obtained, deconvoluted into three Gaussian functions centred around
25100, 28500, and 31600 cm-1 (400, 350 and 316 nm). These excitation profiles further evidence the
existence of several emitting centres, located in various local environments64 due to the amorphous network. Such multi-excitation states together with an excitation-dependent emission have been
observed in carbon dots prepared by hydrothermal synthesis, and also attributed to the presence of
18
Fig. 7 PLE spectra of ZAB phosphors with Al / B ratio of 0.5 and 0.75, and calcinated at the temperature of 700 and 750 °C, and 600 and 700 °C, respectively. The spectra were fitted with three Gaussian functions as a function of the energy, and corresponding wavelength indicated.
For both compositions, the increase in TCa results in a decrease in the low-energy excitation at
25100 cm-1 (0.63 eV), to the favour of high-energy excitation at 31600 cm-1 (1.44 eV), in particular for
the phosphors with the Al / B ratio of 0.5 (Table S3). This modification of the excitation supports the
hypothesis of the degradation of large luminescent molecular species with small energy gap, to the
favour of smaller luminescent molecular species with larger energy gap. Finally, despite a 100 °C
difference in TCa, excitation spectra (Fig. 7) and excitation-emission maps (Fig. 6) of ZAB phosphors
with Al / B = 0.5, TCa = 700°C and Al / B = 0.75, TCa = 600°C appear similar, suggesting that a
boron-rich matrix not only traps carbon more strongly, but also preserves the small energy gap emitting
19
It should be noted here that the only attribution of the optical shifts to the size of the luminescent
molecular species is a simplification, as their stacking65, surface states66, and local environment64, also
affecting their optical transitions, can be modified during the calcination process. The three Gaussian
functions fit does not represent only three optically active luminescent molecular species, but rather
many, separated into three energy gap ranges.
Alternatively, the high-energy excitation at 31600 cm-1 could be attributed to defects in the matrix, that
excite luminescent molecular species, responsible for the warmer part of the PL spectra. This
combination has been observed by Gan et al. in the case of graphene oxide prepared by the Hummers
method.67
Those results further support the hypothesis of the presence of luminescent molecular species trapped
in the micrometric amorphous ZAB and YAB particles, although their clear identification has so far
20
CONCLUSIONS
The PP method has been used to synthesize ZAB phosphors, successfully substituting the yttrium
cation by zinc cation in well-described YAB phosphors. The composition has been optimized for a
given ZnO molar content of 12%, and by varying the Al / B ratio ranging from 0.25 to 0.75, leading to
strongly luminescent powders with broad emission and excitation spectra.
The luminescence appears as the black carbon (strong absorber in the visible) inside the particles is
gradually removed during calcination, then shifts from yellowish to bluish by raising the calcination
temperature, and eventually disappears gradually between 725 and 800 °C, as the luminescent
molecular species are finally decomposed (oxidized) during the matrix crystallization.
The excitation-dependant behaviour of the photoluminescence, as well as the broad excitation band
demonstrate a large amount of radiative energy levels, attributed to a wide variety of molecular
luminescent species trapped during their formation in the amorphous matrix of ZAB particles upon
calcination. The blue shift of the PL by raising the calcination temperature is attributed to the
modification of the nature or distribution of such carbon-based luminescent species, resulting in an
increase in the mean energy of the optical transitions. Modifying the Al / B ratio during synthesis
results in a strong modification of the morphology and microstructure of ZAB particles. In particular,
carbonaceous species are more strongly trapped in the ZAB matrix when the boron content is
increased due to a denser packing of the amorphous network. This leads to a red shift of the PL,
suggesting that large luminescent molecular species with smaller energy gap are preserved.
It should be noted that without optimization of light absorption and extraction, the eQY values are still
high, ranging from 15 to 25% depending on the excitation wavelength. Given the low cost of the
precursors and the up-scalable synthesis, we believe that further device optimization would result in
competitive rare-earth-free phosphors suitable for NUV-LEDs based devices.
These findings report the impact of the microstructure on luminescence of metal borates, which can be
applied to engineer other inorganic oxide fabricated by the PP method, provided they can maintain an
amorphous structure up to a high enough temperature so the black carbon is removed, while having a
21
CONFLICTS OF INTEREST
There are no conflicts to declare.
ACKNOWLEDGMENTS
P. G. held a doctoral fellowship from the CDP Eco-SESA CDP Eco-SESA receiving fund from the
Fre ch N tio Rese rch Age cy i the fr mework of the "I vestisseme ts d’ ve ir” progr m (ANR-15-IDEX-02). The authors further acknowledge the facilities, and the scientific and technical
assistance of the CMTC characterization platform of Grenoble INP, which is supported by the Centre
of Excellence of Multifunctional Architectured Materials (LabEx CEMAM) under the contract
ANR-10-LABX-44-01 funded by the "Investments for the Future" Program. This research was also funded
by Institut Carnot “Energies du Futur” through the “ECOLED” project.
NOTES AND REFERENCES
1 S. Nakamura and M. R. Krames, Proc. IEEE, 2013, 101, 2211–2220.
2 J. Y. Tsao, M. H. Crawford, M. E. Coltrin, A. J. Fischer, D. D. Koleske, G. S. Subramania, G. T. Wang, J. J. Wierer and R. F. Karlicek, Adv. Opt. Mater., 2014, 2, 809–836.
3 J. Cho, J. H. Park, J. K. Kim and E. F. Schubert, Laser Photonics Rev., 2017, 11, 1600147.
4 N. C. George, A. J. Pell, G. Dantelle, K. Page, A. Llobet, M. Balasubramanian, G. Pintacuda, B. F. Chmelka and R. Seshadri, Chem. Mater., 2013, 25, 3979–3995.
5 X. Qin, X. Liu, W. Huang, M. Bettinelli and X. Liu, Chem. Rev., 2017, 117, 4488–4527. 6 European Commission, Study on the review of the list of critical raw materials, 2017. 7 U. S. Geological Survey, in Mineral Commodity Summaries, 2019, p. 200p.
8 D. Chiriu, L. Stagi, C. M. Carbonaro and P. C. Ricci, Phys. Status Solidi Curr. Top. Solid State Phys., 2016, 13, 989–997.
9 C. C. Pavel, A. Marmier, E. Tzimas, T. Schleicher, D. Schüler, M. Buchert and D. Blagoeva, Phys.
Status Solidi Appl. Mater. Sci., 2016, 213, 2937–2946.
10 P. F. Smet, A. B. Parmentier and D. Poelman, J. Electrochem. Soc., 2011, 158, R37. 11 M. Shang, C. Li and J. Lin, Chem. Soc. Rev., 2014, 43, 1372–1386.
12 Y. Zhuo, A. Mansouri Tehrani, A. O. Oliynyk, A. C. Duke and J. Brgoch, Nat. Commun., 2018, 9, 1–10. 13 A. A. Bol, R. Van Beek and A. Meijerink, Chem. Mater., 2002, 14, 1121–1126.
14 C. Zhang and J. Lin, Chem. Soc. Rev., 2012, 41, 7938–7961.
15 W. H. Green, K. P. Le, J. Grey, T. T. Au and M. J. Sailor, Science (80-. )., 1997, 276, 1826–1828. 16 V. Bekiari and P. Lianos, Langmuir, 1998, 14, 3459–3461.
17 C. K. Lin, Y. Luo, H. You, Z. Quan, J. Zhang, J. Fang and J. Lin, Chem. Mater., 2006, 18, 458–464. 18 H. MASAI, J. Ceram. Soc. Japan, 2013, 121, 150–155.
19 F. Gu, S. F. Wang, M. K. Lü, G. J. Zhou, D. Xu and D. R. Yuan, J. Phys. Chem. B, 2004, 108, 8119– 8123.
22
20 M. Anicete-Santos, F. C. Picon, M. T. Escote, E. R. Leite, P. S. Pizani, J. A. Varela and E. Longo, Appl.
Phys. Lett., 2006, 88, 211911–211914.
21 C. Lin, M. Yu, Z. Cheng, C. Zhang, Q. Meng and J. Lin, Inorg. Chem., 2008, 47, 49–55.
22 L. S. Cavalcante, J. C. Sczancoski, J. W. M. Espinosa, V. R. Mastelaro, A. Michalowicz, P. S. Pizani, F. S. De Vicente, M. S. Li, J. A. Varela and E. Longo, J. Alloys Compd., 2009, 471, 253–258.
23 N. Chouhan, C. C. Lin, S. F. Hu and R. S. Liu, J. Mater. Chem. C, 2015, 3, 1473–1479. 24 Y. Kaihatsu, W. N. Wang, F. Iskandar and K. Okuyama, Mater. Lett., 2010, 64, 836–839.
25 T. Hasegawa, Y. Abe, A. Koizumi, T. Ueda, K. Toda and M. Sato, Inorg. Chem., 2018, 57, 857–866. 26 X. Zhang, Z. Lu, H. Liu, J. Lin, X. Xu, F. Meng and C. Tang, J.Mater.Chem.C, 2015, 3, 3311–3317. 27 W. N. Wang, T. Ogi, Y. Kaihatsu, F. Iskandar and K. Okuyama, J. Mater. Chem., 2011, 21, 5183–5189. 28 T. Ogi, Y. Kaihatsu, F. Iskandar, W. N. Wang and K. Okuyama, Adv. Mater., 2008, 20, 3235–3238. 29 S. N. Baker and G. A. Baker, Angew. Chemie - Int. Ed., 2010, 49, 6726–6744.
30 V. F. Guimarães, L. J. Q. Maia, I. Gautier-Luneau, C. Bouchard, A. C. Hernandes, F. Thomas, A. Ferrier, B. Viana and A. Ibanez, J. Mater. Chem. C, 2015, 3, 5795–5802.
31 V. F. Guimarães, A. D. Sontakke, L. J. Q. Maia, M. Salaün, I. Gautier-Luneau, A. Ferrier, B. Viana and A. Ibanez, J. Lumin., 2017, 188, 448–453.
32 P. Burner, A. D. Sontakke, M. Salaün, M. Bardet, J. M. Mouesca, S. Gambarelli, A. L. Barra, A. Ferrier, B. Viana, A. Ibanez, V. Maurel and I. Gautier-Luneau, Angew. Chemie - Int. Ed., 2017, 56, 13995– 13998.
33 P. P. Neves, L. J. Q. Maia, M. I. B. Bernardi, A. R. Zanatta, V. R. Mastelaro, S. M. Zanetti and E. R. Leite, J. Sol-Gel Sci. Technol., 2004, 29, 89–96.
34 K. Nose and M. Zenki, Analyst, 1991, 116, 711–714.
35 V. F. Guimarães, M. Salaün, P. Burner, L. J. Q. Maia, A. Ferrier, B. Viana, I. Gautier-Luneau and A. Ibanez, Solid State Sci., 2017, 65, 6–14.
36 J. Lin, M. Yu, C. Lin and X. Liu, J. Phys. Chem. C, 2007, 111, 5835–5845. 37 G. E. Brown, F. Farges and G. Calas, Rev. miner., 1995, 32, 317–410.
38 A. Nukui, U. Shimizugawa, S. Inoue, H. Ozawa, R. Uno, K. Oosumi and A. Makishima, J. Non. Cryst.
Solids, 1992, 150, 376–379.
39 A. Dietzel, Glasstruktur und Glaseigenschaften, Glastechn. Ber. 22, 1948. 40 T. Jawhari, A. Roid and J. Casado, Carbon N. Y., 1995, 33, 1561–1565.
41 A. Merlen, J. G. Buijnsters and C. Pardanaud, A guide to and review of the use of multiwavelength
Raman spectroscopy for characterizing defective aromatic carbon solids: From graphene to amorphous carbons, 2017, vol. 7.
42 A. Ferrari and J. Robertson, Phys. Rev. B - Condens. Matter Mater. Phys., 2000, 61, 14095–14107. 43 V. F. Guimarães, P. Burner, L. J. Q. Maia, A. Ferrier, B. Viana, I. Gautier-Luneau and A. Ibanez, Proc.
SPIE, 2016, 9749, 97490B.
44 E. M. Elssfah, C. C. Tang, J. Zhang, H. S. Song, X. X. Ding and S. R. Qi, Mater. Res. Bull., 2007, 42, 482–486.
45 T. Ogi, H. Iwasaki, A. B. D. Nandiyanto, F. Iskandar, W. N. Wang and K. Okuyama, J. Mater. Chem. C, 2014, 2, 4297–4303.
23
46 K. Januchta, R. E. Youngman, A. Goel, M. Bauchy, S. J. Rzoska, M. Bockowski and M. M. Smedskjaer,
J. Non. Cryst. Solids, 2017, 460, 54–65.
47 N. Mascaraque, K. Januchta, K. F. Frederiksen, R. E. Youngman, M. Bauchy and M. M. Smedskjaer, J.
Am. Ceram. Soc., 2019, 102, 1157–1168.
48 A. A. Osipov, V. E. Eremyashev, A. S. Mazur, P. M. Tolstoi and L. M. Osipova, Glas. Phys. Chem., 2016, 42, 230–237.
49 C. Zhu, X. Nai, D. Zhu, F. Guo, Y. Zhang and W. Li, J. Solid State Chem., 2013, 197, 1–6. 50 Å. Johan, S. Göran and G. Jekabs, Acta Chem. Scand., 1997, 51, 1045–1050.
51 K. L. Wong, J. C. G. Bünzli and P. A. Tanner, J. Lumin., 2020, 224, 117256.
52 F. Ehrat, S. Bhattacharyya, J. Schneider, A. Löf, R. Wyrwich, A. L. Rogach, J. K. Stolarczyk, A. S. Urban and J. Feldmann, Nano Lett., 2017, 17, 7710–7716.
53 D. Wang, Z. Wang, Q. Zhan, Y. Pu, J. X. Wang, N. R. Foster and L. Dai, Engineering, 2017, 3, 402– 408.
54 D. Qu, M. Zheng, L. Zhang, H. Zhao, Z. Xie, X. Jing, R. E. Haddad, H. Fan and Z. Sun, Sci. Rep., 2014, 4, 1–11.
55 X. Guo, C. F. Wang, Z. Y. Yu, L. Chen and S. Chen, Chem. Commun., 2012, 48, 2692–2694.
56 A. D. Sontakke, A. Ferrier, P. Burner, V. F. Guimarães, M. Salaün, V. Maurel, I. Gautier-Luneau, A. Ibanez and B. Viana, J. Phys. Chem. Lett., 2017, 8, 4735–4739.
57 Z. Gan, H. Xu and Y. Hao, Nanoscale, 2016, 8, 7794–7807.
58 H. Li, X. He, Z. Kang, H. Huang, Y. Liu, J. Liu, S. Lian, C. H. A. Tsang, X. Yang and S. T. Lee, Angew.
Chemie - Int. Ed., 2010, 49, 4430–4434.
59 C. Russo, B. Apicella and A. Ciajolo, Sci. Rep., 2019, 9, 14566.
60 L. Shi, J. H. Yang, H. B. Zeng, Y. M. Chen, S. C. Yang, C. Wu, H. Zeng, O. Yoshihito and Q. Zhang,
Nanoscale, 2016, 8, 14374–14378.
61 M. Fu, F. Ehrat, Y. Wang, K. Z. Milowska, C. Reckmeier, A. L. Rogach, J. K. Stolarczyk, A. S. Urban and J. Feldmann, Nano Lett., 2015, 15, 6030–6035.
62 S. Bhattacharyya, F. Ehrat, P. Urban, R. Teves, R. Wyrwich, M. Döblinger, J. Feldmann, A. S. Urban and J. K. Stolarczyk, Nat. Commun., 2017, 8, 1–9.
63 C. M. Carbonaro, D. Chiriu, L. Stagi, M. F. Casula, S. V Thakkar, L. Malfatti, K. Suzuki, P. C. Ricci and R. Corpino, J. Phys. Chem. C, 2018, 122, 25638–25650.
64 S. Park, E. K. Ji, H. K. Se, J. Seo, K. Chung, S. Y. Park, D. J. Jang, B. M. Medina, J. Gierschner and Y. P. Soo, J. Am. Chem. Soc., 2009, 131, 14043–14049.
65 M. Baroncini, G. Bergamini and P. Ceroni, Chem. Commun., 2017, 53, 2081–2093. 66 H. Ding, S. B. Yu, J. S. Wei and H. M. Xiong, ACS Nano, 2016, 10, 484–491.
67 Z. Gan, S. Xiong, X. Wu, T. Xu, X. Zhu, X. Gan, J. Guo, J. Shen, L. Sun and P. K. Chu, Adv. Opt.
Mater., 2013, 1, 926–932.