HAL Id: halshs-00639321
https://halshs.archives-ouvertes.fr/halshs-00639321
Submitted on 8 Nov 2011
HAL is a multi-disciplinary open access
archive for the deposit and dissemination of sci-entific research documents, whether they are pub-lished or not. The documents may come from teaching and research institutions in France or abroad, or from public or private research centers.
L’archive ouverte pluridisciplinaire HAL, est destinée au dépôt et à la diffusion de documents scientifiques de niveau recherche, publiés ou non, émanant des établissements d’enseignement et de recherche français ou étrangers, des laboratoires publics ou privés.
Meriem Hamdi-Cherif, Philippe Quirion
To cite this version:
Meriem Hamdi-Cherif, Philippe Quirion. General equilibrium impact of an energy-saving policy in the public sector. Environmental and Resource Economics, Springer, 2007, 38 (2), pp.245-258. �10.1007/s10640-006-9075-2�. �halshs-00639321�
Philippe Quirion1 and Meriem Hamdi-Cherif2
General equilibrium impact of an energy-saving policy in the public sector
Environmental and Resource Economics, 38(2): 245-258
Abstract
We analyse a disregarded environmental policy instrument: a switch in government expenditure away from energy (or other natural resources) and toward a composite good which includes energy-saving expenditure. We first develop two variants of an analytical general equilibrium model. A composite good is produced with constant returns to scale, and energy is imported or produced domestically with diminishing returns, yielding a differential rent to its owners. The government purchases energy and composite goods from private firms. Such a policy unambiguously increases employment. It also raises private consumption and welfare under two conditions: (i) it is not too costly and (ii) the initial share of the resource is smaller in public spending than in private consumption, or the difference is small enough. We then run numerically a model featuring both importation and domestic production of energy (oil, gas and electricity), for the OECD as a whole. Simulations show that employment, welfare and private consumption rise. We provide magnitudes for different parameter values. Keywords
Resource conservation, energy conservation, public spending, employment, general equilibrium, multi-sectors models
JEL classification codes E62, H57, Q38
1 CIRED, 45 bis avenue de la Belle Gabrielle, F-94736 Nogent-sur-Marne cedex, France, quirion @
2 CIRED.
1. Introduction
The largest part of the literature on macroeconomic effects of environmental policies deals with ecological tax reforms – the so-called "double dividend" debate (Bosello et al., 2001). However taxes are far from being the most common policy instrument for protecting the environment. Therefore a few recent papers, e.g., Goulder et al. (1999) also analyse emissions quotas, performance standards and mandated technologies. Another instrument worth looking at is the composition of public spending between environmental-friendly and unfriendly goods and services. Indeed, government procurement expenditures account for 9 to 25% of GDP in OECD countries (OECD, 2000). Admittedly, Bovenberg and van der Ploeg (1994) analyse the optimal composition of public spending between a clean and a dirty good, but both are produced with the same production technology.
In particular, a partial but environmentally-efficient measure to fight global warming would be to switch government spending from fossil fuel consumption to energy-efficiency expenditure: thermal insulation, energy-efficient boilers, lighting and appliances, etc. Furthermore, emissions associated with the production of goods and services purchased by the government could be reduced by introducing environmental criteria in the bidding process. In this paper, we explore the macroeconomic consequences of such policies and show that not only do they save energy (the first dividend), but that they also lead to benefits as measured in terms of higher employment. Furthermore, for the most likely values of parameters, an energy-saving policy in the public sector leads to higher household consumption and welfare, provided that the level of public spending in other goods and services does not rise too much to compensate the fall in energy consumption.
To demonstrate these results, we use two variants of an analytical general equilibrium model. The first one is a closed-economy model, presented in the third section. Its main peculiarity is a mixed industrial structure, with a composite good produced with constant returns to scale and a domestic natural resource (energy for instance) extracted with diminishing returns, which yields a differential (Ricardian) rent to its owners. The government purchases natural resources and composite goods from private firms. This model builds heavily on Dixon and Hansen (1999) and Dixon and Pompermaier (1999), though they studied a completely different topic: the effectiveness of monetary policy in presence of menu costs. Although many resources are internationally traded, looking at such a closed-economy model is useful because some resources, like aggregate or limestone, are not much internationally traded and because it highlights important mechanisms. Section 4 presents the second variant of the model, the open economy version, which features an imported resource and exportation of the composite good. Section 5 presents an open-economy model with both domestic production and importation of the resource, which is numerically solved and calibrated for the OECD using GTAP and STAN data. Conclusions are drawn in Section 6. Beforehand, section 2 provides some information on resource-saving policies in the government sector.
2. Resource- and Energy-saving programs in the Government sector in practice
One of the most direct ways a government can save energy and other natural resources is cutting down its own consumption. However, until recently, very few countries had concerted energy management programs for the government sector (Borg et al., 1998). Since then, the situation has somewhat improved (OECD, 2003). In the U.S., an Executive Order3 states that
3
each federal agency shall reduce its greenhouse gas emissions attributed to facility energy use by 30 percent by 2010 compared to such emissions levels in 1990. The Federal Energy Management Program has been created to help Federal agencies increase energy efficiency, use renewable energy, and conserve water. In European countries, most national climate change programmes include provisions to reduce CO2 emissions from the public sector.
Moreover the European Climate Change Program includes an initiative and a proposed directive on energy-efficient public procurement, with the aim of saving 25 to 40 millions tonnes of CO2 per year by 2005 compared to business as usual (European Commission, 2001).
Finally, on July 19th 2002, the Japanese Cabinet approved a plan that commits the national government to cutting greenhouse gas emissions at ministries and affiliated bodies by 7 percent of 2001 levels by 20064.
Such a development is not surprising: to quote Borg et al. (1998), "Government-related facilities are often the largest energy users in a country and the single most important customers for energy-using products and services." Furthermore, technologies are available in order to significantly cut energy consumption in the public sector: thermal insulation techniques, efficient heating, ventilation and air conditioning systems, efficient appliances, boilers, motors and lighting systems, buildings energy management systems, etc.
Most public sector emissions relate to the building sector which, according to most engineering estimations, produces the highest potential CO2 emission reduction for a low
carbon cost (see Moomaw and Roberto-Moreira, ed., 2001, and references therein). In addition, most of these studies conclude that some reductions are available at a negative net cost – that is, the reduction in the energy bill is higher than the energy-saving expenditure.
This raises the question of why this "energy-efficiency gap" exists (Jaffe and Stavins, 1994). This paper, which points out some positive macroeconomic feedback from such policies, just makes the existence of such a "no-regret potential" more important – thus more unexpected. A detailed examination of this issue is well beyond the scope of the present paper. However, in the particular context of the public sector, it should be stressed that organisational barriers often play a prominent role: people who are in a position to save energy seldom have an incentive in making such decisions. For instance, departments are often not accountable for energy costs, nor are the actors responsible for purchasing equipment (Sorrell, ed., 2000). Because the energy-efficiency gap is a matter of argument for energy engineers as well as economic theorists, we prefer not to make particular assumptions on this question. Therefore we do not model a public good production function. Rather, we look in turn at the effect of the
share of resource in public spending, and at that of the level of public spending. This allows
us to point out the relevance of the financial profitability of the government resource-saving policy – i.e., would the decrease in energy bill be higher than the energy-saving expenditures? – for our results.
3. The model using a domestic resource
3.1. Households
A representative household derives utility from leisure and from the consumption of a natural resource, CR, and a composite good, CC. The quality of environment does not enter the utility
function, nor does public spending. The former assumption is common in the double dividend debate and the latter in the literature on the effects of fiscal policy; cf. for instance Dixon and Lawler (1996). Formally
1 1 1 ( ) ( ) ( , , ) (1 ) 1 R C R C C C U C C L L γ β β γ β β
γ
β
β
γ
+ − − = − − + , (1)The second term of the utility function is the disutility of labour (l). γ represents the real wage elasticity of labour supply.
The consumer price index is given by
(
) ( ) ( )
P PR,PC = PR β PC 1−β
(2) The budget constraint of the household is
R R C C
P C +P C ≤ ⋅ + −W l π φ (3)
Where W is the nominal wage, which is assumed to be the same in the two sectors, meaning that there is perfect labour mobility between both sectors.
π
is the nominal rent received by the household and φ is a lump-sum tax.Maximising utility subject to the budget constraint yields aggregate private consumption and labour supply: R R C P β = (4) 1 C C C P β − = (5) W L P γ = (6)
The first two equations state that constant shares of income are spent on the natural resource and on the composite good. The third equation states that the labour supply is a function of the real wage and of the elasticity of labour supply.
3.2. Firms
All firms regard the nominal wage W and prices PC and PR as exogenous. The production
function of all firms in the composite sector is characterised by constant returns to scale, which is consistent with empirical estimates. For instance, Crépon et al. (1999) or Klette (1994) obtain a scale elasticity around one for French and Norwegian manufacturing industries respectively.
The output is normalised to be equal to employment. Therefore we have
C C
Q =L (7)
PC =W
(8) In the sector producing the natural resource there are constant or diminishing returns with
( )
R R L Q αα
= (9)Where
α
∈] [
0,1 is the magnitude of decreasing returns in resource production. A corollary is that all deposits but the least productive yield a differential rent to their owners. The assumption of decreasing returns, which is crucial for our results, deserves some attention. Such an assumption has a long pedigree, dating back to Ricardo (1821, chapter 3)5. Since then, it has been used and tested by various authors who have constructed so-called cumulative cost functions, by which cumulative extraction of a non-renewable resource determines its shadow cost of extraction. One of the most comprehensive treatments is the
5 "Mines, as well as land, generally pay a rent to their owner […]. If there were abundance of equally fertile mines, which any
one might appropriate, they could yield no rent; the value of their produce would depend on the quantity of labour necessary to extract the metal from the mine and bring it to market. But there are mines of various qualities, affording very different results, with equal quantities of labour. […] The return for capital from the poorest mine paying no rent, would regulate the rent of all the other more productive mines. This mine is supposed to yield the usual profits of stock. All that the other mines
model set up by Nordhaus (1973, 1979) for several primary energy resources (oil, natural gas, coal, shale, uranium) and several regions of the world. He uses step-shaped extraction cost functions: marginal cost rises step-by-step with the stock extracted. Livernois and Uhler (1987) empirically demonstrate that, in the case of oil, the dependence of costs on cumulative extraction is twofold. First, low-cost reservoirs tend to be found first. As exploration progresses, increasingly out-of-reach reserves are discovered, with correspondingly higher extraction costs. Second, by lowering the pressure of oil occurring in a natural petroleum reservoir, cumulative extraction raises the cost of further exploitation. For more references, see Epple and Londregan (1993) who survey this literature. In addition, note that some recent dynamic general equilibrium models feature a cumulative cost function in fossil fuel production (e.g., Bovenberg and Goulder, 2000)6.
From (9), profit maximisation leads to the demand for labour in the resource sector: 7
L W P R R = − − 1 1 α (10) 3.3. The State
The government consumes natural resources and composite goods supplied by private firms8 and financed by lump-sum taxes. The government budget is always balanced. The share of natural resource in public spending is λ. Government demand functions in real terms are
R R G P λ φ = (11)
produce more than this, will necessarily be paid to the owners for rent."
6
We use a Ricardian rather than a Hotelling-like model because the latter does not take into account the heterogeneity of extraction costs (Bjerkholt, 2004), which is crucial especially for natural gas and oil.
7
1 C C G P λ φ − = (12)
Where φ is the nominal level of public spending, equal to the total tax revenue so as to balance the government budget. The two equations above state that government real spending in each good is an exogenous part of its revenue deflated by the price of the goods.
3.4. Equilibrium and comparative static
Solving the model, we find that the relative price of the composite good and the natural resource is given by
(
)
(
)
( ) P P C R = − + − + + − − + 1 1 1 1 1 1β φ
λ
α β φ λ
α γβ α (13) Total employment is(
)
(
)
( ) ( ) 1 1 1 1 1 1 L γβ α γβ αβ φ
λ
α β φ λ
− − + − + − = + + (14) Employment in the resource sector being(
)
(
)
( ) LR = − + − + + − − + 1 1 1 1 1 1β φ
λ
α β φ λ
γβ α (15) A "balanced" variation of the nominal level of public spending, i.e. whenλ β
= , is neutral on employment9:
8
Direct employment in the public sector would be equivalent to public consumption of composite goods.
9
This would not hold if public spending or leisure entered households' utility function in a non-additive way, if public spending entered production functions (as in Turnovsky and Fisher, 1995, for instance), or with distortionary taxation (as in Heijdra et al., 1998). We have ruled out these well-known mechanisms in order to disentangle the effects of the level of
0
L
φ
∂ =
∂ when λ β= .
More interesting is the employment effect of the share of the natural resource in public spending
(
)
(
)
( ) ( )(
)
( )(
)
(
)
(
)
1 1 1 1 1 2 1 1 1 1 1 Lα βγφ
φ
α β λφβ φ λ γβ α∂
∂ λ
α βγ
α
β λφ
− − + − − + + − + + = − − + + (16)The effect is null in case of constant returns in natural resource production (α =1) or when labour supply is fixed (γ =0 ) and strictly negative in every other case. Thus there is what we may label a "public spending employment dividend" from saving natural resources in the public sector.
The explanation is straightforward: a decrease in public consumption of the natural resource stops the production from the least efficient deposits. Hence, the price of the resource, which is set by the least efficient deposit, falls, raising real wage hence (as the labour supply curve is upward-slopping) employment.
Since the level of public spending is neutral, this result holds irrespective of the financial profitability of such a programme, i.e., would the lessening in natural resource bills exceed the expenditures needed to decrease this bill? This result is interesting since the potential for financially profitable energy-efficient investments is highly debated (see section 2 above). Utility from total private consumption (i.e., the first part of the utility function in equation 1) is
( ) ( )
(
)
( ) ( )(
)
C= + + − + − + −+− −− 1 1 1 1 1 1 1 β φ λ α β λφ β α βγ αα β λφ
(17) The effect of the level of nominal public expenditure is given by(
)
(
)
(
(
)
)
(
(
)
)
(
(
)
)
(
)
( ) ( )(
)
(( ))(
)
(
)(
)
(
(
)
(
(
)
)
)
(
)
∂ ∂φ β α β α γλ α βγ λ α λ φ α α βγ β λφ β α φ λ α β φ λ α β λφ α β α βγ C = − − − + − + + − − − + + − + − − + − − − + − + −+ −− − 1 1 1 1 1 1 1 1 1 1 1 1 1 1 1 1 1 1 1 1 1 2 (18)which is negative: an increase in public spending crowds out private consumption, as usual in a model without increasing returns or nominal rigidities. The effect on private consumption of the share of natural resource in public expenditure is given by
(
)
( ) ( )(
)
( )(
(
)
(
(
(
)
)
(
(
)
)
)
)
(
)
(
)
(
)
(
(
)
(
(
)
)
)
1 1 1 1 1 2 1 1 1 1 1 1 1 1 1 1 1 1 C β αβ β φ λ βγ α α β λφα φ
β λ φ γβ
β
α
φ
λ
α
∂
∂ λ
α
βγ
α
β λφ
β
α φ
λ
α
− + − − + − + − + − + − + − − + − − = − − − + − − + − − (19)which equals zero in case of constant returns in natural resource production (α =1). When 1
α < , because the denominator and the first term of the numerator are positive, the above expression is strictly negative if and only if
(
)
(
)
( )
(
)
(
)
λ β
β
α β γ
φ
α βγ φ
< + − − + − − 1 1 1 1 1 (20)Since the second part of the RHS is positive, this inequality means that if the initial share of natural resource in public expenditure is not greater than that of private consumption (λ β≤ ), then (i) a decrease in λ unambiguously increases private consumption; (ii) an increase in λ reduces private consumption, up to a certain point according to parameters. This last non-monotonic response proceeds from the combination of two antagonistic effects. Firstly, real wage and employment decrease with λ, lessening purchasing power of households. Secondly,
abstracting from the first effect, the consumer price index decreases as soon as the allocation of public spending λ departs from that of households β, improving purchasing power of households. Simulations of section 5 using data for the OECD indicate that condition 21 is likely to hold for a public-sector energy-saving program in this group of countries.
However, remember that from (18), public spending crowds out private consumption. Hence, if the energy-saving program is not financially profitable and if the government wants to maintain the supply of public goods, the level of public spending will rise and private consumption may fall.
Let us turn to environmental effectiveness. Formally
( ) ( )
(
1 1)
1 1( ) 1 R Q α β λ φ α βγ α β λφα
− − + − + − + + = (21)(
)
( ) ( )(
)
( )(
)
(
(
)
)
(
(
)
(
(
)
)
)
1 1 1 1 1 1 1 1 1 1 1 1 R Q α β φ λ βγ α α β λφφ
φ
∂
∂ λ
β λφ
βγ
α
β
α φ
λ
α
− − + − + − + + + = + − − − − + − − (22)which is positive. Intuitively, a decrease in public demand for natural resources reduces the relative price of the resource and raises private demand for the resource. However, this ‘rebound’ effect is never sufficient to cancel out the ‘first dividend’, i.e. resource extraction decreases nevertheless. This is easily understandable with a reductio ad absurdum: if the aggregate demand for the resource were to rise, so would its supply hence its price in terms of labour; real wage and employment would then decrease, which we know is false (equation 16).
( ) ( )
(
)
(( ))(
)
(
(
)
)
( ) ( ) 1 1 1 1 1 1 1 1 1 1 1 1 1 1 U β α γβ α β φ λ βγ α βγ α α β λφγ
β φ
λ
α β λφ
γ
α β λφ
− − − − − + − + − −+ − + + − + − = − + + + + (23)Since government spending does not enter households' utility function, a "balanced" rise in φ, i.e. when λ β= , reduces households' utility:
( )
(
)
(( ))(
)
1 1 1 1 1 1 2 1 1 U α β α β α βγ αβ ∂ ∂ φ αβ φ − − − − − + − + = − + when λ β= (24)which is negative. The impact of a decrease in
λ
is ambiguous since consumption rises – as long as condition (20) holds – but leisure declines:(
)
(
)
( ) ( )(
)
( )(
)
(
(
)
)
(
)
1 1 1 2 1 1 2 1 1 1 1 1 1 U C α βγ φ φ α β λφβ φ λ βγ α ∂ ∂ ∂ λ ∂ λ α γ βγ α β λφ − − + − + − + − + + = + + + − + (27)Simulations laid out in section 5 show that the consumption effect is likely to outweigh the leisure effect, i.e., utility closely mimics consumption and is likely to rise when condition (20) holds.
We do not examine the welfare-maximising level of λ because we prefer not to model the production of public goods, as explained at the end of section 2. The functional form chosen would clearly have a determining impact on the welfare-maximising level of λ.
4. The model with an imported resource
Up to now, we have presented a closed-economy model, which is useful since it clarifies some mechanisms at stake and since it may apply directly to some resources, which are not much traded, e.g., aggregates or limestone. Yet it suffers from an obvious limitation, i.e., many natural resources are internationally traded, a situation addressed by the second version of the
model, presented below.
Compared to the model presented in section 3, equations (1) to (8), as well as (11) and (12) are left unchanged. The others are modified as follows.
4.1. International trade
We assume that the considered country is large, i.e., that its demand is big enough to influence the world price. The export of the resource to the considered country is driven by
( )
R R
X = P δ (26)
Where δ is the price elasticity of resource exports10. The higher the price, the more deposits will be cost-competitive enough to produce. The external balance is equilibrated:
R R C C
P X =P X (27)
Where XC is the export in composite good.
At last, since there is only one sector, C
L=L (28)
4.2. Equilibrium and comparative static
The model is easily solved:
(
)
1 1 R P =β λ φ
+ ⋅ +δ (29)(
1)
1 1(
)
(1 )(1 ) W β γ β γ β γ δφ
+ ⋅β λ φ
+ ⋅⋅ + = + + ⋅ (30) 10To simplify notations, and without loss of generality, we normalise PR and XR to their value in the business-as-usual scenario.
(
1)
1(
)
(1 )(1 ) L β γ β γ β γ β γ δφ
⋅β λ φ
− ⋅ + ⋅ + ⋅ + = + + ⋅ (31)(
1)
11(
)
(1 ( )1)(1 ) C β γ β β γ β γ δφ
− −β λ φ
− ⋅ + + ⋅ + ⋅ + = + + ⋅ (32)(
1)
11(
1)(
)
(1 ( )1)(1 ) 1 U β γ β β γ β γ δφ
γ φ β λ φ
γ
+ − − − + ⋅ + ⋅ + + − ⋅ + ⋅ = + (33)The impact of the policy is also easy to obtain:
(
)
(
)
( )( )(
)(
)
1 1 1 1 1 1 1 L β γ β γ β γ β γ δβ γ φ
φ
β λ φ
λ
β γ
δ
⋅ − − ⋅ + ⋅ + ⋅ + ⋅ ⋅ + + ⋅ ∂ = − ∂ + ⋅ + (34)which is negative. Hence, as in the closed economy case studied in section 3 above, a decrease in the share of the resource in public demand boosts employment.
(
) (
)
(
)
( ( ))( )(
)(
)
1 1 1 1 1 1 1 1 1 1 C β γ β β γ β γ δβ
γ φ
φ
β λ φ
λ
β γ
δ
+ − − − − + ⋅ + ⋅ + + + + ⋅ ∂ = ∂ + ⋅ + (35)which is negative. In other words, a decrease in the share of the resource in public demand raises private consumption. Regarding welfare,
(
)
(
)(
)
( ( ))( )(
)(
)
1 1 1 1 1 1 1 1 1 1 U β γ β β γ β γ δβ φ
φ
γ φ β λ φ
λ
β γ
δ
+ − − − − + ⋅ + ⋅ + ⋅ + − ⋅ + ⋅ ∂ = ∂ + ⋅ + (36)This expression is negative if and only if g f < 1, which is always true in the real world, since
f is around 0.2 and estimates for g are generally below one.
5. Numerical simulations
In the real world, energy is both imported and domestically produced. We thus developed such a model, but since it could not be solved analytically, we solved it numerically and presented the results for a wide range of parameters. Compared to the model in section 3, equations (1) to (12) are left unchanged. Equations (26) to (28) from section (4) are added. Two equations representing the equilibrium in each good market are added:
C C C C
Q =C +G +X (37)
R R R R
Q +X =C +G (38)
We run the model for the OECD11 with data for year 2001. This focus on the OECD is justified by the work of the OECD secretariat in favour of such policies (OECD, 2000, 2003). The OECD STAN database provides total employment for OECD member States: 411 millions. The GTAP 6 database from Purdue University provides the other necessary data, i.e., the share of the public sector in the economy and the share of the energy sector in the private and the public sectors, as well as imports and exports of our two goods12. We include in the energy sector electricity generation, coal, oil and gas production and refining. We find β=0.03, λ=0.01 and φ=0.2. Note that these parameters are computed for 2001, and that with the surge in oil and gas price since then, β and λ would certainly be higher now, but 2001 is the last year for which GTAP data are available.
11 By OECD, we mean OECD Member States in 1990.
12 Two technical difficulties had to be overcome. First, the country aggregation module in GTAP does not
eliminate intra-region trade (for example intra-OECD trade when an OECD region is defined). We developed a new aggregation module to address this issue. Second, a part of the public sector in GTAP is considered as a final demand while another part is considered as a productive sector. We thus modified the GTAP input-output matrix to include all the public sector in the final demand.
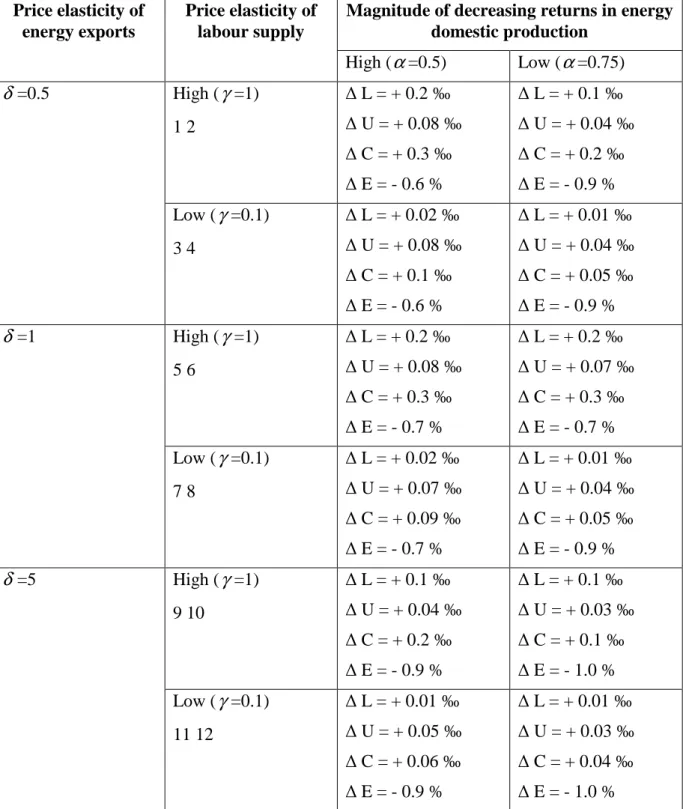
Twelve scenarios are generated by varying the parameters that cannot be directly inferred from data: the elasticity of labour supply γ , the magnitude of decreasing returns in resource production
α
and the elasticity of exports δ (table 1). This enables us to cover a wide range of values for the parameters. We simulate the impact of a 20% reduction in energy consumed by the public sector, combined with a rise in composite good consumption by the same amount. This target is in line with existing programs in the U.S. and the European Union (cf. section 2 above).Table 1 here
It turns out that for every set of parameters, the impact of the policy on employment, private consumption and welfare is positive. However the quantitative impact is limited: employment rises from 0.01 to 0.2‰, i.e. from +4 000 to +82 000 jobs. Private consumption and welfare rise at most by only 0.3‰. This is modest of course, but one cannot expect a large side effect from what is only a partial climate change mitigation measure. Macroeconomic evaluations of the more ambitious carbon/energy tax proposals typically predict an employment impact of +0.1% to +0.7%, much higher figures, but an unclear effect on welfare (Majocchi, 1996). Furthermore, the environmental effectiveness of the policy is not negligible: energy consumption decreases by -0.6% to -1%. The impact in terms of CO2 abatement is probably higher: the marginal CO2 content of electricity is higher than its average one, existing nuclear and renewable producing units having a lower marginal cost than fossil-fuel power stations. The ex ante impact (i.e., before economic retroactions) of the 20% decrease in public energy consumption equals 1.89% of total business-as-usual energy consumption. This means that around half of the ex ante savings are lost through the "rebound" effect analysed in section 3
above. This is the price at to which the second dividend (higher employment, private consumption and welfare) comes.
As for the parameter values, it turns out that the more decreasing the returns in energy domestic production are, the higher the positive economic impacts are but the higher the rebound effect is too. The same conclusion stands for a higher price elasticity of labour supply. Both conclusions are consistent with the analytical model of section 3. The price elasticity of energy exports has a non-monotonic effect on all output variables, but with the small-country case, which implies δ → +∞, λ does not impact L, C nor U. In other words, there is no second dividend.
6. Concluding remarks
We have shown that a switch in public spending away from a natural resource (especially energy) and towards a composite good increases employment, real wage and workers' utility except under the small-country case. It also raises private consumption and welfare under two extra conditions. First, the initial share of energy in public spending must be smaller than that of private consumption, or the difference must be small enough. Simulations show that this is the case for energy in OECD countries. Second, it must not entail too high a rise in the aggregate public spending. This last question is a discussion topic for energy engineers as well as economic theorists and is outside the scope of this paper.
Furthermore, although the private demand for the resource rises following the switch in public spending, this ‘rebound’ effect is never sufficient to cancel out the ‘first dividend’, i.e. resource consumption decreases whatsoever.
Thus, except in the small-country case, there is always an "employment dividend" from saving energy in the public sector, and also a "welfare dividend" if such policy is not too costly.
Admittedly modest in quantitative terms, these macroeconomic effects are not trivial when compared to those predicted for ecological tax reforms.
Such policy is not Pareto-improving: households that only earn rents are worse off (since real rents decline) while those earning only wage income are better off (because real wage rises). It can be seen as a (small) step towards what Keynes (1936, chapter 24) names "euthanasia of rentiers" – the latter being the owners of the natural resource in the present model.
The crucial assumption here is that marginal returns are decreasing in the natural resource sector and are constant in the composite sector. The rationale for the former assumption is that low-cost reservoirs tend to be found first. As exploration progresses, increasingly inaccessible reserves are discovered, with correspondingly higher extraction costs. This assumption is in line with empirical modelling of exhaustible resource supply and with the dynamic general equilibrium models that distinctively model fossil fuel supply. In the composite sector, the constant returns assumption is in agreement with empirical estimates.
The other important modelling choices are those that purposively entail the neutrality of the level of public spending on employment: neither public spending nor leisure enter households' utility function in a non-additive way, public spending does not enter production functions, and lump-sum taxation is available. We have ruled out these mechanisms in order to disentangle the effects of the level of public spending, which is highly debated and covered by a large literature, from those of its composition.
The mechanisms we have formalised in this paper are best thought of as long term effects. In the short run, various rigidities may hold. On the one hand, labour (and also capital) mobility is obviously not perfect. Hence, a decrease in public demand for the natural resource might
harm employment and private consumption in the short term13. On the other hand, price rigidities may occur. If prices were sticky, a decrease in the share of energy in public expenditure would also raise real wage and employment, through a different mechanism than the one met in our model. Simply, since all the turnover of the composite sector is used for hiring labour while a part of that of the resource sector is distributed as rents, employment intensity of the former is larger than that of the latter.
Up to now, the bulk of the literature on macroeconomic effects of environmental policies has focused on tax reforms. Moreover it has typically neglected the technical heterogeneity found across the sectors. Our results are an invitation to devote more attention to other environmental measures than ecological tax reforms and to the modelling of the specific features of environmental-friendly and unfriendly sectors.
13
However this adverse consequence cannot be taken for granted. Indeed Ramey and Shapiro (1998) analyse the effects of sector-specific changes in government spending in a model with two symmetric sectors. Following an increase in government spending in one sector, real wage and employment are higher when the reallocation of capital across sectors is costly.
References
Bjerkholt, O. (2004) Lecture notes on the Theory of Non-renewable Resources, Department of Economics, University of Oslo, available at http://folk.uio.no/olavbj/teaching/LN-2.pdf
Borg, N., E. Mills, N. Martin, and J. Harris, 1998, "Energy Management in the Government Sector: An International Review", Proceedings of the 1997 ECEEE Summer Study, Prague, Czech Republic. (European Council for an Energy-Efficient Economy, www.eceee.org)
Bosello, F, C. Carraro and M. Galeotti, 2001, "The double dividend issue: Modelling Strategies and Empirical Findings", Environment and Development Economics, 6(1), 9-45 Bovenberg, A.L. and F. van der Ploeg, 1994, "Environmental Policy, Public Finance and the Labour Market in a Second-Best World", Journal of Public Economics, 55(3), 349-90
Bovenberg L. and L. Goulder, 2000, Neutralising the adverse industry impacts of CO2
abatement policies: What does it cost?, Fondazione Eni Enrico Mattei Working Paper
68.2000
Crépon, B., R. Desplatz and J. Mairesse, 1999, Estimating price cost margins, scale
economies and workers' bargaining power at the firm level, INSEE/DESE working paper G
9917, Malakoff, France
Dixon, H.D. and C.T. Hansen, 1999, "A mixed industrial structure magnifies the importance of menu costs", European Economic Review, 43, 1475-1499
Dixon, H.D. and P. Lawler, 1996, "Imperfect Competition and the Fiscal Multiplier",
Scandinavian Journal of Economics, 98(2), 219-31
economies with a mixed industrial structure", Open Economies Review, 10, 365-384
Epple, D. and J. Londregan, 1993, "Strategies for modelling exhaustible resource supply", Chapter 22 in A. Knees and J. Sweeney, Handbook of natural resource and energy
economics, Volume III, North-Holland
European Commission, 2001, European Climate Change Programme Report, June, Brussels Goulder, L.H., I.A.W. Parry, R.C. Williams and D. Burtraw, 1999, "The cost-effectiveness of alternative instruments for environmental protection in a second-best setting", Journal of
Public Economics, 72, 329-360
Jaffe, A.B. and R.N. Stavins, 1994, "The energy-efficiency gap - What does it mean?", Energy
Policy, 22(10)
Keynes, J.M., 1936, General theory of employment, interest and money, Collected Writings of John Maynard Keynes, Macmillan, London
Klette, J., 1994, Estimating price-cost margins and scale economies from a panel of micro
data, Discussion Paper 130, Statistics Norway
Livernois, J.R. and R.S. Uhler, 1987, "Extraction costs and the economics of non-renewable resources", Journal of Political Economy, 95(1), 195-203
Majocchi, A., 1996, “Green Fiscal Reform and Employment: A Survey”, Environmental and
Resource Economics, 8(4), 375-397, December
Moomaw, W. and J. Roberto-Moreira, ed., 2001, "Technological and Economic Potential of Greenhouse Gas Emissions Reduction", Chapter 3 in Intergovernmental Panel on Climate Change, Working Group III, Climate Change 2001 – Mitigation, Cambridge University Press Nordhaus, W.D., 1973, "The allocation of energy resources", Brookings paper on Economic
Activity, pp. 529-70
Nordhaus, W.D., 1979, The efficient use of energy resources, Cowles Foundation Monograph 26, Yale University Press, New Haven, CT
OECD, 2000, Greener Public Purchasing: Issues and Practical Solutions, OECD, Paris OECD, 2003, The Environmental Performance of Public Procurement: Issues of Policy
Coherence, October, OECD, Paris
Ramey, V. and M. Shapiro, 1998, "Costly capital reallocation and the effects of government spending", Carnegie-Rochester Conference Series on Public Policy, 48, 145-94
Ricardo, D., 1821, On The Principles of Political Economy and Taxation, Third edition, John Murray, Albemarle-Street, London
Sorrell, S., E. O'Malley, J. Schleich and S. Scott, 2000, Barriers to Energy Efficiency in
Table 1. Impact of a 20% cut of the share of energy in public demand L: employment, U: welfare, C: private consumption, E: energy consumption Price elasticity of
energy exports
Price elasticity of labour supply
Magnitude of decreasing returns in energy domestic production High (