RESEARCH OUTPUTS / RÉSULTATS DE RECHERCHE
Author(s) - Auteur(s) :
Publication date - Date de publication :
Permanent link - Permalien :
Rights / License - Licence de droit d’auteur :
Bibliothèque Universitaire Moretus Plantin
Institutional Repository - Research Portal
Dépôt Institutionnel - Portail de la Recherche
researchportal.unamur.be
University of Namur
XPS, FTIR, EDX, and XRD analysis of Al2O3 scales grown on PM2000 alloy
Djebaili, K.; Mekhalif, Z.; Boumaza, A.; Djelloul, A.
Published in: Journal of Spectroscopy DOI: 10.1155/2015/868109 Publication date: 2015 Document Version
Publisher's PDF, also known as Version of record
Link to publication
Citation for pulished version (HARVARD):
Djebaili, K, Mekhalif, Z, Boumaza, A & Djelloul, A 2015, 'XPS, FTIR, EDX, and XRD analysis of Al2O3 scales grown on PM2000 alloy', Journal of Spectroscopy, vol. 2015, 868109. https://doi.org/10.1155/2015/868109
General rights
Copyright and moral rights for the publications made accessible in the public portal are retained by the authors and/or other copyright owners and it is a condition of accessing publications that users recognise and abide by the legal requirements associated with these rights. • Users may download and print one copy of any publication from the public portal for the purpose of private study or research. • You may not further distribute the material or use it for any profit-making activity or commercial gain
• You may freely distribute the URL identifying the publication in the public portal ?
Take down policy
If you believe that this document breaches copyright please contact us providing details, and we will remove access to the work immediately and investigate your claim.
Research Article
XPS, FTIR, EDX, and XRD Analysis of Al
2
O
3
Scales
Grown on PM2000 Alloy
K. Djebaili,
1Z. Mekhalif,
2A. Boumaza,
1and A. Djelloul
11Structures, Properties and InterAtomic Interactions Laboratory (LASPI2A), Faculty of Science and Technology,
University of Abb`es Laghrour, 40000 Khenchela, Algeria
2Chemistry and Electrochemistry Surfaces Laboratory (LCES), Notre-Dame de la Paix Faculty, Road of Bruxelles 61,
5000 Namur, Belgium
Correspondence should be addressed to A. Boumaza; charif [email protected] Received 18 January 2015; Revised 20 February 2015; Accepted 25 February 2015 Academic Editor: Djordje Mandrino
Copyright © 2015 K. Djebaili et al. This is an open access article distributed under the Creative Commons Attribution License, which permits unrestricted use, distribution, and reproduction in any medium, provided the original work is properly cited. This work is an original example to compare the results obtained after calcination of Al2O3hydroxides and oxidation of alumino-formers alloys. FTIR and XPS signatures were obtained for various oxidation temperatures and compared with those known from the literature about calcination of Al2O3precursors. The aim of this work is to evaluate the use of IR spectroscopy and XPS analysis to probe the structural varieties of Al2O3. For this objective, a study of the PM2000 oxidation at various temperatures was conducted by means of XRD, IR spectroscopy, XPS analysis, EDX analysis, and SEM observations. This allowed us to clearly differentiate the transition Al2O3from the𝛼-Al2O3and, amongst the transition Al2O3, to differentiate the characteristic of the IR spectrum of𝛾-𝛿 phases from that of the𝜃 phase.
1. Introduction
Most of the metallic materials functioning at high temper-ature need to have oxidation resistance. This resistance can be achieved when the chosen materials develop through oxidation, an oxide film which acts as a diffusion barrier while keeping a good adherence. Several studies have shown that the oxide layers as SiO2, Cr2O3, and𝛼-Al2O3 provide a satisfactory protective role, a protection based on the formation of a layer of𝛼-Al2O3. Al2O3is the most powerful principle. In this prospect,𝛼-Al2O3is a very good candidate. Before reaching the most stable Al2O3[1], alumino-former materials developed transition Al2O3 among which the most common are 𝛾, 𝛿, and/or 𝜃 phases. Nowadays, it is not clear whether the growth of transition Al2O3 as a first step improves the protective properties of the further formed 𝛼-Al2O3 film. Moreover, one difficulty associated with the understanding of the influence of transition Al2O3 on the further oxidation resistance concerns the fact that, as mentioned in [2], the techniques which allow us to detect and characterize transition Al2O3formed as thin layers (1 to 3𝜇m) are scarce and provide ambiguous answers. Indeed, the most common technique, the XRD, provides patterns for various
Al2O3 which are relatively close to each other. Moreover, it seems that, in many cases, several transition phases can be simultaneously present [3]. In previous studies, transmission electron microscopy (TEM) was used to probe the oxidation of either an intermetallic alloy, Fe3Al, or an ODS (oxide dispersion strengthening) FeCrAl alloy strengthened by very small Y2O3 particles, PM2000 [4–7]. The formation of transition Al2O3 for various heat treatment conditions was evidenced and the transition to the 𝛼-Al2O3 was studied. The formed oxide scales were characterized using analysis techniques such as scanning electron microscope (SEM), energy-dispersive X-ray spectroscopy (EDX), X-ray diffrac-tion (XRD), Fourier transform infrared spectroscopy (FTIR), and X-ray photoelectron spectroscopy (XPS). The present study aims at examining whether FTIR and XPS analysis may provide a simple probe to various structural varieties of Al2O3 for applications of high temperature materials.
2. Experimental Techniques
2.1. Samples and Treatments. The Fe-based alloy PM2000
strengthened by oxide dispersion (ODS) received from
Volume 2015, Article ID 868109, 16 pages http://dx.doi.org/10.1155/2015/868109
0.00 1.00 2.00 3.00 4.00 5.00 6.00 7.00 8.00 9.00 10.00 (keV) 0 2000 4000 6000 8000 10000 12000 14000 16000 18000 20000 22000 Co u n ts CK a OKa AlK a Si K a CrL l CrL a CrK a CrKb Mn L l Mn L a Mn Ka M nKb Fe L l Fe L a Fe Ke sc Fe K a F eKb YL l YL a Zr L l Zr La
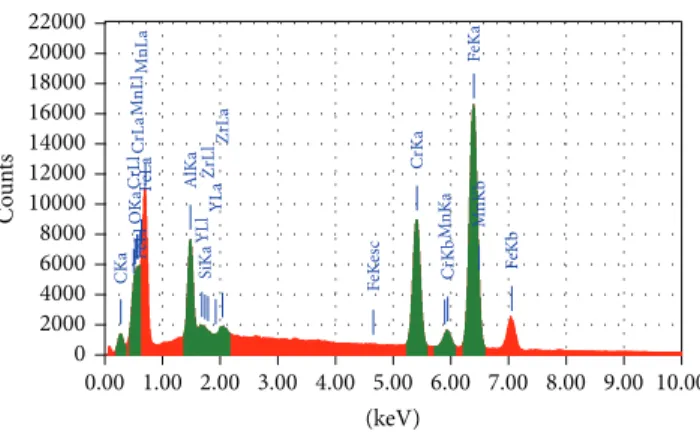
Figure 1: EDX analysis of the as-received PM2000.
Schwarzkopf Plansee was used; the chemical composition in weight percent is as follows: A1-5.0, Cr-22.0, Mn-0.2, C-0.02, Si-0.3, Y-0.1, Zr-0.1, and Fe-balance. Rectangular specimens of dimensions 1× 1 cm2and 1× 2 cm2and thickness of1.0 ± 0.1 mm were sectioned. The oxidation of PM2000 alloy as a heat resistant material for high temperature applications was studied in air at 873, 973, 1073, 1173, 1273, 1373, and 1473 K according to the following heat treatment:
(i) heating it up to the specified temperature at 20 K/min; (ii) maintaining it for 7 h at the oxidation temperature; (iii) cooling it down rapidly to room temperature (air
quench).
2.2. Characterization of Samples. All the samples were then
characterized using XRD, SEM observations, EDX qualitative analysis, FTIR spectroscopy, and XPS spectroscopy.
(i) XRD analysis was performed with a PANalytical X’Pert ProMRD diffractometer with CuKa radiation (𝜆 = 0.15418 nm). Data were collected with steps of 0.021∘(2𝜃).
(ii) SEM images were taken on a field emission scan-ning microscope (JEOL 7500-F). The SEM used for the characterization is equipped by Genesis EDX spectroscopy system that was used to measure the composition of the elements constituting the films. (iii) FTIR spectra were obtained using a Perkin-Elmer
spectrometer at a resolution of 8 cm−1. FTIR tech-nique was used in the transmission mode in the 400–4000 cm−1 range. For each sample, 120 scans were used. After oxidation,∼100 𝜇g of the oxides was scraped. The oxide was then compressed together with23±2 mg of KBr in a cold 150 MPa isostatic press (CIP) in order to obtain a 200–250𝜇m thick pellet. All IR spectra are reporting absorbance(𝐴 = − log(𝐼/𝐼0)) as a function of the incident wavenumbers.
(iv) An XPS spectrometer was used to qualitatively and quantitatively verify the composition of the different powder compounds. The spectra were treated using
the Thermo Advantage V5.27 software. The photo-electrons are excited using a monochromatic Al-K𝛼 radiation as the excitation source, collected at𝜃 = 0∘ with respect to the surface normal and detected with a hemispherical analyzer. The spot size of the XPS source on the sample is 200𝜇m, and the analyzer is operated with a pass energy of 150 eV for the survey spectra and 20 eV for the accumulation spectra of the core levels. The pressure is maintained below 10−8 Torr during data collection, and the binding energies (Eb) of the obtained peaks are referenced to the C1s signal for C–H, which is set to 285.0 eV. XPS measurements are made with an uncertainty of about 0.1 eV to 0.2 eV.
2.3. SEM and EDX Analysis. For each tested temperature,
oxidized specimens, contained in crucibles, were cooled to room temperature. For studies of scale morphology, compo-sition, and crystal structure, EDX analysis was used.Figure 1
shows EDX analysis of the as-received PM2000, and the presence of the elements Fe, Cr, Al, Y, Zr, Si, Mn, and C is detected.
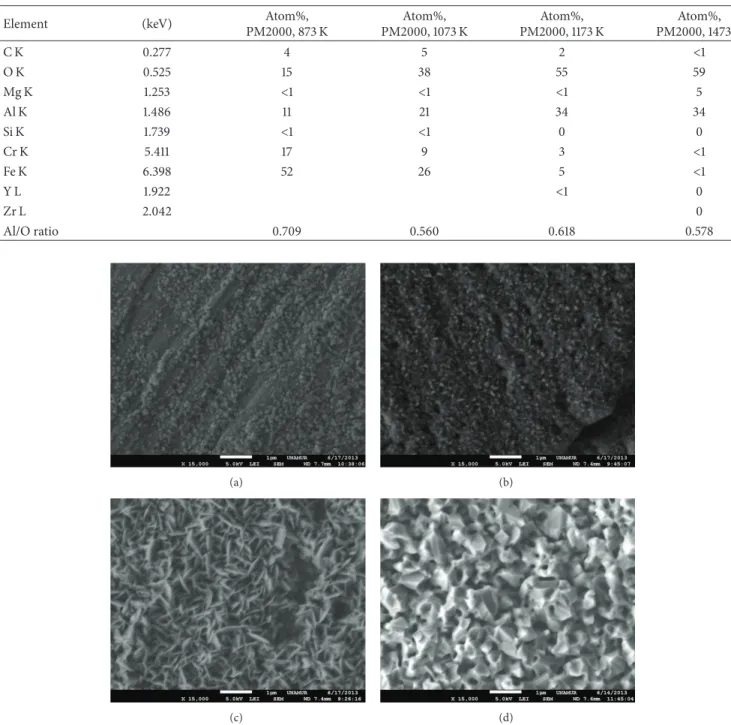
Significant differences in the scale morphology were observed by SEM, depending on the oxidation temperature. Both materials developed Al2O3 scales. Figure 2(a) shows nodules form during the early stages of oxidation; they consist of oxides enriched by Al, Fe, Cr, Si, or Mg. Fe/Cr oxides were detected for temperatures between 873 and 1073 K, and cracks and porosities are observed at 1073 K, as shown in
Figure 2(b). Our observations are consistent with those in the literature [8–10]. In addition to𝛼-Al2O3(detected by XRD),
Figure 2(c)shows metastable Al2O3which is clearly observed at 1173 K, the so-called “platelet-like” oxide, and recognized to propagate by an outward Al anion diffusion in contrary to𝛼-Al2O3scale. The presence of this type of particles was correlated with the XRD analysis and they were assumed to be𝜃-Al2O3. It is well established [11,12] that the growth rate of the metastable Al2O3is of factor two to four times higher than the stable Al2O3, leading to faster Al consumption and as a result substantial decreasing of component’s lifetime. The external surface of metastable oxide is very different from the equiaxed dense𝛼-Al2O3grains.
Table 1: Composition and stoichiometry of the thin films obtained by statistical analysis of EDX spectrum.
Element (keV) Atom%,
PM2000, 873 K Atom%, PM2000, 1073 K Atom%, PM2000, 1173 K Atom%, PM2000, 1473 K C K 0.277 4 5 2 <1 O K 0.525 15 38 55 59 Mg K 1.253 <1 <1 <1 5 Al K 1.486 11 21 34 34 Si K 1.739 <1 <1 0 0 Cr K 5.411 17 9 3 <1 Fe K 6.398 52 26 5 <1 Y L 1.922 <1 0 Zr L 2.042 0 Al/O ratio 0.709 0.560 0.618 0.578 (a) (b) (c) (d)
Figure 2: Typical morphology of the surface scales of PM2000 after 7 h exposure at 873 K (a), 1073 K (b), 1173 K (c), and 1473 K (d).
Concerning the morphology of the oxide obtained at 1473 K, which can be seen inFigure 2(d), the formation of a bulk porous microstructure is observable, with a quite different microstructure in comparison with the a, b, c spec-imens. The Al2O3(equiaxed grains) microstructure colonies develop into vermicular morphology containing larger scale interconnected porosity.
Data are analyzed in order to reveal the calcination effectiveness and to check the stoichiometry of the as-prepared oxide films; the results are reported inTable 1.
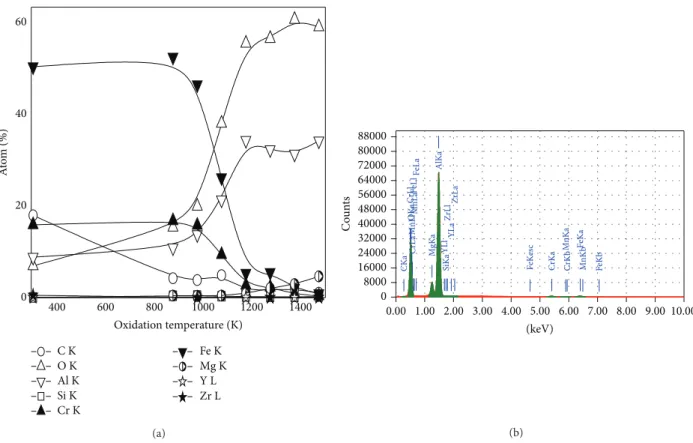
Figure 3(a)shows the EDX analysis samples of PM2000 (as-received and oxidized). The analyzed oxide layers are rich in Fe, Cr, and Al in the interval of temperatures between 873 K and 1073 K. For temperatures above 1173 K, Al2O3 becomes predominant. An example of EDX spectra of oxidized PM2000 at 1473 K is shown in Figure 3(b). As shown in Figure 3(b), the presence of Mg appears more important as the temperature increases in the𝛼-Al2O3layer. Its dissemination to the external interface is favored by higher temperatures [13].
400 600 800 1000 1200 1400 0 20 40 60 A to m (%) Oxidation temperature (K) C K O K Al K Si K Cr K Fe K Mg K Y L Zr L (a) 0.00 1.00 2.00 3.00 4.00 5.00 6.00 7.00 8.00 9.00 10.00 (keV) 0 8000 16000 24000 32000 40000 48000 56000 64000 72000 80000 88000 Co u n ts CK a OKa MgK a AlK a Si K a CrL l CrL a CrK a CrKb Mn L l Mn L a Mn Ka M nKb Fe L lFe L a Fe Ke sc Fe K a F eKb YL l YL a Zr L l Zr La (b)
Figure 3: EDX analysis samples of as-received PM2000 and oxidized PM2000 (a) and example of EDX spectra of oxidized PM2000 at 1473 K used for composition calculation (b) (seeTable 1).
2.4. XRD Results. PM2000 is iron-based (Fe-Cr-Al) with a
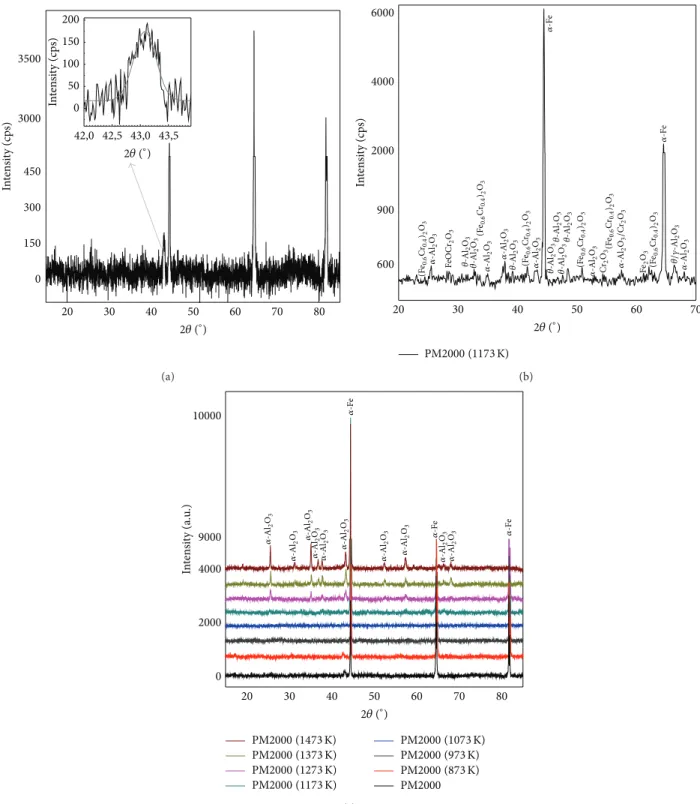
ferritic matrix (𝛼-Fe) as shown inFigure 4(a)and is mechan-ically alloyed with Y2O3 and ZrO2 dispersion material. Before oxidation, at room temperature, native oxide, thin film exists on the alloy surface, with only several nanometers in thickness, and it consists of all the alloying elements as mentioned in literature [14]. This native oxides is Al2O3and a mixture of oxides as Fe, and Cr. The oxide formation at elevated temperatures can be separated in three steps. First, at relatively low temperatures (873, 973, and 1073 K), a mixed oxide similar to the preexisting native oxide forms, the XRD does not allow the revelation of these oxides (they are revealed by SEM observations and detected by FTIR, EDX, and XPS analysis). Second, at 1173 K, the XRD pattern obtained reveals, inFigure 4(b), the presence of theFe, 𝛼-Al2O3, transition Al2O3, and different phases of oxides: Fe2O3 or (Fe0.6Cr0.4)2O3 or Cr2O3. Third, at higher temperature greater than 1373 K, the main existing oxide is 𝛼-Al2O3 (Figure 4(c)).
Information on the crystallite size (𝐷) for the compounds (i.e., 𝛼-Al2O3) was obtained from the full width at half maximum of the diffraction peaks using the Scherrer formula [15]:
𝐷 = 0.94𝜆
𝛽 (ℎ𝑘𝑙) cos 𝜃 (ℎ𝑘𝑙), (1) where 𝜆, 𝜃(ℎ𝑘𝑙), and 𝛽(ℎ𝑘𝑙) are the X-ray wavelength (0.15418 nm), Bragg diffraction angle, and line width at half
Table 2: Crystallite sizes versus oxidation temperature. Oxidation temperature 1273 K 1373 K 1473 K Crystallite size𝐷 (nm) 36± 8 40± 8 44± 8
maximum, respectively. The values of the𝛽(ℎ𝑘𝑙) and 𝜃(ℎ𝑘𝑙) parameters from the XRD peak are estimated by Gaussian fitting. This formula is not limited by the preferential orienta-tion and is valid for an ordinary XRD profile. To improve the statistics, the most intense peaks in the profiles were chosen to determine the crystallite size. The results are reported in
Table 2.
2.5. FTIR Characterizations of the Transition Al2O3 on
Oxidized PM2000 Alloys. The FTIR spectral signatures of
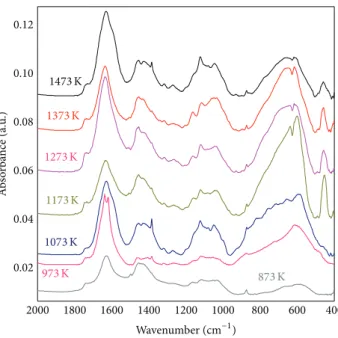
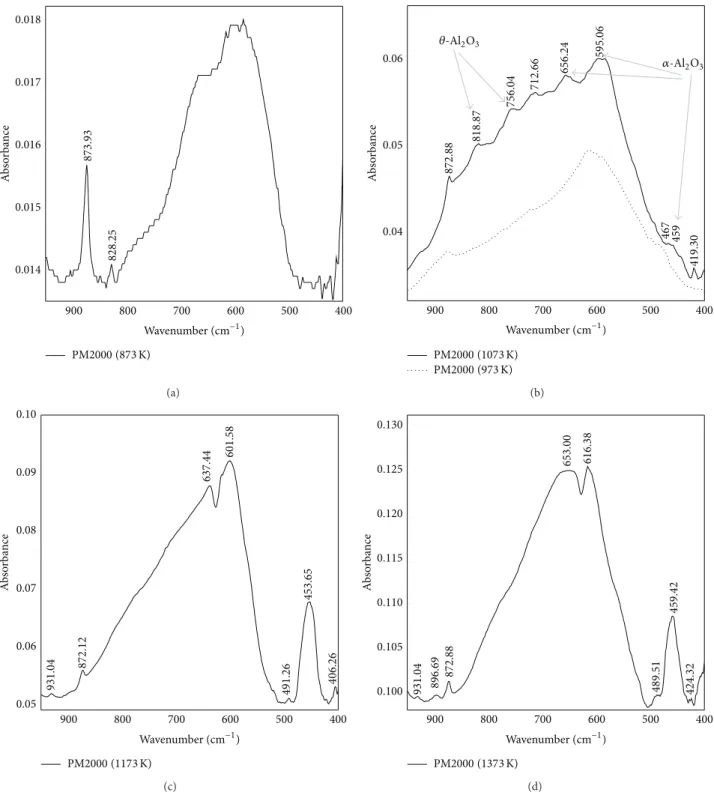
both𝛼-Al2O3 and metastable forms have been thoroughly addressed in the literature using both experimental and theoretical simulations [16–19]. It is now possible to detect the presence of transition Al2O3and perhaps their nature on oxide scales formed by oxidation of alumino-former alloys. For this purpose, PM2000 samples (PM2000, ODS alloy), oxidized at different temperatures (from 873 K to 1473 K in air for 7 hours) were studied by IR spectroscopy. FTIR spectra are reported inFigure 5. The spectrum (Figure 6(a)) at 873 K in the range 400–1000 cm−1represents a poorly crystallized structure characterized by a broadband with no apparent thin peak. This signature is that of the𝛾-Al2O3 (the broad
20 30 40 50 60 70 80 0 150 300 450 3000 3500 42,0 42,5 43,0 43,5 0 50 100 150 200 In te n si ty (c ps) In te n si ty (c ps) 2𝜃 (∘) 2𝜃 (∘) (a) 20 30 40 50 60 70 600 900 2000 4000 6000 In te n si ty (c ps) 2𝜃 (∘) PM2000 (1173 K) (Fe0.6 Cr 0.4 )2 O3 (Fe 0.6 Cr 0.4 )2 O3 (Fe 0.6 Cr0.4 )2 O3 (Fe 0.6 Cr0.4 )2 O3 (Fe 0.6 Cr0.4 )2 O3 (Fe 0.6 Cr 0.4 )2 O3 𝛼 -Al 2 O3 𝛼 -Al 2 O3 𝛼 -Al 2 O3 𝛼 -Al 2 O3 𝛼 -Al 2 O3 𝛼 -Al 2 O3 Fe O C r2 O3 𝜃-Al 2 O3 𝜃-Al 2 O3 𝜃-Al 2 O3 𝜃-Al 2 O3 𝜃-Al 2 O3 𝜃-Al 2 O3 𝜃-Al 2 O3 Cr2 O3 𝛼 -Al 2 O3 /Cr 2 O3 Fe2 O3 𝜃/𝛾-Al 2 O3 𝛼 -F e 𝛼 -F e (b) 20 30 40 50 60 70 80 0 2000 4000 9000 10000 In te n si ty (a.u .) 2𝜃 (∘) PM2000 (1473 K) PM2000 (1373 K) PM2000 (1273 K) PM2000 (1173 K) PM2000 (1073 K) PM2000 (973 K) PM2000 (873 K) PM2000 𝛼 -Al 2 O3 𝛼 -Al 2 O3 𝛼 -Al 2 O3 𝛼 -Al 2 O3 𝛼 -Al 2 O3 𝛼 -Al 2 O3 𝛼 -Al 2 O3 𝛼 -Al 2 O3 𝛼 -Al 2 O3 𝛼 -Al 2 O3 𝛼 -F e 𝛼 -F e 𝛼 -F e (c)
Figure 4: XRD powder patterns of as-received PM2000 (a), heat treated on air at 1173 K (b), and heat treated on air from 873 to 1473 K (c).
extending band in the range 400–700 cm−1 indicates the existence of amorphous structure or disordered defects). The FTIR spectrum obtained after oxidation in air for 7 h of a PM2000 sample at 1073 K (Figure 6(b)) differs from the previous one. Peaks appear, indicating the presence of a better crystallized phase; the presence of𝛼-Al2O3 is also detected in this spectrum. The main peaks at 459, 595, and 656 cm−1
can be assigned to the Al–O stretching mode in octahedral structure; bands around 715 cm−1and 1072 cm−1are related to Al–O stretching mode in tetrahedron and symmetric bend-ing of Al–O–H, respectively. The broad absorbance bands between 900 and 1100 cm−1are assigned to O–H deformation vibrations. Thus, the transformation from the amorphous state to𝛼-Al2O3can be identified from the appearance of 720
2000 1800 1600 1400 1200 1000 800 600 400 0.02 0.04 0.06 0.08 0.10 0.12 A b so rba n ce (a.u .) 1473 K 1373 K 1273 K 1173 K 1073 K 973 K 873 K Wavenumber (cm−1)
Figure 5: FTIR spectra of oxidized PM2000 at various temperatures from 873 K to 1473 K.
and 1072 cm−1 bands, due to the differences in the sites of Al cations and the distribution of H in these oxides [20–22]. The presence of Fe oxides or Fe-Al oxide mixtures can make this spectrum more complex. The outer surface of the Al2O3 scale formed on PM2000 after 7 h oxidation at 1073 K in air was observed by SEM (Figure 2). The Al2O3 morphology is a characteristic of transition Al2O3. However, we cannot say whether it is𝛿 or 𝜃 (or even mixtures) that are present at this temperature. The spectra (Figures 6(c) and 6(d)) of the oxidized alloys 1173, 1273, 1373, and 1473 K indicate clearly the presence of𝛼-Al2O3. Thus, the IR spectroscopy in the range 400–1000 cm−1 can be used as a fast and easy tool to distinguish the presence of transition Al2O3 phases on oxidized high temperature materials and to determine whether𝛾, 𝛿, or 𝜃-Al2O3are present. The𝛼-Al2O3is clearly identified by its spectra shown in Figures6(c)and6(d). This allowed to clearly differentiate the transition Al2O3from the 𝛼-Al2O3and, amongst the transition Al2O3, to differentiate the characteristic IR spectrum of𝛾-𝛿 phases from that of the 𝜃 phase [20,21]. Peak observed at∼873 cm−1is due to out-of-plane bending vibration (𝜐4–CO32−) of carbonate.
2.6. XPS Results. XPS is sensitive to the chemical
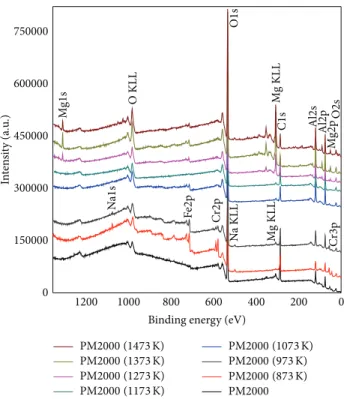
compo-sition and the local environment of atoms in the crystal structure, which is reflected by the changes in the binding energy and the occurrence of multiple bands associated with different chemical environments. In the literature, the XPS analyses of Al, Fe, Cr, Mg, and Si oxides were performed and interpreted for the O1s, Al2p, Fe2p, Cr2p, Mg1s, Si1s, and C1s. XPS bands data were compared with the values reported in the literature [23–29]. XPS spectra of native oxides Fe-Cr oxides, transition Al2O3, and𝛼-Al2O3have been studied by spectral characterization of each sample (the as-received PM2000, and after oxidation from 873 to 1473 K).Figure 7
shows the XPS survey spectra and the spectrum of each
sample reveals the peaks for O1s, Al2p, Fe2p, Cr2p, Mg1s, Si2p, and C1s, which indicates the presence of O, Al, Fe, Cr, Mg, Si, and C.
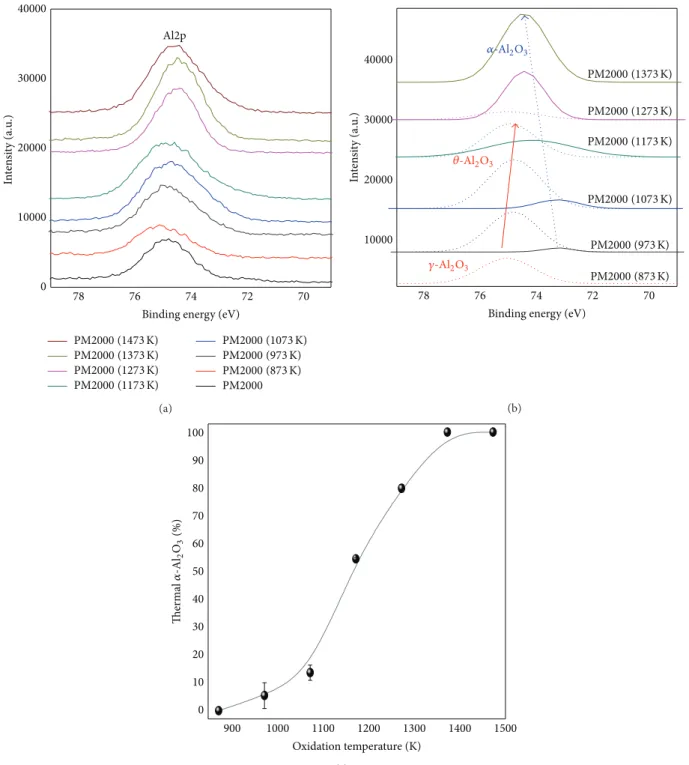
The XPS Al2p spectra for treated and as-received PM2000 are shown in Figures8(a) and8(b) and Figures9(a),9(b), and9(c). The Al2p spectra are shifted 1 eV to higher binding energy (𝐸𝑏) in the order𝛼-Al2O3 < 𝜃-Al2O3 < 𝛾-Al2O3. A double band is observed for the as-received PM2000; the first is located at 74.83 eV (FWHM 1.90 eV) corresponding to Al-O state and the second is located at 72.30 eV (FWHM 3.36 eV) corresponding to Al-M state. The Al2p band of oxidized alloy at 873 K (Figure 8(a)) shows a single peak located at 75.06 eV (FWMH 2.22 eV), which corresponds to the𝛾-Al2O3 form (as analyzed by FTIR spectroscopy). At 1273 K, the peak at 74.25 eV (FWMH: 1.67 eV) is affected to 𝛼-Al2O3 and the peak at 74.82 eV (FWMH 2.56 eV) is affected to 𝜃-Al2O3 (Figure 8(b)). The results obtained for the valence Al2p for these alloys show that the variations in binding energies are within an interval of about 1 eV; these are in good agreement with previous observations [23,26,27]. The evolution of 𝛼-Al2O3 Al2p peaks is represented in Figures 9(a)and 9(b), for temperature increasing from 873 to 1473 K. At 1373 K, the 𝛼-Al2O3 peak is symmetrical and the BE position is given at 74.45 eV (FWHM 1.97 eV). The XPS decomposition peaks (Figure 9(b)) related to the energies Al2p bands are used to estimate the evolution percentage of the thermal 𝛼-Al2O3 phase between 873 and 1473 K (Figure 9(c)). This trend can be divided into three parts. First, at temperatures between 873 and 1073 K, the percentage is low and does not exceed 15%; this part corresponds to the𝛾-Al2O3 and the (Fe, Cr) oxides formation. The second portion is between 1073 and 1173/1273 K; the percentage of Al is growing rapidly and has a high slope, which means a significant growth of thermal 𝛼-Al2O3 and𝜃-Al2O3 in this field. Finally, in a step between 1173/1273 and 1473 K,𝛼-Al2O3takes place.
900 800 700 600 500 400 0.014 0.015 0.016 0.017 0.018 828.25 873.93 Ab so rb an ce Wavenumber (cm−1) PM2000 (873 K) (a) 900 800 700 600 500 400 0.04 0.05 0.06 459 467 595.06 656.24 712.66 756.04 818.87 872.88 419.30 Ab so rb an ce 𝛼-Al2O3 𝜃-Al2O3 PM2000 (1073 K) PM2000 (973 K) Wavenumber (cm−1) (b) 900 800 700 600 500 400 0.05 0.06 0.07 0.08 0.09 0.10 931.04 491.26 406.26 453.65 601.58 637.44 872.12 Ab so rb an ce Wavenumber (cm−1) PM2000 (1173 K) (c) 0.100 0.105 0.110 0.115 0.120 0.125 0.130 424.32 931.04 896.69 872.88 489.51 459.42 653.00 616.38 Ab so rb an ce 900 800 700 600 500 400 Wavenumber (cm−1) PM2000 (1373 K) (d)
Figure 6: FTIR spectra of oxidized PM2000 at 873 K (a), 973 K and 1073 K (b), 1173 K (c), and 1373 K (d).
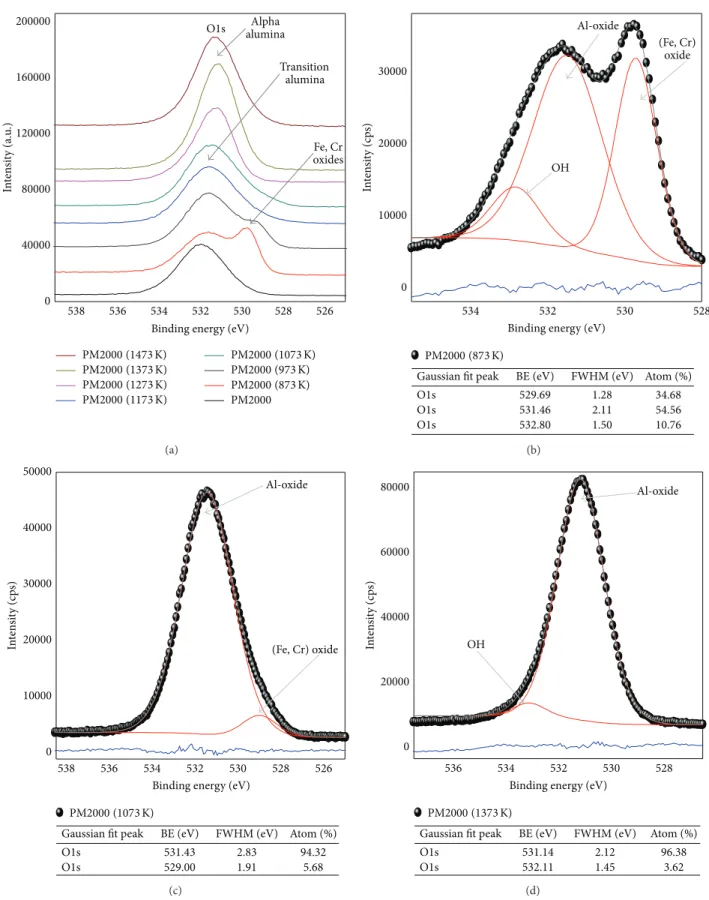
The O1s peaks are less symmetrical (relative to Al2p peaks), more complex, and more sensitive to the different states of the minerals. In fact, the O1s band is very important due to its intensity, which allows it to be more sensitive and hence more exploitable, according to the literature [23–
26]. This band can be decomposed into multiple parts: the O1s band corresponding to (Fe, Cr) oxides is located at ∼529 eV, the O1s band corresponding to Al2O3 oxides is
located at∼531 eV, the O1s band corresponding to the OH groups is located at∼532 eV, and the O1s band indicating the presence of amorphous mixtures containing H2O is located at∼533.5 eV.
Figure 10(a) represents O1s peaks of as-received and treated PM2000. We note that these peaks exhibit significant differences depending on the compound state. In the as-received PM2000, the energy of O1s is shifted to 531.84 eV
1200 1000 800 600 400 200 0 0 150000 300000 450000 600000 750000 Mg KLL Mg2p Cr3p N a KLL N a1s Mg KLL Cr2p F e2p Mg1s O2s O KLL O1s C1s Al2s Al2p In te n si ty (a.u .)
Binding energy (eV)
PM2000 (1473 K) PM2000 (1373 K) PM2000 (1273 K) PM2000 (1173 K) PM2000 (1073 K) PM2000 (973 K) PM2000 (873 K) PM2000
Figure 7: XPS survey spectra of as-received and oxidized PM2000.
78 76 74 72 70 3000 4000 5000 6000 7000 8000 9000 Atom (%) 75.06 In te n si ty (c ps)
Binding energy (eV)
PM2000 (873 K)
𝛾-Al2O3
Gaussian fit peak BE (eV) FWHM (eV)
Al2p 2.22 100 (a) 79 78 77 76 75 74 73 72 71 0 70 2000 4000 6000 8000 10000 In te n si ty (c ps)
Binding energy (eV)
Atom (%) 74.25
Gaussian fit peak BE (eV) FWHM (eV)
Al2p Al2p 79.86 1.68 74.82 2.56 20.14 𝛼-Al2O3 𝜃-Al2O3 PM2000 (1273 K) (b)
78 76 74 72 70 0 10000 20000 30000 40000 Al2p In te n si ty (a.u .)
Binding energy (eV)
PM2000 (1473 K) PM2000 (1373 K) PM2000 (1273 K) PM2000 (1173 K) PM2000 (1073 K) PM2000 (973 K) PM2000 (873 K) PM2000 (a) 78 76 74 72 70 10000 20000 30000 40000 In te n si ty (a.u .)
Binding energy (eV)
𝛾-Al2O3 𝛼-Al2O3 𝜃-Al2O3 PM2000 (1373 K) PM2000 (1273 K) PM2000 (1173 K) PM2000 (1073 K) PM2000 (973 K) PM2000 (873 K) (b) 900 1000 1100 1200 1300 1400 1500 0 10 20 30 40 50 60 70 80 90 100 Oxidation temperature (K) Ther m al 𝛼 -Al 2 O3 (%) (c)
Figure 9: Al2p XPS spectra of the treated and as-received PM2000 (a) and Al2p XPS decomposed spectra of PM2000 (b) evolution percentage of the thermal𝛼-Al2O3phase between 873 and 1473 K (c).
(FWHM 2.54 eV), the surface of the material contains a few thin native oxide. These native oxides are mainly composed of Al, Fe, and Cr. The O1s core level photoemission spectra for PM2000 (873) and PM2000 (973) confirm the presence of, at least, two oxides and eventually hydroxides. At 873 K (Figure 10(b)), when decomposed, the peak at 529.69 eV (FWHM 1.28 eV) indicates the presence of the Fe, Cr oxides [28, 29], the peak at 531.67 eV (FWHM 2.11 eV) indicates
the presence of the transition Al2O3 oxides (the 𝛾-Al2O3 form), and the O1s band indicating the presence hydroxyls is located at 532.80 eV (FWHM 1.50 eV). The peak at 1073 K (Figure 10(c)), when decomposed, indicates the presence of the transition Al2O3 located at 531.43 eV (FWHM 2.83 eV) with the percentage of ∼94.3%, and the peak at 529 eV (FWHM 1.91 eV) indicates the presence of (Fe, Cr) oxide with the percentage of ∼5.7%. For PM2000 (1373) shown
538 536 534 532 530 528 526 0 40000 80000 120000 160000 200000
O1s aluminaAlpha
Transition alumina Fe, Cr oxides In te n si ty (a.u .)
Binding energy (eV)
PM2000 (1473 K) PM2000 (1373 K) PM2000 (1273 K) PM2000 (1173 K) PM2000 (1073 K) PM2000 (973 K) PM2000 (873 K) PM2000 (a) 534 532 530 528 0 10000 20000 30000 OH Al-oxide In te n si ty (c ps) (Fe, Cr) oxide
Binding energy (eV)
Atom (%) 529.69
Gaussian fit peak BE (eV) FWHM (eV)
O1s O1s 34.68 1.28 531.46 2.11 54.56 O1s 532.80 1.50 10.76 PM2000 (873 K) (b) 538 536 534 532 530 528 526 0 10000 20000 30000 40000 50000 Al-oxide (Fe, Cr) oxide In te n si ty (c ps)
Binding energy (eV)
Atom (%) 531.43
Gaussian fit peak BE (eV) FWHM (eV)
O1s O1s 94.32 2.83 529.00 1.91 5.68 PM2000 (1073 K) (c) 536 534 532 530 528 0 20000 40000 60000 80000 OH Al-oxide In te n si ty (c ps)
Binding energy (eV)
Atom (%) 531.14
Gaussian fit peak BE (eV) FWHM (eV)
O1s O1s 96.38 2.12 532.11 1.45 3.62 PM2000 (1373 K) (d)
Figure 10: XPS spectra in the O1s region for as-received and treated PM2000 at various temperatures (a), decomposed O1s peaks of oxidized PM2000 at 873 K (b), decomposed O1s peaks of oxidized PM2000 at 1073 K (c), and decomposed O1s peaks of oxidized PM2000 at 1373 K (d).
in Figure 10(d), the wide peak at 531.14 (FWHM 2.12 eV) indicates the presence of the 𝛼-Al2O3 with the percentage of∼96%, and a small peak at 532.11 eV (1.45 eV) due to the presence of the OH groups.
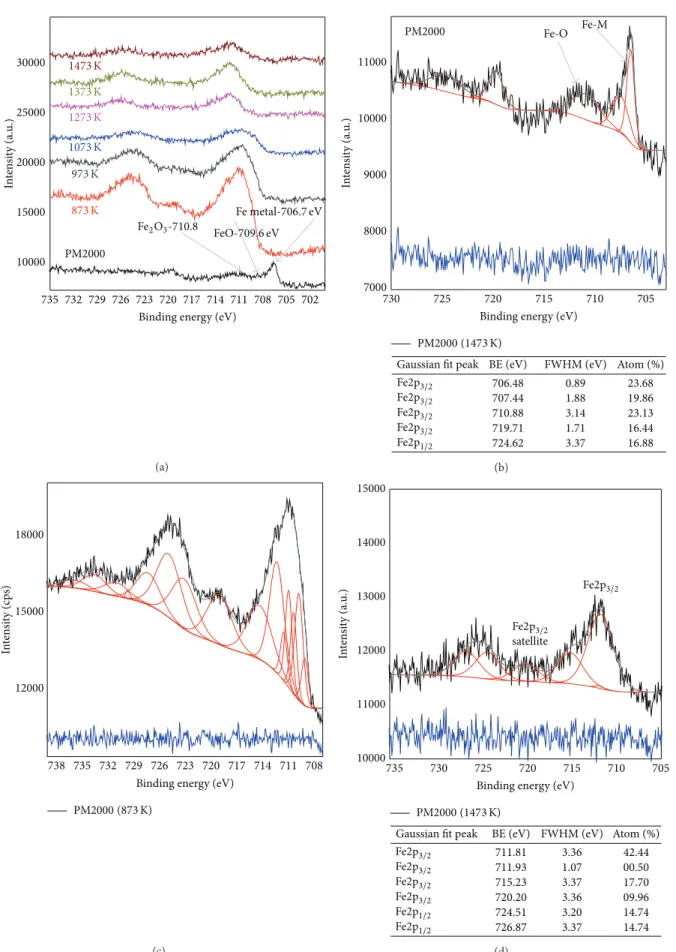
The Fe oxidation state of the oxides formed at various temperatures oxidations can be derived from the Fe2p spectra in Figure 11. Fe2p3/2 and Fe2p1/2 main line peak positions are 710.5 and 724.0 eV, respectively, which is in excellent agreement with the literature values for the mixed Fe2O3 -(maghemite-) Fe3O4 (magnetite) surface [30–32]. In addi-tion, the occurrence and intensity of the so-called Fe2p3/2 charge-transfer satellites, which appear additionally to the Fe2p3/2 main line, indicate the oxidation state of different Fe oxides. In the case of Fe2O3, the Fe3+ charge-transfer satellite should occur at 719 eV, while for divalent FeO, the Fe2+satellite appears at 715.5 eV. For the mixed valence state of Fe3O4 (Fe3+: Fe2+ = 2 : 1), both satellites add up in such a way that the spectral region between the 2p3/2and 2p1/2 main lines becomes smooth and less structured [28–33]. In all samples, Fe2p peaks have asymmetric shape. In the spectrum of the as-received PM2000, the peaks corresponding to metallic Fe are specified at 706.93 eV and 707.89 eV, satellite is given at 720.16 eV, and the Fe2p3/2peak of native oxides is located at 711.33 eV. When oxidized at 873 K and 973 K, the spectra corresponding to the Fe2p3/2and Fe2p1/2bands are rather wider; peaks shifted at∼711 eV and 724 eV, respectively. The satellite at 719.22 eV is well defined. At 1200∘C, the peaks Fe2p3/2and Fe2p1/2 are given to the binding energies near ∼714 eV and ∼725 eV. The decomposition of the spectrum between 716 and 725 eV can give satellites at 720 eV; these peaks indicate the presence of𝛼-Fe2O3.
The Cr oxidation state of the oxides formed at various temperatures oxidations can be derived from the Cr2p spectra inFigure 12, and the peaks observed at 577 eV and 586.5 eV indicate Cr2p3/2electrons and Cr2O3 presence in the formed oxide. A satellite of the Cr2p3/2 peak overlaps the Cr2p1/2component in Cr2O3. The peaks at 577.6 eV and 586.38 suggest Cr2p3/2 and Cr2p1/2 core electrons, respec-tively. The Cr2p3/2and 2p1/2main line peak positions are in the range 775–582 eV and 582–590 eV, respectively, being in excellent agreement with literature values [34,35]. In all sam-ples, Cr2p peaks have asymmetric shape. In the spectrum of the as-received PM2000, the peaks corresponding to metallic Cr at 574.39 eV and 575.02 eV are identified. A Cr2p3/2peak of native oxides is located in the range 576–579 eV. When oxidizing at 873 K and 973 K, the spectra corresponding to the Cr2p3/2and Cr2p1/2bands are significant and located in the range 576–580 eV and 584–590 eV, respectively (Figures
12(a)and12(b)). The existence of Cr2O3was IR from a peak at 579.60 eV. For the oxidations at temperatures above 1073 K, these bands become negligible.
The SiO2 and SiC are found by XPS peak (Si2p bands) positions 99.4 eV, 103.5 eV, and 100.3 eV, respectively. Peaks obtained are 100.87 eV and 97.75 eV (Figure 13), which reveals the presence of SiC and eventually Si. This compound is quite stable, since the alloy receiver (native oxide) and the amount do not change during oxidation. The addition of small quantities of colloidal SiO2 to a commercial Al2O3 powder
has a significant effect on its densification and microstructure evolution [36,37]. SiO2has a detrimental effect on the Al2O3 densification behavior particularly during the intermediate stage of sintering (from 1473 to 1673 K).
As mentioned above, the presence of Mg appears more important as the temperature increases. Its dissemination to the external interface is favored by higher tempera-tures as shown inFigure 14. Mg doping𝛼-Al2O3 improved densification and elimination of residual porosity [38]. Works demonstrate that Mg additions uniformly distributed over a nanometer-sized Al2O3 powder have no effect on the𝛾 to 𝛿 phase transition, raise the densification rate in the rapid-sintering stage, and increase the net shrinkage [39].
2.7. Adventitious C (Carbon). The decomposition of the C1s
signal in the domain (oxidation PM2000 at 873–1473 K) results in too bands (Figures15(a)and 15(b)). The peak at ∼285.0 eV is associated with the binding energy of the C atoms in aromatic C–C/C–H [40], and the peak at 288.55 eV can be attributed to the binding energy of the carboxylic group (O–C=O), which is in agreement with the literature results [41].
3. Conclusion
The aim of this work was to determine whether IR spec-troscopy and XPS could allow us to easily distinguish the different structural varieties of Al2O3and therefore be used as a rapid diagnostics to evidence the phases present in the protective layers of high temperature materials. It was thus possible to determine the FTIR spectra of Al2O3phases and the XPS analysis at different temperatures of oxidation and to evidence a continuous evolution leading to the simultaneous presence of several Al2O3phases. These results have allowed us to determine some characteristic IR and XPS peaks, that is, signatures, for the various transition Al2O3phases and 𝛼-Al2O3. Using these IR and XPS signatures, it is possible to detect the presence of transition Al2O3naturally grown on Al2O3-former alloys. A detailed example is presented for the oxidation of PM2000 ODS alloy. Indeed, many high tem-perature metallic materials develop Al2O3scales that can act as protective layer against an aggressive environment. In the first stage, mixed Fe, Cr oxides, and transition Al2O3appear; afterwards Al2O3 oxides become gradually the majority as the oxidation temperature increases before transformation into the most stable𝛼-Al2O3structure. Although the physical properties of the transition Al2O3differ, their identification is not straightforward.
Highlights
(i) FTIR and XPS techniques were used to clarify the evolution of oxides formed on the alloy PM2000. (ii) The percentage of the thermal 𝛼-Al2O3 formation
was estimated by XPS analysis as a function of tem-perature.
735 732 729 726 723 720 717 714 711 708 705 702 10000 15000 20000 25000 30000 In te n si ty (a.u .) PM2000 Fe2O3-710.8 FeO-709.6 eV Fe metal-706.7 eV 1473 K 1273 K 1373 K 1073 K 973 K 873 K
Binding energy (eV)
(a) 730 725 720 715 710 705 7000 8000 9000 10000 11000 Fe-O Fe-M PM2000 In te n si ty (a.u .)
Binding energy (eV)
Atom (%) 706.48
Gaussian fit peak BE (eV) FWHM (eV)
23.68 0.89 707.44 710.88 719.71 724.62 19.86 23.13 16.44 16.88 1.88 3.14 1.71 3.37 PM2000 (1473 K) Fe2p3/2 Fe2p3/2 Fe2p3/2 Fe2p3/2 Fe2p1/2 (b) 738 735 732 729 726 723 720 717 714 711 708 12000 15000 18000 In te n si ty (c ps)
Binding energy (eV)
PM2000 (873 K) (c) 735 730 725 720 715 710 705 10000 11000 12000 13000 14000 15000 satellite In te n si ty (a.u .)
Binding energy (eV)
Atom (%) 711.81
Gaussian fit peak BE (eV) FWHM (eV)
42.44 3.36 711.93 715.23 720.20 724.51 00.50 17.70 09.96 14.74 1.07 3.37 3.36 3.20 726.87 3.37 14.74 PM2000 (1473 K) Fe2p3/2 Fe2p3/2 Fe2p3/2 Fe2p3/2 Fe2p3/2 Fe2p3/2 Fe2p1/2 Fe2p1/2 (d)
Figure 11: XPS spectra in the Fe2p region for received and treated PM2000 at various temperatures (a), decomposed O1s peaks of as-received PM2000 (b), decomposed O1s peaks of oxidized PM2000 at 873 K (c), and decomposed O1s peaks of oxidized PM2000 at 1473 K (d).
592 590 588 586 584 582 580 578 576 574 572 570 0 5000 10000 15000 20000 25000 30000 35000 Cr 2p1/ 2 Cr 2p3/ 2 −5000 In te n si ty (a.u .)
Binding energy (eV)
PM2000 (1473 K) PM2000 (1373 K) PM2000 (1273 K) PM2000 (1073 K) PM2000 (973 K) PM2000 (873 K) PM2000 Cr (VI) o xide ∼5 80 Cr (III) o xide ∼ 576 Cr met al 574. 3 (a) 594 591 588 585 582 579 576 573 570 567 7500 9000 10500 In te n si ty (c ps)
Binding energy (eV)
PM2000 (973 K) Cr2p1/2 Cr2p3/2 787 eV 786 eV 783 eV 758 eV 756 eV (b)
Figure 12: XPS spectra in the Cr2p region for as-received and treated PM2000 at various temperatures (a) and decomposed Cr2p peaks of oxidized PM2000 at 973 K (b). 108 106 104 102 100 98 96 94 1500 2000 2500 In te n si ty (c ps)
Binding energy (eV)
Si2p Si2p
Atom (%) 97.75
Gaussian fit peak BE (eV) FWHM (eV)
38.42 3.95
100.87 3.95 61.58
PM2000 (1073 K)
1320 1316 1312 1308 1304 1300 1296 1292 260000 280000 300000 320000 Mg1s In te n si ty (c ps)
Binding energy (eV)
PM2000 (1473 K)
PM2000 (1373 K)
PM2000 (1273 K)
PM2000 (1073 K)
Figure 14: XPS spectra in the Mg2p region for treated PM2000 from 1073 K to 1473 K.
10000 20000 30000 40000 50000 60000 C1s PM2000 294 292 290 288 286 284 282 280
Binding energy (eV)
1473 K 1273 K 1373 K 1073 K 973 K 873 K In te n si ty (a.u .) (a) 294 292 290 288 286 284 282 280 278 2000 4000 6000 8000 10000 In te n si ty (c ps)
Binding energy (eV)
Atom (%) 284.98
Gaussian fit peak BE (eV) FWHM (eV)
C1s C1s 89.40 2.95 288.56 3.00 10.60 PM2000 (1073 K) (b)
Figure 15: XPS spectra in the C1s region for treated and as-received PM2000 at various temperatures (a) and decomposed C1s peak of oxidized PM2000 at 1073 K (b).
Conflict of Interests
The authors declare that there is no conflict of interests regarding the publication of this paper.
Acknowledgments
This work was partly supported by the National Project Research (PNR) and LASPI2A laboratory of Khenchela Uni-versity, Algeria.
References
[1] R. Molins and A. M. Huntz, “Recent improvements in the understanding of alumina film formation and durability,”
Mate-rials Science Forum, vol. 461–464, no. I, pp. 29–36, 2004.
[2] S. Chevalier, R. Molins, O. Heintz, and J. P. Larpin, “Which tool to distinguish transient alumina from alpha alumina in ther-mally grown alumina scales?” Materials at High Temperatures, vol. 22, no. 3-4, pp. 527–534, 2005.
[3] H. El Kadiri, R. Molins, Y. Bienvenu, and M. F. Horstemeyer, “Abnormal high growth rates of metastable Al2O3on FeCrAl alloys,” Oxidation of Metals, vol. 64, pp. 63–97, 2005.
[4] A. M. Huntz, P. Y. Hou, and R. Molins, “Study by deflection of the oxygen pressure influence on the phase transformation in Al2O3 thin films formed by oxidation of Fe3Al,” Materials
Science and Engineering A, vol. 467, no. 1-2, pp. 59–70, 2007.
[5] L. Mar´echal, B. Lesage, A. M. Huntz, and R. Molins, “Oxidation behavior of ODS Fe-Cr-Al alloys: aluminum depletion and lifetime,” Oxidation of Metals, vol. 60, no. 1-2, pp. 1–28, 2003. [6] M. H. Heinonen, K. Kokko, M. P. J. Punkkinen, E. Nurmi, J.
Koll´ar, and L. Vitos, “Initial oxidation of Fe–Al and Fe–Cr–Al alloys: Cr as an Al2O3Booster,” Oxidation of Metals, vol. 76, no. 3-4, pp. 331–346, 2011.
[7] A. H. Heuer, T. Nakagawa, M. Z. Azar et al., “On the growth of Al2O3scales,” Acta Materialia, vol. 61, no. 18, pp. 6670–6683, 2013.
[8] M. F. L´opez, A. Guti´eerrez, M. C. Garc´ıa-Alonso, and M. L. Escudero, “Surface analysis of a heat-treated, Al-containing, Fe-based superalloy,” Journal of Materials Research, vol. 13, no. 12, pp. 3411–3416, 1998.
[9] J. Engkvist, U. Bexell, T. M. Grehk, and M. Olsson, “ToF-SIMS depth profiling of alumina scales formed on a FeCrAl high-temperature alloy,” Applied Surface Science, vol. 231-232, pp. 850–853, 2004.
[10] F. A. Golightly, G. C. Wood, and F. H. Stott, “The early stages of development of𝛼-Al2O3scales on Fe-Cr-Al and Fe-Cr-Al-Y Alloys at high temperature,” Oxidation of Metals, vol. 14, no. 3, pp. 217–234, 1980.
[11] D. Naumenko, W. J. Quadakkers, A. Galerie, Y. Wouters, and S. Jourdain, “Parameters affecting transient oxide formation on FeCrAl based foil and fibre materials,” Materials at High
Temperatures, vol. 20, no. 3, pp. 287–293, 2003.
[12] W. J. Quadakkers, J. Nicholls, D. Naumenko, J. Wilber, and L. Singheiser, Materials Aspects in Automotive Catalytic Converters
MACC, H. Bode, Ed., Wiley-VCH, Munchen, Germany, 2001.
[13] P. Burtin, J. P. Brunelle, M. Pijolat, and M. Soustelle, “Influence of surface area and additives on the thermal stability of transi-tion Al2O3catalyst supports. I: kinetic data,” Applied Catalysis, vol. 34, pp. 225–238, 1987.
[14] P. Y. Hou, X. F. Zhang, and R. M. Cannon, “Impurity distribu-tion in Al2O3formed on an FeCrAl alloy,” Scripta Materialia, vol. 50, no. 1, pp. 45–49, 2004.
[15] B. D. Cullity, Elements of XRD, Addison-Wesley, Reading, Mass, USA, 2nd edition, 1978.
[16] A. Boumaza, L. Favaro, J. L´edion et al., “Transition alumina phases induced by heat treatment of boehmite: an X-ray diffraction and infrared spectroscopy study,” Journal of Solid
State Chemistry, vol. 182, no. 5, pp. 1171–1176, 2009.
[17] L. Favaro, A. Boumaza, P. Roy et al., “Experimental and ab initio infrared study of𝜒-, 𝜅- and 𝛼-aluminas formed from gibbsite,”
Journal of Solid State Chemistry, vol. 183, no. 4, pp. 901–908,
2010.
[18] R. Rinaldi and U. Schuchardt, “Factors responsible for the activity of Al2O3 surfaces in the catalytic epoxidation of cis-cyclooctene with aqueous H2O2,” Journal of Catalysis, vol. 236, pp. 335–345, 2005.
[19] G. K. Priya, P. Padmaja, K. G. K. Warrier, A. D. Damodaran, and G. J. Aruldhas, “Dehydroxylation and high temperature phase formation in sol-gel boehmite characterized by Fourier transform infrared spectroscopy,” Journal of Materials Science
Letters, vol. 16, no. 19, pp. 1584–1587, 1997.
[20] W. W. Peng, P. Roy, L. Favaro et al., “Experimental and ab initio study of vibrational modes of stressed Al2O3films formed by oxidation of Al alloys under different atmospheres,” Acta
Materialia, vol. 59, pp. 2723–2730, 2011.
[21] L. Shen, C. Hu, Y. Sakka, and Q. Huang, “Study of phase trans-formation behaviour of Al2O3through precipitation method,”
Journal of Physics D: Applied Physics, vol. 45, no. 21, Article ID
215302, 2012.
[22] C. H. Shek, J. K. L. Lai, T. S. Gu, and G. M. Lin, “Transformation evolution and infrared absorption spectra of amorphous and crystalline nano-Al2O3 powders,” Nanostructured Materials, vol. 8, no. 5, pp. 605–610, 1997.
[23] W. Fei, S. C. Kuiry, S. Seal, K. Scammon, N. Quick, and M. June, “High temperature surface oxidation of metallic fibres for hot gas filtration,” Surface Engineering, vol. 18, no. 3, pp. 197–201, 2002.
[24] S. Chevalier, A. Galerie, O. Heintz, R. Chassagnon, and A. Crisci, “Thermal alumina scales on FeCrAl: characterization and growth mechanism,” Materials Science Forum, vol. 595–598, pp. 915–922, 2008.
[25] G. Berthom´e, E. N’Dah, Y. Wouters, and A. Galerie, “Tem-perature dependence of metastable alumina formation during thermal oxidation of FeCrAl foils,” Materials and Corrosion, vol. 56, no. 6, pp. 389–392, 2005.
[26] J. T. Kloprogge, L. V. Duong, B. J. Wood, and R. L. Frost, “XPS study of the major minerals in bauxite: gibbsite, bayerite and (pseudo-)boehmite,” Journal of Colloid and Interface Science, vol. 296, no. 2, pp. 572–576, 2006.
[27] H. E. Evans, W. M. Bowser, and W. H. Weinberg, “An XPS investigation of alumina thin films utilized in inelastic electron tunneling spectroscopy,” Applications of Surface Science, vol. 5, no. 3, pp. 258–274, 1980.
[28] M. C. Biesinger, B. P. Payne, A. P. Grosvenor, L. W. M. Lau, A. R. Gerson, and R. S. C. Smart, “Resolving surface chemical states in XPS analysis of first row transition metals, oxides and hydroxides: Cr, Mn, Fe, Co and Ni,” Applied Surface Science, vol. 257, no. 7, pp. 2717–2730, 2011.
[29] E. Paparazzo, “XPS and auger spectroscopy studies on mixtures of the oxides SiO2, Al2O3, Fe2O3and Cr2O3,” Journal of Electron
Spectroscopy and Related Phenomena, vol. 43, no. 2, pp. 97–112,
1987.
[30] M. Aronniemi, J. Sainio, and J. Lahtinen, “Chemical state quantification of iron and chromium oxides using XPS: the effect of the background subtraction method,” Surface Science, vol. 578, no. 1–3, pp. 108–123, 2005.
[31] T. Yamashita and P. Hayes, “Analysis of XPS spectra of Fe2+and Fe3+ions in oxide materials,” Applied Surface Science, vol. 254, pp. 2441–2449, 2008.
[32] P. C. J. Graat and M. A. J. Somers, “Simultaneous determination of composition and thickness of thin iron-oxide films from XPS Fe 2p spectra,” Applied Surface Science, vol. 100-101, pp. 36–40, 1996.
[33] A. Malki, Z. Mekhalif, S. Detriche, G. Fonder, A. Boumaza, and A. Djelloul, “Calcination products of gibbsite studied by X-ray diffraction, XPS and solid-state NMR,” Journal of Solid State
Chemistry, vol. 215, pp. 8–15, 2014.
[34] W. J. Quadakkers, K. Schmidt, H. Gruebmeler, and E. Wallura, “Composition, structure and protective properties of Al2O3 scales on iron-based oxide dispersion strengthened alloys,”
Materials at High Temperatures, vol. 10, no. 1, pp. 23–32, 1992.
[35] D. Veys, P. Weisbecker, B. Domenichini, S. Weber, V. Fourn´ee, and J. M. Dubois, “Chemical surface ageing in ambient condi-tions of an Al–Fe–Cr approximant phase,” Journal of Physics:
Condensed Matter, vol. 19, no. 37, Article ID 376207, 2007.
[36] R. C. Lobb, J. A. Sasse, and H. E. Evans, “Dependence of oxidation behaviour on silicon content of 20%Cr austenitic steels,” Materials Science and Technology, vol. 5, no. 8, pp. 828– 834, 1989.
[37] N. Louet, H. Reveron, and G. Fantozzi, “Sintering behaviour and microstructural evolution of ultrapure𝛼-alumina containing low amounts of SiO2,” Journal of the European Ceramic Society, vol. 28, no. 1, pp. 205–215, 2008.
[38] J. Chovanec, D. Galusek, J. R´ahe, and P. ˇSajgal´ık, “Low loss alumina dielectrics by aqueous tape casting: the influence of composition on the loss tangent,” Ceramics International, vol. 38, no. 5, pp. 3747–3755, 2012.
[39] V. V. Ivanov, S. Y. Ivin, A. I. Medvedev, S. N. Paranin, V. R. Khrustov, and A. K. Shtol’tz, “Fabrication of Mg- and Ti-doped submicron-grained alpha-alumina-based ceramics,” Inorganic
Materials, vol. 37, no. 2, pp. 194–201, 2001.
[40] T. L. Barr and S. Seal, “Nature of the use of adventitious carbon as a binding energy standard,” Journal of Vacuum Science and
Technology A: Vacuum, Surfaces and Films, vol. 13, no. 3, pp.
1239–1246, 1995.
[41] S. Ben Amor, G. Baud, M. Jacquet, G. Nans´e, P. Fioux, and M. Nardin, “XPS characterization of plasma-treated and alumina-coated PMMA,” Applied Surface Science, vol. 153, no. 2, pp. 172– 183, 2000.
Submit your manuscripts at
http://www.hindawi.com
Hindawi Publishing Corporation
http://www.hindawi.com Volume 2014 Inorganic Chemistry
International Journal of
Hindawi Publishing Corporation
http://www.hindawi.com Volume 2014
Photoenergy
Hindawi Publishing Corporation
http://www.hindawi.com Volume 2014
Carbohydrate
Chemistry
International Journal ofHindawi Publishing Corporation
http://www.hindawi.com Volume 2014
Journal of
Chemistry
Hindawi Publishing Corporation
http://www.hindawi.com Volume 2014
Physical Chemistry
Hindawi Publishing Corporation http://www.hindawi.com Analytical Methods in Chemistry Journal of Volume 2014 Bioinorganic Chemistry and Applications
Hindawi Publishing Corporation
http://www.hindawi.com Volume 2014
Spectroscopy
International Journal ofHindawi Publishing Corporation
http://www.hindawi.com Volume 2014
The Scientific
World Journal
Hindawi Publishing Corporationhttp://www.hindawi.com Volume 2014
Medicinal Chemistry
Hindawi Publishing Corporation
http://www.hindawi.com Volume 2014
Chromatography Research International Hindawi Publishing Corporation
http://www.hindawi.com Volume 2014
Applied ChemistryJournal of
Hindawi Publishing Corporation
http://www.hindawi.com Volume 2014
Hindawi Publishing Corporation
http://www.hindawi.com Volume 2014 Theoretical Chemistry
Journal of
Hindawi Publishing Corporation
http://www.hindawi.com Volume 2014
Journal of
Spectroscopy
Analytical Chemistry
Hindawi Publishing Corporation
http://www.hindawi.com Volume 2014
Journal of Hindawi Publishing Corporation
http://www.hindawi.com Volume 2014 Quantum Chemistry
Hindawi Publishing Corporation
http://www.hindawi.com Volume 2014
International
Electrochemistry
International Journal ofHindawi Publishing Corporation
http://www.hindawi.com Volume 2014
Hindawi Publishing Corporation
http://www.hindawi.com Volume 2014