Cost Modeling in the Integrated Supply Chain Strategic Decision Process
By Todd Robinson
B.S. Mechanical Engineering, University of California - Berkeley (1993) B.A. Sociology, University of California - Santa Cruz (1993)
Submitted to the Sloan School of Management and the Department of Mechanical Engineering in Partial Fulfillment of the Requirements for the Degrees of
Master of Business Administration and
Master of Science in Mechanical Engineering
In Conjunction with the Leaders for Manufacturing Program at the Massachusetts Institute of Technology
June 2006
©2006 Massachusetts Institute of Technology. All rights reserved.
Signature of Author
Department of Mechanical Engineering Sloan School of Management May 6, 2006
Certified by
Debbie Nightingale, Thesis Supervisor Professor, Department of Aeronautics and Astronautics
Certified by
Stephen Graves, Thesis Supervisor Professor, Sloan School of Management
Certified by
David Hardt, Thesis Reader Professor, Department of Mechanical Engineering
Accepted by
Lallit Anand, Graduate Committee Chairman Department of Mechanical Engineering
Accepted by
Debbie Berechman, Executive Director of MBA Program Sloan School of Management
Cost Modeling in the Integrated Supply Chain Strategic Decision Process
By Todd Robinson
Submitted to the Sloan School of Management and the Department of Mechanical Engineering on May 6, 2006 in partial fulfillment of the Requirements for the Degrees of
Master of Business Administration and Master of Science in Mechanical Engineering
Abstract
This thesis is based on an internship at Honeywell Aerospace’s Integrated Supply Chain (ISC) Leadership division. This work focuses on the role and use of analytical cost models in the strategy development process. The scope of ISC strategic decisions encompasses Honeywell Aerospace’s global footprint of external and internal suppliers, and includes insourcing, outsourcing, transition and consolidation activities.
The current practice within Honeywell Aerospace is to construct a Transition, Migration, and Integration (TMI) model which calculates the net present benefit associated with a specific transition’s spending and savings. This model is the primary tool for strategic plan development. This work looks at the use of the TMI model for strategic planning with the intent of addressing concerns related to the model’s complexity and accuracy. This work also develops the framework for estimating a confidence range within the TMI model to provide better visibility to the potential range of financial outcome.
An additional tool used in the development of the strategic plan is the Landed Cost model. The Landed Cost model is used to calculate the steady state total cost associated with a particular supply chain. Historically within Honeywell Aerospace ISC planning, the Landed Cost model has been used to much less of a degree than the TMI model. This work develops the role of the Landed Cost model and establishes a framework for estimating labor, logistics, inventory, and tax costs associated with manufacturing products in a variety of global regions.
While this work focuses on developing analytical tools, developments and recommendations are provided in the context of the overall strategic decision process. Examples are provided to highlight the major cost drivers associated with a particular transitional activity or supply chain design. Improving the analytical component of the decision process allows ISC Leadership to more accurately and effectively identify tactics for improving operational efficiency and identify potential growth opportunities in emerging regions.
Thesis Supervisor: Debbie Nightingale
Title: Professor, Department of Aeronautics and Astronautics Thesis Supervisor: Stephen Graves
Acknowledgements
I would like to thank Honeywell for sponsoring my internship, for providing the resources that make this thesis possible, and for the opportunity to learn and further develop my skills. I would like to specifically thank the following individuals, listed alphabetically, who directly assisted in this process: Amir
Allahverdi, Debbie Birks, Todd Cooper, Clinton Kent, Jack Lawless, Rob Mionis, Miriam Park, Dave Rogers, Ajit Sareen, Sarah Tans, and Prentis Wilson.
I would also like to thank my thesis advisors, Professor Stephen Graves and Professor Debbie Nightingale, for their advice and support during my internship.
I would like to acknowledge the Leaders for Manufacturing Program with special thanks for providing me such an excellent opportunity. In particular, I would like to thank Jon Griffith, Dave Hardt, Don
Rosenfield, Jeff Shao, Davicia Smith, and Nancy Young-Wearly for all of their help in making this possible.
Lastly, I would like to thank my family, especially my brother Michael, for their assistance and encouragement as I embarked on this journey.
Biographical Note
In 1993, Todd Robinson graduated from the University of California at Berkeley with a Bachelor of Science in Mechanical Engineering with Honors, and from the University of California at Santa Cruz with a Bachelor of Arts in Sociology. He has over 9 years of experience developing production processes for the manufacture of space, defense, and commercial electrical and mechanical hardware, including turn-key electrical enclosures for the IT industry. His most recent role was as the New Product Introduction Manufacturing Engineering Manager at Trend Technologies, Inc., a global contract manufacturer serving key Silicon Valley IT equipment manufacturers. In this capacity, he held primary engineering
responsibility for deploying new products and manufacturing processes into seven production facilities worldwide, and has provided support both in the US and overseas on production launches for customers including Dell, Sun, Cisco, Apple, HP, and Toyota.
Currently, Todd Robinson is a Leaders for Manufacturing Fellow at MIT, class of 2006. He is interested in pursuing Operations Management opportunities in Asia upon graduation.
Note on Proprietary Information
In the interest of protecting Honeywell competitive and proprietary information, figures presented throughout this thesis have been disguised, are for the purpose of example only, and do not represent actual Honeywell data.
Table of Contents
1 INTRODUCTION... 5
1.1 HONEYWELL... 5
1.2 AEROSPACE REORGANIZATION... 6
2 AEROSPACE STRATEGIC PROCESS ... 9
2.1 PROBLEM STATEMENT... 9
2.2 DELIVERABLES... 9
2.3 APPROACH... 10
3 STRATEGIC PLANNING AND IMPLEMENTATION... 12
3.1 INITIAL STATE... 12
3.2 TMIPROCESS IMPROVEMENT... 14
3.3 INCREMENTAL IMPROVEMENT VS.STRATEGIC VISION... 17
3.4 IMPLEMENTATION OF REFINED STRATEGIC PROCESS... 19
4 TRANSITION, MIGRATION, AND INTEGRATION MODEL ... 20
4.1 INITIAL TMI MODELING CONCERNS... 20
4.2 TMIMODEL ASSESSMENT AND ERROR SOURCES... 22
4.3 FINANCIAL RESULTS CONFIDENCE RANGE... 29
4.4 LEVEL 1ESTIMATION MODEL... 30
4.5 LEAN PRACTICES AND THE TMIMODEL... 34
5 LANDED COST MODEL ... 37
5.1 LABOR COSTS... 38
5.2 LOGISTICS COSTS... 39
5.3 INVENTORY COSTS... 41
5.4 TAX EFFECTS... 44
5.5 LANDED COST MODEL... 46
5.6 ADDITIONAL SOURCING RISKS... 48
6 INTEGRATION ... 48 7 CONCLUSION... 49 7.1 MANAGEMENT FEEDBACK... 49 7.2 PRACTICAL CONSIDERATIONS... 50 7.3 LESSONS LEARNED... 51 7.4 CRITICISMS... 53
7.5 RECOMMENDED FUTURE WORK... 54
8 BIBLIOGRAPHY ... 55
APPENDIX A – CASH FLOW DEFINITIONS ... 56
APPENDIX B – TMI MODEL, SAMPLE RESULTS SCREEN... 58
APPENDIX C – LEVEL 1 MODEL, SAMPLE INPUT SCREEN... 60
1 Introduction
This thesis is based on an internship within Honeywell Aerospace’s Integrated Supply Chain (ISC) Leadership group in Phoenix, Arizona. One of the functions of ISC Leadership is to identify
opportunities to improve the Aerospace organization’s global operating efficiency, and develop a strategic plan to realize those opportunities. Operating decisions influence how and where products are to be manufactured and serviced, and can entail insourcing or outsourcing, factory consolidation, or the transition to a Low Cost Region (LCR). The purpose of this internship is to assess analytical tools used by Honeywell Aerospace to make strategic decisions.
This thesis assesses and develops the analytical framework for two key cost models used for creating and implementing the Aerospace strategic plan: the Transition, Migration, and Integration (TMI) model, and the Landed Cost model. The work detailed here serves to address some concerns over the existing tools, such as precision vs. accuracy, ease of use, and the calculation of a confidence range. This thesis also considers the current strategic decision process and how these models fit into that process.
The work described herein is divided into the following chapters. Chapter 1 is an overview of Honeywell, the recent Aerospace reorganization, and the role of Strategy and Integration. Chapter 2 outlines the project, the problems to be addressed, and the approach. Chapter 3 looks into the
organizational process for using analytical tools to develop strategic goals. Chapter 4 describes work on the TMI model, including the development of a new Level 1 transition cost model. Chapter 5 describes the development of a new Landed Cost model. Chapter 6 summarizes the integration and use of these tools within the current process. And finally, Chapter 7 summarizes lessons learned while working on this project.
1.1 Honeywell
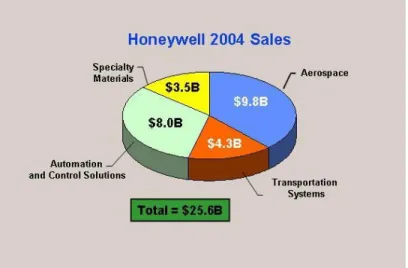
Honeywell (NYSE: HON) is a diversified technology and manufacturing leader headquartered in Morris Township, NJ. They are a Fortune 100 company with sales of $25.6 Billion in year 2004. There are four major Honeywell business units: Automation and Control Solutions, Transportation Systems, Specialty Materials, and Aerospace. Aerospace makes up the largest segment with sales of $9.8 Billion in 2004.
Honeywell Aerospace is headquartered in Phoenix, Arizona. They employ 40,000 people worldwide, and offer a diverse set of products and services under three major categories: Aerospace Electronic Systems (AES), Engine Systems & Services (ES&S), and Aircraft Landing Systems (ALS). Their customer base contains a global spectrum of aerospace manufacturers, including Airbus, Boeing, Bombardier, Cessna, Hughes, Learjet, Lockheed Martin, Northrop Grumman, Raytheon, United Technologies, the U.S. Department of Defense, Department of Energy, and NASA, as well as leading airlines and airport authorities.
1.2 Aerospace Reorganization
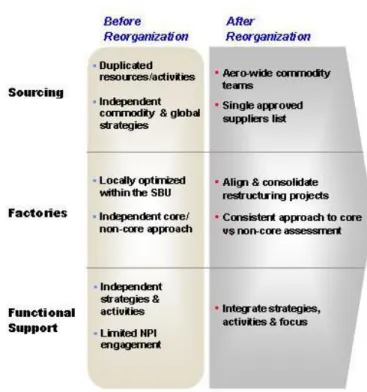
Just prior to the start of this internship, Honeywell Aerospace began a major reorganization to combine the three business units (AES, ES&S, and ALS). During this time, the scope of the internship was expanded from an AES focus to include all of Aerospace operations. The purpose of this reorganization is to improve operational efficiency by taking advantage of the synergies that exist within the original business units. Within ISC, major strategic initiatives focused on reducing redundancies and aligning different approaches and activities within functional support, sourcing, and factory operations.
Figure 2 – Honeywell Aerospace ISC Synergies Roadmap
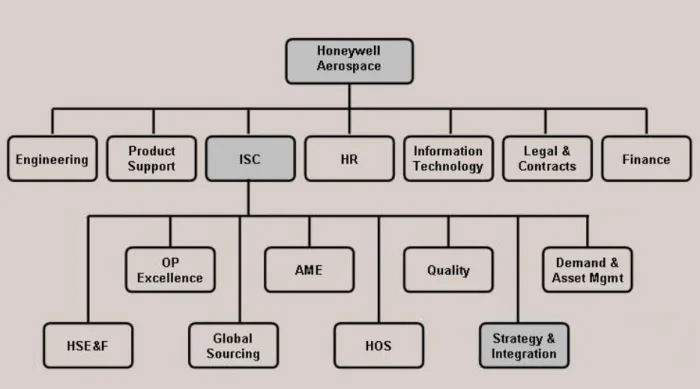
The separate electrical and mechanical strategic planning departments were combined into one, called Global Strategy and Integration, and located within the Tempe Arizona facility. It is within the Global Strategy and Integration group that this project takes place. The new organization has responsibility for completing analytical work on strategic projects generated prior to the reorganization, as well as
identifying new opportunities as the result of the reorganization. Figure 3 below shows the new organizational structure.
Figure 3 - Honeywell Organizational Structure
1.2.1 Strategy and Integration
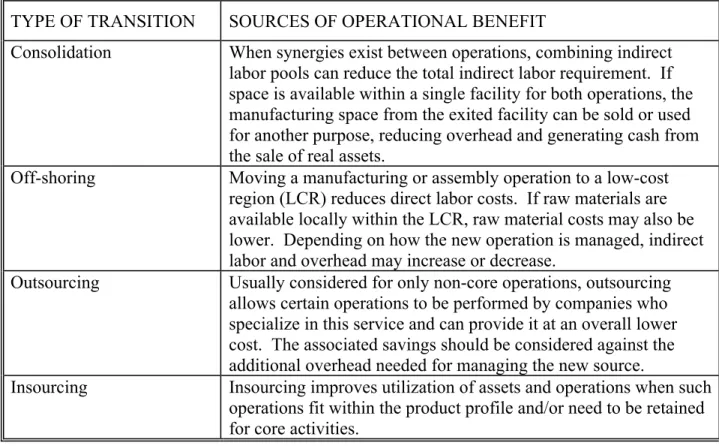
Within Global Strategy and Integration, the term ‘transition’ refers to the process for changing the integrated supply chain manufacturing configuration or footprint, often involving significant restructuring of manufacturing assets. Figure 4 (below) lists the major transition categories and the associated benefits. For each transition type there is typically an investment requirement associated with different activities, which may include asset relocation, severance payments, and start-up costs. There should also be a long term benefit in operational savings. Analytic models are used to calculate the net present value of the investment and savings. The Strategy and Integration group uses this information and considers each transition against other operational constraints to determine the overall strategic plan. Such operational constraints can include, but are not limited to, customer or agency requirements, the minimum return on investment, the strategic development budget, and/or the maximum allowable yearly P&L impact.
Prior to the Aerospace reorganization, there were different departments using their own analytic models within AES and ES&S for strategic planning. In addition to using different models, the groups had different definitions for costs and what items were included in the overall analysis. At the time of the reorganization, it was decided that the AES TMI model would be the model used within the new organization. The AES TMI contained a greater level of detail in the
analysis and also included the timing of various activities or events on a monthly basis within the transition. The previous ES&S model still allowed for a complete analysis, but cash flows were more aggregated and the model did not provide the level of detailed insight into the process that the AES version did.
The AES TMI model, from now on called the TMI model, is used to calculate a variety of scenarios for strategic planning with the Strategy and Integration group. This model is the primary tool used to decide which strategic projects go forward.
TYPE OF TRANSITION SOURCES OF OPERATIONAL BENEFIT
Consolidation When synergies exist between operations, combining indirect labor pools can reduce the total indirect labor requirement. If space is available within a single facility for both operations, the manufacturing space from the exited facility can be sold or used for another purpose, reducing overhead and generating cash from the sale of real assets.
Off-shoring Moving a manufacturing or assembly operation to a low-cost region (LCR) reduces direct labor costs. If raw materials are available locally within the LCR, raw material costs may also be lower. Depending on how the new operation is managed, indirect labor and overhead may increase or decrease.
Outsourcing Usually considered for only non-core operations, outsourcing allows certain operations to be performed by companies who specialize in this service and can provide it at an overall lower cost. The associated savings should be considered against the additional overhead needed for managing the new source.
Insourcing Insourcing improves utilization of assets and operations when such operations fit within the product profile and/or need to be retained for core activities.
2 Aerospace Strategic Process
Given the sensitive nature of strategic transitions, confidentiality and rumor control are major concerns within the organization. There are three phase-gates that the TMI model must pass through before being approved and executed. The different phase-gates are used to strike a balance between the number of people who need to be aware of a proposal and the minimum data required to determine if the analysis and transition should proceed. Often, it is not possible to generate exact quotes for moving manufacturing equipment or to determine the market value of property without alerting the community to potential plans to change the business. Many different scenarios are carried out on paper, and only a few will make it into the official strategic development plan. Rumors concerning changes to the business are potentially disruptive and it is in ISC Leadership’s interest to protect the different plans being considered from passing outside the Strategy and Integration organization.
As the TMI passes through the three phase-gates, cost and savings estimates are refined to the highest level of confidence possible without publicly disclosing the project. If a transition plan makes it through the three phase-gates and is approved, it is assigned to a transition team who becomes responsible for executing the transition within the defined budget. The transition budget is approved based on TMI estimates, and, after approval, gets rolled into the publicly disclosed general operating budget for the entire division. Therefore, once a project begins, it is difficult to revise the budget if additional funding is needed.
2.1 Problem Statement
The competitive landscape for Honeywell Aerospace is maturing with an increased level of price sensitivity. While still not a commodity market, operational efficiency is becoming increasingly important. Additionally, trends toward globalization drive new operational optimization
challenges.
Honeywell’s analytic modeling process is a key component in their overall strategic planning process. This project assesses current modeling practices within Aerospace Strategy and Integration with the intent of not only addressing existing concerns over the models, but also developing improvements to these analytic tools, as well as the overall decision process. Recommendations and analytic tools developed within this project are designed to create an enhanced level of confidence that the correct strategic actions are being implemented. It is hoped that through this effort, a more effective supply chain management process will result.
2.2 Deliverables
This thesis documents developments in three major areas. Two separate cost models are considered: the TMI Model and the Landed Cost Model. The analytical methodology for these tools is described here. Additionally, the operational process within Strategy and Integration for using these two tools is addressed. The actual modeling tools developed remain with Honeywell and are not included here in their entirety. Instead, examples using the models are included for demonstration purposes.
2.3 Approach
The analytic frameworks for the TMI and Landed Cost models were developed in the context of the overall ISC strategic decision and implementation process. This process evolved over the course of the internship as recommendations were implemented. While improvements to the models and process occurred in parallel, the strategic decision and implementation process will be addressed here first. By framing the process for using the analytical tools, developments to analytic methodologies will appear in context. Analytical tool methodologies are approached while considering the current process, existing resources, data availability, product demand profiles, and the existing operating environment.
2.3.1 Organizational Process
In order to develop appropriate modeling tools, the purpose and implementation of those tools in daily practice needs to be understood. During the discovery phase of this research, the way in which the analytic models are used is assessed. It is not enough to have analytic models that produce accurate results. It is equally important that the models are used in a way that ultimately benefits the company. While assessing the process for using these models, the question is asked: Does this process lead to the creation of a factory footprint that operates as a competitive
advantage?1 Making an incremental operational improvement is not always in the best interest of the company, especially when the improvement is from a single perspective. For example, moving to a low cost region to realize direct labor savings may actually increase the total value chain cost. Aspects of a factory footprint that can increase total cost include the distance and response time to the customer, sequence of core operations, and the location of the supply base. Due to the reorganization, operational processes were evolving rapidly during this internship. This provided the unique opportunity to incorporate procedural recommendations as they were identified. Some of these recommendations were incorporated into Honeywell’s modeling work instruction. Changes to the process and the underlying philosophy for generating both a strategic vision and incremental strategic goals are detailed in Chapter 3.
2.3.2 TMI Model
The TMI model is the primary tool used to determine the value of a strategic transition. It is used to calculate transition scenarios which may get incorporated into the strategic plan. One major transition, a consolidation between two electronic assembly facilities, was nearing completion at the start of this internship. This transition provided the opportunity to interview people involved in executing the transition to determine where errors in the estimation process occurred. Financial results from several other completed transitions were also reviewed. A series of improvements to the model developed from the findings of this investigation and initial concerns regarding the model from management.
1
This effort followed two paths. The existing TMI model was modified to incorporate the desired improvements and a new modeling tool, called the Level 1 model, was developed to allow rapid generation of scenario results for quick comparisons. The purpose of the new Level 1 model is to allow rapid changes to the underlying assumptions within an estimation so that several ‘what if’ scenarios can be generated quickly.
Incorporated into the new Level 1 model is the ability to estimate the effect of lean
manufacturing practices on a scenario’s NPV as if the sending site (the site manufacturing operations are moving from) was operating at an improved level of efficiency. This feature provides a better understanding of borderline cases where small improvements could change the final decision.
The results from the Level 1 tool are comparable to the existing TMI model. However, validating one estimation tool with another creates concerns over the real accuracy of new model, and the lack of consistency in historical data made historical comparisons difficult. Therefore, a system was implemented for retaining real transition performance data going forward for the purpose of verifying and making adjustments to both models in the future.
2.3.3 Landed Cost Model
The Landed Cost model, often referred to as the Total Landed Cost model, was not being consistently used for strategic planning. There were a few different versions of landed cost modeling tools available. However, the available models either required the user to define all of the costs or were generally too complicated for everyday use. A few of the existing landed cost and supply chain inventory models were assessed for suitability against reasonable use
expectations and typical Aerospace product profiles. Ultimately, it was determined that a new model would be needed to meet the current analytic requirements.
A new Landed Cost model was developed that calculated the cost impact of four major categories: Direct Labor, Shipping, Inventory, and Taxes. The purpose of this tool is to allow quick comparisons between a variety of global regions for both individual parts and entire part families. While this tool does not calculate the total landed cost of a value chain, it does allow the direct comparison of these major cost drivers with minimal input data requirements. Each of the four included cost drivers is considered within the model incrementally. In some cases, assumptions were made in order to maintain the model’s ease-of-use expectation. Since the model is used for comparing alternate manufacturing regions, and not for calculating an exact landed cost, the assumptions made were determined to be acceptable as any error would be constant across all regions.
We hope that by creating a model that requires minimal input data and is easy to use, landed cost comparisons will become standard practice during the development of strategic goals and
initiatives. As with the Level 1 model, real part data from emerging regions is scarce and validation of the model will occur as the model is used. Both the Level 1 and Landed Cost model have been created to allow changes to be made easily to the underlying cost assumptions, so that as more is known about real costs the models can be quickly updated.
3 Strategic Planning and Implementation
Over the course of this internship, the process for planning and executing a transition changed significantly, partly as a result of this internship effort and partly as a result of other
improvement initiatives. The initial depiction below for modeling, approving, and carrying out a transition describes the process at the beginning of the internship. After an initial investigation, several recommendations were generated to improve the process. These recommendations are also described, along with the actual changes to the process.
3.1 Initial State
Before the Aerospace reorganization, AES and ES&S had different transition modeling
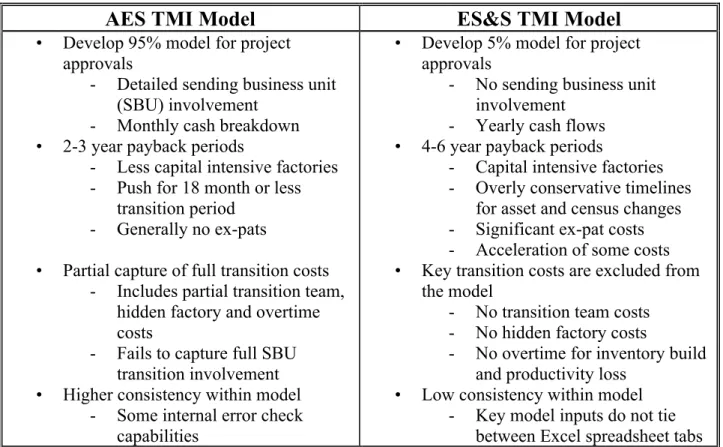
processes. At the start of this internship, these systems were being combined. Even though the combination of these systems was underway at the start of the internship, it is important to note the differences as it impacts initial findings and the consistency of available historical data. Direct comparisons between AES and ES&S project plans were difficult because each used different key metrics, assumptions, and approval criteria. The ES&S TMI model tended to have more aggregated cost entries over a broader timeframe than the AES model. For example, ES&S equipment relocation expenses might include a certain amount of facilities cleaning or fit-up expenses, where in the AES model they’re entered as separate line items. When comparing relocation costs, it would be difficult to reconcile why ES&S might be estimating $15/sqft compared to $8/sqft from AES. Figure 5 below outlines the major differences in the two processes.
The existing AES methodology was selected as the modeling system to be used going forward. The AES TMI model had a higher degree of resolution, both in time and specific costs, as well as desirable error checking features that helped identify mistakes. The AES process allowed for three rounds, or phases, of model evaluation, each with an increasing level of analytical scrutiny. At each of the three phase-gates, called 5%, 50%, and 95%, the financials in the model needed to pass certain hurdles in order to proceed. During each subsequent phase, more time is invested in identifying and refining estimates for probable costs and savings. If a project passes to the 95% stage and is approved, it is transferred to a transition team that re-evaluates the financials and signs off on a transition budget. The different level percentage labels loosely referred to the level of confidence in the results, and are explained further in Section 3.2.1. Once the project was approved at the 95% stage, the process entered Phase 0 (zero). After the financials were accepted and the transition budget set, the project entered Phase 1. A process diagram is shown in Figure 6 below.
AES TMI Model
ES&S TMI Model
• Develop 95% model for project approvals
- Detailed sending business unit (SBU) involvement
- Monthly cash breakdown • 2-3 year payback periods
- Less capital intensive factories - Push for 18 month or less
transition period - Generally no ex-pats
• Partial capture of full transition costs - Includes partial transition team,
hidden factory and overtime costs
- Fails to capture full SBU transition involvement • Higher consistency within model
- Some internal error check capabilities
• Develop 5% model for project approvals
- No sending business unit involvement
- Yearly cash flows • 4-6 year payback periods
- Capital intensive factories - Overly conservative timelines
for asset and census changes - Significant ex-pat costs - Acceleration of some costs • Key transition costs are excluded from
the model
- No transition team costs - No hidden factory costs
- No overtime for inventory build and productivity loss
• Low consistency within model - Key model inputs do not tie
between Excel spreadsheet tabs Figure 5 – AES and ES&S TMI Methodology Comparison
Figure 6 – Flow Diagram of Initial TMI Process2
2
3.2 TMI Process Improvement
Following an initial assessment of this process, the following recommendations for process improvements were generated. During the internship, while the TMI model and Landed cost model were under development, these recommendations were implemented and incorporated into the process work instruction.
3.2.1 TMI Model Phase Labeling
The 5%, 50%, and 95% labels for the three model stages were used to suggest a certain amount of confidence in the model’s financial results. As the model proceeded to the next stage, more research was performed to justify the quoted financial cost and savings estimates. The final model approved might then be assumed to deliver financial results with a 95% confidence. These labels were found to be confusing and potentially misleading. The indicated confidence level label neither defined a traditional confidence interval for the expected results, nor declare how confident the team was that the results were exactly accurate.
Since the stage labels function more as a progress indicator, communicating how far along the team was in the analysis, they were changed to Level 1, Level 2, and Level 33. This may seem like a trivial adjustment, but it becomes an important perceptual difference in how the results are viewed and shared with other departments or Honeywell leadership. The results from the final level model are used to define the project budget, which then becomes a constraint for the transition implementation team. Declaring a false confidence level for the expected outcome may inaccurately set management’s expectations and generate conflict as contingencies arise.
3.2.2 TMI Model Level Requirements, Assumptions, and Definitions
The TMI model contains cash flow information on about 25 different worksheets, or tabs, within an Excel workbook. Previously, the individual cost definitions, assumptions, and minimum data requirements at each model level were not clearly specified and it was up to individual
interpretation when enough work had been performed to declare a phase-gate review. For a Level 1 analysis, any information that was known about a project or could be estimated within a few hours was entered. As the model progressed to Level 2 and Level 3, data within all 25 worksheets was readdressed as the preliminary estimates were refined. Because the model was in a constant state of refinement, at any point in time it was hard to track changes and
assumptions through the three levels and to know where enough work had been done or more work was needed. Also, because all estimates in the entire model were being refined through each level, there was some inefficiency in the process through repeat reviews.
The specific details of what gets included in each model entry need to be standardized. Without formal definitions for individual line items, it is difficult to interpret reports, pass ownership of a project to someone new, or perform a meaningful post-project analysis or data review. Also
3
needed is a specification of the minimum data requirements at each level, such as what assumptions are made and when those assumptions are refined with actual quotes. The
assumptions should be used to calculate earlier level results and get updated with hard numbers as the model passes though the next levels. Organizing both the process and the model will improve its ease-of-use and the tracking of assumptions, estimation sources, concerns, and potential contingencies. A complete list of TMI Model entries and the associated final definitions is included in Appendix A. The following simplified example illustrates typical expectations at each level of the analysis.
Moving equipment between two facilities might involve packing and crating, shipping, the supplying of power, water, and lighting in the new building, and removing the utility drops in the old building. The model’s asset relocation entry would cover only the costs for packing, crating, and shipping. In a Level 1 analysis, the costs would be estimated from the size of the manufacturing area multiplied by a typical cost per square-foot. During the Level 2 analysis the sending site manager provides details about the
manufacturing area that change the cost per square-foot assumption. Before the Level 3 analysis is completed, a quote to move the equipment might be generated.
3.2.3 Split vs. Continuous Process, and Cost Estimation Ownership
Possibly the largest issue with the previous process was that it was separated into two distinct steps. A model for each project is created by the strategy group and then passed ‘over the wall’ to an implementation team. It is interesting that Phase 0, which might signify the beginning of a project, occurred after the project was approved. At this point, the transition implementation team would do a bottoms-up calculation of what the actual transition costs will be and compare it to the approved estimation. The new result is based on what is actually happening on the
manufacturing floor. There is a certain amount of renegotiation that takes place during this step before a budget is finalized and activity begins. In the past, the original model was not always updated and some opportunities to learn from the implementation were lost. If a lessons-learned review was performed, it occurred after the completion of the project.
The discontinuity that occurs between the two steps has several negative effects, one of which concerns the perception of ownership over the model and the analysis. The strategy team may do an accurate job estimating the project, but after Phase 1 they were no longer accountable for the financial outcome of the project. The transition team might take an adversarial stance in the process as they were inheriting a project with a constrained budget. There is the perception that some approved projects are positively biased in order to meet the minimum financial
requirements. Given such a case, the project would be burdened from the beginning and the transition team would have a difficult time being successful.
The primary reason for this discontinuity concerns project confidentiality. Rumors about strategic plans are particularly disruptive to the organization. Should the manufacturing staff be alerted to potential plans to move the operation, whether the rumors are founded or not, the operational efficiency of the organization will decline as workers take the mindset that there is no future in the organization. In addition, key people may start looking for new jobs and leave when they are needed most. Because of the need for total confidentiality, there is a high level of
secrecy for strategic development proposals. It is not possible to take an accurate audit of what is happening on the floor without people becoming suspicious. Simply visiting a plant once or twice is enough to start suspicions.
Currently within the organization, there are people who have been involved in implementing active transitions and have managed transition teams. Bringing these people onboard earlier in the process will help smooth the handoff between planning the project and executing it. Confidentiality can still be protected while creating an overlap between the two functions. In addition to involving the transition team earlier, the people responsible for modeling a project should be involved in any post-approval financial revision. Each function, planning and implementation, needs visibility into what the other side is doing.
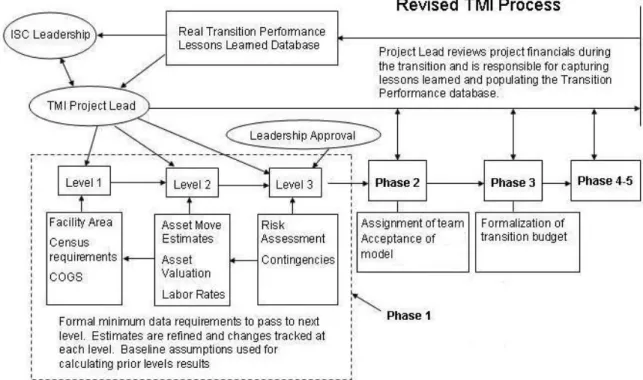
Ultimately, a project begins when it’s first conceived and a Level 1 analysis is performed. In the revised process, this is where the Phase 1 begins. At that point, a Project Lead gets assigned who has ownership over the financial model through to the completion of the project. The new
process flow diagram is shown in Figure 7 below.
The TMI Project Lead drives the analysis through to approval, and then participates in the budget review process as the transition is being executed. The Project Lead owns the estimation model and is responsible for updating it throughout the project. By linking the two functions,
estimation and implementation experiences can be shared and learning maximized. Also, keeping the Project Lead involved during the implementation reduces the incentive to bias the analysis and helps mitigate the adversarial stance adopted by the implementation team.
3.2.4 Departmental Reviews, and Knowledge Retention
In the past, strategic projects have been approved without being viewed by some of the more important internal organizations. A transition might be underway, only to find out there are enormous tax or legal consequences. Before final approval, each proposal should be reviewed by the following internal departments, regardless of any preconceptions: Site Finance and Sourcing Leads, Facilities, HR, Legal (Contracts Review and Export Compliance), Tax, Logistics, and Corporate Finance.
Again, there is the concern about confidentiality. In the revised process, these organizations are contacted just prior to final approval to see if any financial adjustments are needed or any potential contingencies should be highlighted. Regular discussions with these departments can also help to identify additional opportunities. For example, during one discussion with the Tax group, a unique R&D tax incentive within Mexico was identified. If R&D capabilities get incorporated into new Mexico greenfield projects then there are additional tax savings.
Changes to the TMI process are designed to help make the Project Leads as knowledgeable as possible. Retaining this knowledge and transferring it to new members of the organization is the final step in the revised process. A new Lessons Learned database was created that tracks initial estimates, final financial results, and any errors or missed contingencies along the way. The TMI Project Lead has responsibility for collecting and entering the final financial data. Hopefully, as this database gets populated, future estimates will grow increasingly accurate. Another function of this database is to allow the refinement and validation of the new Level 1 Modeling tool discussed in Chapter 4.
3.3 Incremental Improvement vs. Strategic Vision
Considering the financial analysis of the TMI model alone does not provide the needed insight into how the overall organization needs to develop. In fact, the TMI may financially justify a strategic move that is counter productive. The TMI model only looks at two manufacturing options or locations and determines the net savings associated with the switch. There are cases where the model could indicate a move is profitable when it actually will harm the business. One reason for this is the inability to capture all of the relevant costs or effects of the move, especially when some effects are more qualitative in nature.
For example, when comparing manufacturing in the US to China, the labor savings in China might be significant enough to show a net savings even in light of the added logistics and management costs. However, there are more issues to consider: Will the local labor force be talented enough to build the products in question? Are there regulations preventing the off-shoring of the technology? Is manufacturing in the region approved by the FAA? Will the new location create an outlier in the supply chain footprint, away from current suppliers and
Thinking along single lines of ‘where should we go from here’ can lead to making decisions that detract from the efficiency of the organization as a whole. This is classified in literature as incremental improvement. In order to prevent making mistakes associated with incremental improvement, a vision of the ideal final state of the entire value chain for the whole organization is needed4. Then, when considering strategic moves, ask the question ‘Does this move us closer to the ideal state or away from it?’.
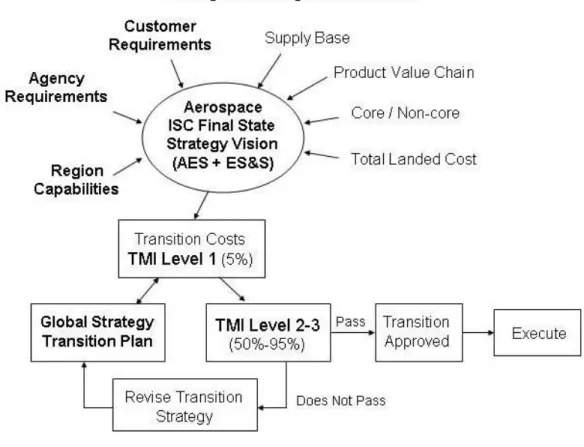
A major concern in aerospace and defense manufacturing is government regulatory constraints. Other factors that need to be considered include customer requirements, the supply base, region capabilities, and total landed cost. Within this research, the landed cost model that was
developed (and documented in Chapter 5) was created to assist the Global Strategy and Integration group define the ideal ISC final state vision. Understanding the total cost of the value stream is vital to defining the optimal manufacturing footprint. Figure 8 below shows the revised strategic development process from a higher level.
Figure 8 – Development of the Strategic Vision
4
After the ideal final state is defined, the TMI model is used to consider specific scenarios related to achieving the final state. Given the initial investment requirement for a transition, the TMI model will define which strategic moves get incorporated into the Global Strategy Development Plan. There are currently more aerospace opportunities than implementation resources available, and the TMI is used to screen different scenarios to determine which scenarios to execute first. As an example of another way to think about this, suppose that during the creation of the final state vision it is established that the company needs to develop certified manufacturing
operations in Mexico. However, the startup costs associated with FAA regulatory and certification processes are high. The TMI analysis for a Mexico greenfield plant will be
burdened by the start-up costs and may not pass the minimum requirement for a 5 year return on investment. If all new Mexico manufacturing operations cannot be approved because the start-up costs are high, then either the strategic vision needs to be changed or the investment needs to be considered outside of typical ROI standards. If Mexico operations are still desired, then a TMI analysis on all available scenarios will determine the best opportunity.
3.4 Implementation of Refined Strategic Process
The process outlined above is a change in the way of thinking about how a strategic plan is developed and executed. The two most important concepts outlined here are:
1) A vision of what the value chain footprint should look like in the future is required, and the strategic development plan should be moving the company toward that vision. 2) There are elusive elements to every strategic transition, both quantitative and qualitative,
that can have a major impact on the performance of a project. It is important to consider a decision from alternative viewpoints and to get feedback from resident experts on issues such as logistics, inventory, taxes, and others.
This revised process was incorporated into Honeywell’s Strategic Planning work instruction. An explanation of the sequential steps is documented along with some of the underlying philosophy for this process. The process flow diagrams (Figures 7 and 8) are also included. Continuous improvement is a desirable characteristic of any competitive company, and so this process will likely continue to evolve. Throughout this change process, it’s important to consider not only what we do, but why we do it. The work described above is intended to create some of that philosophic foundation.
4 Transition, Migration, and Integration Model
The purpose of the TMI model is to estimate the net effect of changing the value stream. For a typical supply base and manufacturing configuration, potential strategic development plans might include insourcing, outsourcing, consolidation, and relocation of parts or all of operations and current products. In order to change the configuration of operations, a certain amount of investment is required. This investment may be in the form of purchasing new assets, relocating existing assets, hiring and training, or the severance of existing employees to name just a few. This investment will be referred to as the switching cost to realize the savings from improved operations.
Estimating the switching cost is a key part of making sound strategic decisions. Consider the following example.
Moving a plant over the border might produce annual savings of $1million in labor and related expenses. The product line is believed to become obsolete in 10 years. The switching costs are $3.8million and it will take 1 year to implement the change. Should the plan go forward? Assume the internal rate of return is 9% and there would be 9 years of savings after implementation. The Net Present Value (NPV) of the savings is
$5.5million. Therefore, the NPV of the project is $1.7million. If there were no risk in the project, it should go forward. However, there is always some risk in disrupting operations, and in some cases the risk is substantial. To account for risk, there may be a requirement that all operations improvement projects have a NPV of at least $2million before they are approved. In that case, the project will not be executed.
These concepts are rooted in the principles of finance5. The TMI model is performing this
calculation at a much larger scale for transition projects that are typical in the aerospace industry. At the beginning of this research, there were some initial concerns within ISC Leadership about the performance of this modeling tool. This research aims to address those concerns as well as identify other improvement opportunities.
4.1 Initial TMI modeling concerns
Current Honeywell Aerospace strategic plans based on the TMI’s financial results represent $100’s of millions in development projects. There is significant interest in ensuring that the TMI model is providing a sound financial analysis. Strategic plans can be classified as non-routine operating decisions. When considering strategic scenarios, all relevant incremental cash flows should be accounted for6. The TMI is a comprehensive model that aggregates estimated cash flows from up to 33 different sources depending on the nature of the project. Typical projects can take 2-5 years to implement, and financial projections go out for years after the
implementation is complete.
5
Brealey et al., Principles of Corporate Finance, 2003 6
4.1.1 Model Accuracy
The primary concern with the TMI model is over the accuracy of the financial projections. The model has evolved over the years from a single page tally of cash flows to the current 25 page Excel spreadsheet. As new relevant cash flows were identified, they were incorporated into the model. Most of the cash flows represented in the model for any specific project are based on estimates. Therefore, the result is the aggregation of many small estimates. There are two sources of error in the model.
1) Estimation error in an identified cash flow.
2) The omission, or overlooking, of a relevant cash flow.
Concerns over rumor control and project confidentiality add to the challenge of making accurate estimates. While some cash flows can be estimated accurately with quotes and financial
operating statements, others may be entered as approximations based on experience.
4.1.2 Range of Results
Typical of any Excel-based spreadsheet, the final result can offer a precise projection out to multiple decimal places which grossly misrepresents the model’s actual accuracy. Most people recognize that precision in the forecast doesn’t represent accuracy. What is needed is an
estimation of the potential range of expected outcome. The existing TMI model did not provide this visibility, which can lead to some very large surprises.
Consider the previous NPV example. The reason for the $2MM minimum return for new projects was to cover unknown risk associated with disrupting operations. This has the same effect as raising the required IRR to something that would represent a similarly risky investment. Let’s assume that the project financials just pass at $2MM. Assuming a normal distribution for financial outcome, there is a 50% probability that the results realized will be above the projection and a 50% probability that the results will be below. However, we don’t know how far above or below $2MM we will be, or if the project will actually realize a negative NPV.
4.1.3 Ease of Use
As newly identified cash flows have been added to the TMI model, the model has evolved to the point that makes it difficult to understand or use, especially for people who are unfamiliar with it. The model allows the estimation of up to 33 different cash flows on 25 different worksheets. The enhancements are driven by the need for accuracy. However, in some cases only a quick result is needed, such as when considering several different ‘what if’ scenarios. The complexity also makes it difficult to understand what a project’s primary cost drivers are. This ultimately ties the model to its creator to answer all questions about the analysis and to make any changes.
4.2 TMI Model Assessment and Error Sources
An investigation into the TMI modeling process was conducted to identify sources of estimation error. One transition in particular, a consolidation between two facilities making similar
products in Phoenix, was used as the basis for interviews with individuals on both the TMI modeling team and the transition implementation team. This transition was nearing completion and provided an excellent source for information on the current state of the process. Information from these interviews provided insight into how the model differed from the actual project, as well as into the TMI process altogether (these interviews provided some of the basis for the process recommendations outlined in Chapter 3). The interviewees were informed at the start of each interview that all interviews were completely confidential and that they could be as candid about the process as they wished. For this reason, details from each respondent are not included in this thesis.
Other historic projects from the AES and ES&S business units were also selected for investigation. These investigations entailed interviewing the primary project contact within Strategy and Integration and reviewing the original model against the recorded financial results. There is a general lack of continuity within historical data, as the modeling process along with the types of cash flows captured has changed over the years. While many of the error sources within the historical projects had already been fixed in the current process, these projects provided insight into how human effects can disrupt both the analysis and a project’s implementation.
4.2.1 Relevant Incremental Cash Flows
When calculating the net effect of a strategic decision, the TMI model sums incremental cash flow changes that are caused by the decision as they would occur in time. Some of these cash flows are directly related to transition activity and are easy to predict, while some are more subtle and may involve effects like operating efficiency. In addition, the relevance of an included cash flow may depend on perspective, and can be the source of more philosophic discussions.
To illustrate this point, consider the following.
The people who will execute the transition may already be on the payroll in another capacity. Should their labor be included as an expense? The site will see no additional payroll expense, but what about their productivity on what they were doing before being reassigned?
When a manufacturing facility is being closed, there is a decline in the operating efficiency for the products made in the facility until the factory closes. The same labor and overhead expenses will be allocated to fewer finished products. This decline is caused by both the logistics of the process, as equipment is relocated and assembly areas
vacated, and the reduction in employee morale as people deal with uncertainty and the loss of their jobs. How should the associated additional cost be accounted for? Once an assembly area is vacated, the area can be put to another use, leased, or sold. Should the expenses associated with retaining that area be included in the model as a savings once it is vacated? What if no other use for the space is found?
Two criteria were applied when considering which cash flows to include in the model. The first is how much the cash flow impacts the final result. The percentage of change depends on the ratio of the cash flow to the aggregate result. Since the TMI model is used for a range of transition types and sizes, if a cash flow could impact some of the smaller projects then it was included. A detail can always be omitted in the model if it is found to be inconsequential. Secondly, if recording a cash flow affects the implementation team, then it was included. The TMI model is ultimately used for developing an execution timeline and budget, and constraints are created for people associated with the project based on the analysis. Even if a cash flow has a small effect on the final result, it was included in the analysis if it was felt that not including it might negatively impact some part of the downstream process.
Some cash flows are budgeted within a project model that may not appear within the operation as result of the project. This can be a source of discussion with people in finance, since these cash flows are not necessarily incremental to the business. Ultimately, this is a matter of how the boundary is drawn around a project and can change for different scenarios. When building a model, it is important to state the assumptions as they relate to these cash flows. For example, the headcount of the transition team is added as a cost to the model. The assumption is that these people were working on something before they were reassigned and there would need to be some backfill support, possibly in the form of temporary workers. Another example deals with fixed overhead. Usually, within the model there is a savings associated with fixed overhead reduction when product is removed from an assembly area. Unless the area is disposed of, the overhead charges are still there and get spread over the remaining products manufactured in the facility. The assumption is that the space will be used for something productive, which may not always be the case.
4.2.2 Cash Flow Assessment Results
The following factors were already captured by the TMI model at the beginning of this
investigation. Each item was specifically accounted for within the model. A few of the included items do not directly enter into the cash flow calculations, such as book value and depreciation, but are used for determining the P&L effects of the project. Management may add additional constraints to a strategic plan relating to the maximum allowable P&L impact on the company’s financial statements for a given period. As an example, the sale of a building creates a positive cash flow for the project increasing its value. If the sale amount is below book value then the asset sale will be recorded as a loss on the company’s books. While cash flow is important for determining real value, P&L effects can influence public perception of performance.
TMI Estimation Factors* • Asset Move • Building Cleanup • Environmental Cleanup • Hidden Factory • Requalification/certification • Overtime requirements • Information Systems • Tooling • Facilities Fit Up • Transition Core Team • Transition Team Travel • Census
• Transfers • Severance • Retention • Relocation
• Hiring and Training
• Census overlap • Variable Overhead • Fixed Overhead • Asset Sales • Book Value • Write-offs • Depreciation add-back • Depreciation • Inventory Pre-build
• Inventory Pre-build Overtime requirement
• Material Add-back • Outsourcing Costs • Inventory Driven Costs • Other operating expenses • Discretionary spending costs • Miscellaneous Spending
* A list of definitions is included in Appendix A
This investigation highlighted sources of error in two categories, estimation error and the omission of a transition effect. From the list of captured values above, the following have estimation accuracy issues.
Hidden factory – Hidden factory represents the cost to document all of the
undocumented processes with an operation. This depends on the age of the plant, the number of products and processes, and how well plant management has historically performed in ensuring processes get documented. For operations being exported to foreign countries, Hidden Factory will also include the cost of document translation. There have been studies in Hidden Factory cost estimation which improve estimation results. However, because of the complexity of the issue, rules-of-thumb are typically applied with the understanding that the real cost is undetermined.
Transition team cost – Transition team cost represents the personnel expense for the people required to implement a transition. An initial estimate is based on the type of manufacturing, type of project, and the product volume or COGS. Projections are based on experience, but requirements can change as the project progresses.
Hiring / Training cost – Typically, estimation errors relating to Hiring and Training involve operations in emerging regions, where there is little internal experience in a local marketplace. The rates charged by local employment contractors are estimated based on the published local labor rates. However, because of increasing hiring competition in emerging regions, the local hiring agencies may charge as much as in the US.
Current asset (inventory / real) estimation – Valuation of company assets to be sold is subject to changing market conditions as well as the condition of the asset. For
outsourcing projects, where material is sold to a contractor, inventory value is easier to estimate. Differences in inventory value occur when the physical inventory is located and the condition assessed. For real, or property assets, sales price depends on the market and offers received. Unknowns about the property’s condition impact the final sales price.
Required census / assets – A more thorough investigation into existing conditions will help improve estimations for census and asset requirements in a new location.
Estimation errors in census arise from an abnormal labor utilization at the sending site. When a new operation is established, the labor requirements are defined as a percentage of full utilization without overtime. Assets such as equipment and fixtures at the sending site may need to be replaced or repaired before placed into service at the new location. Pre-build requirements & cost (efficiencies) – A pre-build is specified when the transition is buffered by material. While the sending site is shut down and the receiving site has not yet begun production, customer requirements are satisfied with pre-built inventory. Depending on the labor utilization of the sending site, pre-build typically is created using overtime and extra shifts. If the sending site is already using overtime to meet current demand, then satisfying pre-build requirements may require additional resources. Once a transition is announced, production efficiency tends to decline as a result of both the transition logistics and morale erosion. This further impacts the ability to meet pre-build demand.
In addition to the TMI estimation factors listed above, some new factors were identified that influence the analysis and implementation of a project. These factors are described below.
Current census utilization – As described above, the sending site labor utilization can differ from what will be expected at the receiving site. New factory operations set labor utilization to the current standard, which does not include an allowance for overtime. Any difference in utilization between sites will mean that the census requirements at the receiving site will need to be adjusted. This factor is not directly incorporated into the TMI model, but is highlighted as something that should be determined prior to project approval.
Transition effect, factory efficiency reduction – As described above, transition activity causes a decline in factory productivity. This can be difficult to estimate. Like census utilization above, this effect is documented as something to be aware of when defining production requirements for the sending site.
Local labor source turnover rate – In some foreign countries, seasonal effects and long term labor churn can add to the overhead requirement for maintaining the labor pool. Local labor trends need to be considered when establishing operations in a new region. Tax effects – Tax effects can have a dramatic impact on the results of a project. Taxes are also the most difficult to model, as some tax benefits are realized through negotiation with local governments. The tax department should be consulted prior to beginning activity on any project. Some tax credits may become more difficult to negotiate once an implementation is in process. Tax effects that should be considered include, but are not limited to:
• Import tariffs – Customs duties may be added to imports depending on the product in question. The rate applied to specific products is defined according to their Harmonized Tariff Schedule (HTS) category.
• Intellectual Property tax penalties – The US applies a special tax penalty to the offshore production of intellectual property.
• Tax incentives – Some governments issue tax holidays or credits to businesses associated with local investment.
• Business exit tax – When exiting a region, the local government may apply a tax on the value of the business that left.
• Different regional tax rates – Different global regions apply a different tax rates to profit created and retained in the region. For example, the US rate is approximately 40% while Singapore is about 20%. An arms-length standard is applied to internal transfer pricing to discourage tax abuse. This topic is covered more in Chapter 5.
Inbound / outbound logistics effects – Incremental logistics costs are included within the model’s variable overhead section. Logistics costs should have a separate category within the model to highlight the potential significance of this cost driver. The logistics cost impact depends on the availability of local sources. For greenfield establishments in emerging regions, the material pipeline may extend for raw materials being imported to the region as well as for returning finished goods. Logistics costs are also covered within Chapter 5.
Additional investigative effort while estimating these factors will help to improve the accuracy of the model. However, understanding the potential range for each factor is enough to allow a proper analysis. If there is a question about the potential magnitude of a cash flow, the
conservative end of the range can be used. In this way, any surprises will hopefully be pleasant. However, this may block a project with borderline results. Since there is a level of uncertainty with all estimates, the preferred method is to pass the expected range through the model to the final result to determine the potential effect of the uncertainty. Doing a sensitivity analysis on questionable inputs will identify whether or not the uncertainty is significant to the overall project. Knowing how the range associated with each factor effects the analysis will also help
identify where to allocate investigative resources. The ability to pass uncertainty through the model, outlined in section 4.3, was developed and incorporated in the current model version.
4.2.3 Cash Flow Analysis
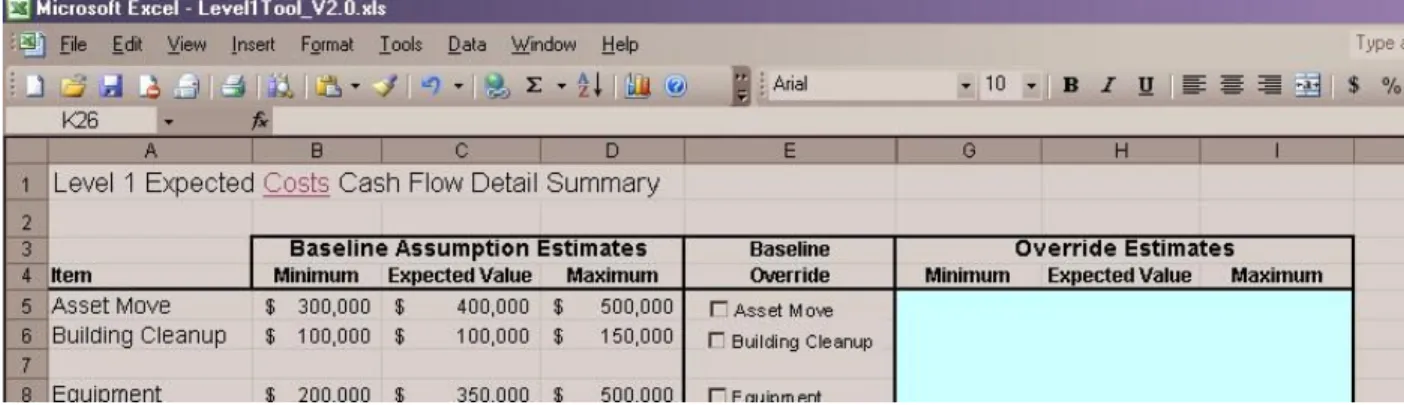
The TMI model starts at Level 1 with rough estimations for a few factors, typically the relocation of equipment and census changes. Projects that pass the minimum financial requirement for ROI progress to Level 2, where the assumptions used in Level 1 are refined. At Level 3, all relevant factors should be estimated and included in the model. The cash flow analysis performed by the model is fairly straight-forward. Costs and savings are recorded within the model according to the time they are expected to occur. The TMI model is broken down into monthly cash flows, which are then binned into yearly amounts. The monthly resolution allows the model to be used for planning implementation activities. The combined annual amounts are then summed for a total year-by-year expected cash flow. The remaining input to the model is the company’s internal rate of return. The discounted cash flows, NPV, and IRR for the project are then calculated. A sample output from the final model version is included in Appendix B.
4.2.4 Cost Avoidance vs. Savings
Within the TMI model there may be entries for expenses that can be prevented by the transition, such as required building repairs, retrofits, or upgrades. As the transition is carried out, the costs avoided may not get included within the financials as operational savings. This can be a source of discrepancy between estimated and realized financial reports. If the expenses were already budgeted, then they can be associated with the project to show up as a gain. In any case, documenting and keeping track of cost avoidance factors throughout the project will help keep estimates inline with actual project performance.
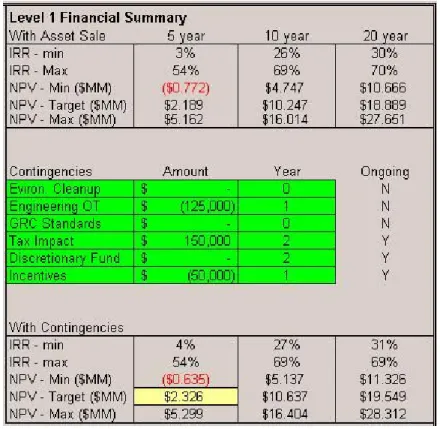
4.2.5 Contingencies
There can be some incremental cash flows that may or may not occur. These factors behave like step functions, and the probability for their occurrence is often undetermined. Simply including or excluding them in the model will bias the results one way or the other. Also, recording an expected outcome based on the estimated probability will not provide the entire view of a project’s risk to management. Some examples of contingencies include performing
environmental remediation prior to an asset’s sale, updating processes to new standards, being awarded tax incentives, or paying optional employee benefits. If the contingency is significant, a separate model result for each scenario can be generated for discussion. When dealing with contingencies, documenting all model assumptions and potential risk is critical. Often, taking proactive measures can mitigate the risk, and if a negative situation arises, then management will have already been alerted to its potential.
4.2.6 Dealing with Change vs. Estimation Error
Even if an exact financial projection was possible, in short time something will change. Strategic projects involving the relocation of manufacturing operations can take years to implement. Over the course of the implementation, demand, customer requirements, and labor and material costs can change. New products or projects might be introduced. During an
implementation, it is important to understand when differences in project performance are caused by errors in the original financial projection or by the changing business landscape. Shortening the implementation duration can help mitigate some of the risk of change. However, focusing on projects that take only a year or two to implement may interfere with the company realizing its strategic vision.
Within the project review process, there needs to be a mechanism for identifying change and accommodating it. Holding the implementation team to the original financial projections or census levels will be counter-productive if product demand is escalating. Similarly, if the manufacturing site or products are rapidly becoming obsolete, management needs to know when and how to abandon the project. Difficulties can also arise when two projects overlap. For example, if two assembly areas are being moved into one building, there will be discussions about which budget is used to pay for improvements to the infrastructure. In this case, it may be best to combine the project financials.
4.2.7 Human Effect and Model Error
One potentially large source of error between the financial projections and actual results, either during the estimation process or after implementation has begun, is the human effect. The reality is that transitions disrupt people’s lives, and they will behave in ways that protect their jobs or resist change. Bias in the model can occur when people providing estimates act to influence the result one way or another. If there is pressure to find a way to get a particular project approved, the financial estimates may be adjusted to present a better view. If site leaders realize their location may be closed, they may adjust estimates to make the financials look worse. Once a transition is approved and in process, people within the sending site may impede progress to protect their jobs as long as possible, or disrupt the process out of a sense of retribution for losing their job. In one particular case, an otherwise straight-forward project turned into a major
problem when equipment and documentation at the sending sight were not delivered complete and on-time. Dealing with strong unions, as in the aerospace industry, is particularly
challenging. Terminating a few positions within one facility can create a nationwide strike if the union objects. Much of the human effect can be mitigated through negotiation combined with strong and effective management, both during the data collection process and throughout project execution. Even so, there will be situations that arise that were not predicted.
4.3 Financial Results Confidence Range
Within Honeywell, one of the desired outputs from this internship is the ability to estimate a potential range for a financial result. This capability was incorporated into both the TMI model and the Level 1 model.
4.3.1 Cash Flow Estimates
In most cases, the estimated range for a particular cash flow value is created based on personal experience. That is, it is someone’s guess as to how far off they could be from the projected target. The recorded historical financial data available does not currently allow a mathematical assessment into primary cost drivers and typical error levels. Ideally, there would be enough data to perform a regression in order to estimate future projects. However, most transitions are unique events. There is often only one previous occurrence of a type of manufacturing operation moving to a specific region. In fact, there may be no previous record of the particular type of project being estimated. To further complicate the usage of historic data, the actual items that were included in different recorded categories have changed over time, so like-kind comparisons cannot be made.
4.3.2 Assumptions
Even though the range provided for an estimate may not represent a true confidence interval and the actual cost or savings realized may not be normally distributed, it is assumed that the most likely result is the target estimate with a decreasing probability for occurrence out to the range endpoint. It is also assumed that the probability of the actual result being above an estimate is the same for it being below.
When combining estimate ranges, it would not be proper to add up all of the potential deviations since the chance of all the realized costs and savings being on the extreme high or low side is very small. Instead, estimates calculated within the TMI and Level 1 model use a square root approach.
∆i = Potential deviation from an estimated expected value (i = Estimate 1,2,3,…) Total Predicted Range = Nominal Total Estimate±
∑
( )
∆i 2Looking at cash flows, and how they represent value to the company, we have to consider the difference between inflows and outflows. For a typical transition, there is an investment period after which some operational savings occurs. The maximum value to the company is when the smallest investment creates the largest return. Similarly, the smallest value to the company is when the largest investment creates the smallest return. This principle is incorporated into the model for year-over-year results. Results for maximum and minimum NPV reflect company value.