RESEARCH OUTPUTS / RÉSULTATS DE RECHERCHE
Author(s) - Auteur(s) :
Publication date - Date de publication :
Permanent link - Permalien :
Rights / License - Licence de droit d’auteur :
Bibliothèque Universitaire Moretus Plantin
Institutional Repository - Research Portal
Dépôt Institutionnel - Portail de la Recherche
researchportal.unamur.be
University of Namur
EOMES and IL-10 regulate antitumor activity of T regulatory type 1 CD4 + T cells in
chronic lymphocytic leukemia
Roessner, Philipp M; Llaó Cid, Laura ; Lupar, Ekaterina; Roider, Tobias; Bordas, Marie;
SCHIFFLERS, Christoph; Arseni, Lavinia; Gaupel, Ann-Christin; Kilpert, Fabian; Krötschel,
Marit; Arnold, Sebastian J. ; Sellner, Leopold; Colomer, Dolors; Stilgenbauer, Stephan;
Dietrich, Sascha; Lichter, Peter; Izcue, Ana; Seiffert, Martina
Published in: Leukemia DOI: https://doi.org/10.1038/s41375-021-01136-1 Publication date: 2021 Document Version
Publisher's PDF, also known as Version of record
Link to publication
Citation for pulished version (HARVARD):
Roessner, PM, Llaó Cid, L, Lupar, E, Roider, T, Bordas, M, SCHIFFLERS, C, Arseni, L, Gaupel, A-C, Kilpert, F, Krötschel, M, Arnold, SJ, Sellner, L, Colomer, D, Stilgenbauer, S, Dietrich, S, Lichter, P, Izcue, A & Seiffert, M 2021, 'EOMES and IL-10 regulate antitumor activity of T regulatory type 1 CD4 + T cells in chronic lymphocytic leukemia', Leukemia. https://doi.org/10.1038/s41375-021-01136-1
General rights
Copyright and moral rights for the publications made accessible in the public portal are retained by the authors and/or other copyright owners and it is a condition of accessing publications that users recognise and abide by the legal requirements associated with these rights. • Users may download and print one copy of any publication from the public portal for the purpose of private study or research. • You may not further distribute the material or use it for any profit-making activity or commercial gain
• You may freely distribute the URL identifying the publication in the public portal ? Take down policy
If you believe that this document breaches copyright please contact us providing details, and we will remove access to the work immediately and investigate your claim.
A R T I C L E
CHRONIC LYMPHOCYTIC LEUKEMIA
EOMES and IL-10 regulate antitumor activity of T regulatory type 1
CD4
+
T cells in chronic lymphocytic leukemia
Philipp M. Roessner 1●Laura Llaó Cid1,2●Ekaterina Lupar3,11 ●Tobias Roider 4●Marie Bordas1,2●
Christoph Schifflers 1,12,13●Lavinia Arseni1●Ann-Christin Gaupel1●Fabian Kilpert3,14●Marit Krötschel3,15●
Sebastian J. Arnold 5,6●Leopold Sellner 4●Dolors Colomer 7●Stephan Stilgenbauer8●Sascha Dietrich4●
Peter Lichter 1●Ana Izcue 3,9,10●Martina Seiffert 1
Received: 14 February 2020 / Revised: 19 November 2020 / Accepted: 11 January 2021 © The Author(s) 2021. This article is published with open access
Abstract
The transcription factor eomesodermin (EOMES) promotes interleukin (IL)-10 expression in CD4+T cells, which has been linked to immunosuppressive and cytotoxic activities. We detected cytotoxic, programmed cell death protein-1 (PD-1) and EOMES co-expressing CD4+T cells in lymph nodes (LNs) of patients with chronic lymphocytic leukemia (CLL) or diffuse large B-cell lymphoma. Transcriptome and flow cytometry analyses revealed that EOMES does not only drive IL-10 expression, but rather controls a unique transcriptional signature in CD4+T cells, that is enriched in genes typical for T regulatory type 1 (TR1) cells. The TR1 cell identity of these CD4+T cells was supported by their expression of interferon gamma and IL-10, as well as inhibitory receptors including PD-1. TR1 cells with cytotoxic capacity accumulate also in Eµ-TCL1 mice that develop CLL-like disease. Whereas wild-type CD4+ T cells control TCL1 leukemia development after adoptive transfer in leukopenic Rag2−/−mice, EOMES-deficient CD4+T cells failed to do so. We further show that TR1 cell-mediated control of TCL1 leukemia requires IL-10 receptor (IL-10R) signaling, as Il10rb-deficient CD4+ T cells showed impaired antileukemia activity. Altogether, our data demonstrate that EOMES is indispensable for the development of IL-10-expressing, cytotoxic TR1 cells, which accumulate in LNs of CLL patients and control TCL1 leukemia in mice in an IL-10R-dependent manner.
Introduction
Despite abundant phenotypical data characterizing CD4+ T cells in chronic lymphocytic leukemia (CLL), their role in disease development and progression is controversial and poorly understood [1]. Besides the well-known T helper (Th) cell subsets [1], interleukin (IL-)10-producing, FOXP3−CD4+
T cells, named T regulatory type 1 (TR1) cells, are lately gaining attention in chronic inflammatory diseases and cancer [2–5]. TR1 cells are described as IL-10-induced cells that produce IL-10 and harbor cytotoxic activity, but also express several co-inhibitory receptors such as programmed cell death protein-1 (PD-1) [5].
Increased expression of PD-1 in blood-derived CD4+ T cells has been reported for CLL [1,6–8] and other B-cell non-Hodgkin lymphomas (B-NHL), including diffuse large B-cell lymphoma (DLBCL) [9,10]. Yet, the role of these PD-1+CD4+T cells in CLL has not been studied. Blockade of PD-1 or its ligand PD-L1, with the aim to enhance CD8+ T cell-mediated antitumoral immunity, resulted in good response rates in the Eµ-TCL1 mouse model of CLL [11,12]. However, clinical trials using immune checkpoint inhibitors targeting the PD-1/PD-L1 axis lead to dis-appointing results. None of the included CLL patients achieved remission in response to therapy and only a subgroup of patients, harboring a more aggressive Richter’s transformation, benefitted from this treatment
These authors contributed equally: Philipp M. Roessner, Laura Llaó Cid, Ekaterina Lupar
These authors contributed equally: Ana Izcue, Martina Seiffert
* Martina Seiffert [email protected]
Extended author information available on the last page of the article Supplementary informationThe online version contains
supplementary material available at https://doi.org/10.1038/s41375-021-01136-1.
123456789
0();,:
123456789
(NCT02332980) [13]. It was hypothesized that the lack of clinical success of PD-1 blockade in CLL was due to the fact that tumor-infiltrating T cells in CLL have a lower expression of PD-1 in comparison to other B-NHL entities, including DLBCL [10]. In DLBCL, PD-1 expression was shown to correlate with better survival [14,15]. However, immune checkpoint blockade resulted in an overall response rate of only about 10% in DLBCL patients (NCT02038933) [16].
Recently, the transcription factor eomesodermin (EOMES) has been shown to promote IL-10 production of TR1 cells together with other factors, like PR domain zincfinger pro-tein 1 (BLIMP1), both in mice and humans [2–4]. EOMES belongs to the T-box transcription factor family, which is expressed in many organs including the immune system [17]. Redundantly with its paralogue T-BET, EOMES has been shown to promote interferon gamma (IFNγ) production and cytotoxicity in natural killer (NK) cells [18–20], CD8+ [19–21], and CD4+T cells [2, 3,19,22,23]. EOMES has also a nonredundant role in promoting maturation of classical NK cells [24], and in the accumulation of central memory [20,25] and exhausted, PD-1-expressing CD8+T cells [26]. Co-expression of PD-1 and EOMES in CD8+ T cells was recently shown by us in the Eµ-TCL1 adoptive transfer (TCL1 AT) mouse model of CLL [27].
In contrast to NK cells and CD8+T lymphocytes, very few CD4+T cells express EOMES without immunological chal-lenge. However, we and others have shown that EOMES can be upregulated in CD4+T cells upon their activation, which affects their differentiation into helper cell lineages [28]. Moreover, EOMES promotes IFNγ expression by Th1 T cells [29–31] and inhibits differentiation of Th17 [3,31,32] and FOXP3+regulatory T cells (Treg) [28].
Here, we observed the accumulation of an EOMES-expressing PD-1+CD4+T-cell subset in CLL patients and mouse models, which we identify as TR1 cells. We further show that these cells harbor cytotoxic function and are able to control leukemia development in mice in an EOMES-and IL-10 receptor (IL-10R)-dependent way.
Methods
Patient samples
Patient samples were obtained after approval of study pro-tocols by local ethics committees from the Department of Internal Medicine III of the University Clinic Ulm, the Department of Medicine V of the University Clinic Hei-delberg, and the Hospital Clinic of Barcelona according to the declaration of Helsinki, and after obtaining informed consent of patients. Patients met standard diagnosis criteria for CLL or DLBCL, respectively. Patient characteristics
such as age, mutational state, and Binet stage are provided in Supplementary Tables 1–3. Healthy, age-matched con-trols were obtained from Biomex GmbH (Heidelberg, Germany) after informed consent.
Tumor models and adoptive CD4
+T-cell transfer
Adoptive transfer of mouse leukemic cells was performed by i.p. or i.v. transplantation of 1–2 × 10⁷ Eμ-TCL1 sple-nocytes into C57BL/6N or J wild-type (WT) female animals of 6–8 weeks of age. For CD4+ co-transfer experiments, female Rag2−/−mice of 6–8 weeks of age were i.v. trans-planted with 2 × 10⁵CD4+ T cells or PBS as control. The following day, 1 × 10⁶ purified TCL1 leukemic cells were transferred i.v. into recipients.
Adoptive transfer of naive CD4+T cells was performed as previously described [28]. In brief, Rag2−/− recipient mice received 4 × 10⁵ FACS-sorted CD4+CD45RBhigh T cells by i.p. injection. Three weeks post transfer, mice were sacrificed, and spleens were analyzed. A list of anti-bodies used in this study is available in Supplementary Table 4.
All animal experiments were carried out according to institutional and governmental guidelines approved by the local authorities (Regierungspräsidium Karlsruhe, permit numbers: G36/14, G98/16, G123/14, and Regierung-spräsidium Freiburg, permit number: 35-9185.81/G-13/73).
Statistical analysis
Sample size was determined based on expected variance of readout. No samples or animals were excluded from the analyses. No randomization or blinding was used in animal studies. The statistical test used for each data set is indicated in the figure legends. Samples of different groups were compared using nonparametric Mann–Whitney test. Com-parison of matched samples was performed using Wilcoxon matched-pairs signed rank test. Values of p < 0.05 were considered statistically significant. All graphs show means ± standard error of the mean (SEM), unless otherwise indicated.
Results
Cytotoxic EOMES
+PD-1
+T
R1-like CD4
+T cells
accumulate in lymph nodes (LNs) of CLL patients
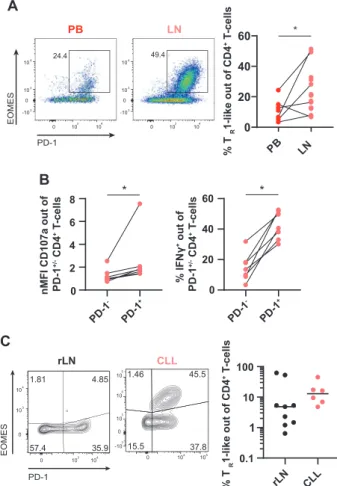
According to published data [1, 6, 8–10, 33–35], we observed an accumulation of PD-1-expressing CD4+T cells in blood samples of patients with CLL or DLBCL in com-parison to healthy controls (HC) (Supplementary Fig. 1A–E), and subsequently aimed to characterize these cells.Since PD-1 has been shown to be expressed by TR1 cells [5], we investigated the frequency of EOMES and PD-1 co-expressing TR1-like cells and observed no difference in the frequency of these cells in the blood of CLL patients and controls (Supplementary Fig. 1F). In line, no substantial changes in the frequency of EOMES+PD-1+TR1-like cells were observed in sequential blood samples of CLL patients over 5 years (Supplementary Fig. 1G). Since TR1 cells were shown to exert cytotoxic functions [5], we analyzed the cytotoxic molecule granzyme B (GzmB), the degranulation marker CD107a, and IFNγ in PD-1+ versus PD-1− CD4+ T cells. This clearly showed that PD-1+cells have a higher cytotoxic capacity compared to PD-1− cells in both CLL patients and controls (Supplementary Fig. 2A–F) confirming that PD-1-expressing CD4+T cells have cytotoxic capacity, also in CLL.
As we and others have recently highlighted clear dif-ferences in the phenotype of T cells in peripheral blood compared to LNs in CLL, with a phenotype of T-cell activation and exhaustion only in the tissue but not in blood [34, 36], we investigated the abundance and frequency of EOMES+ PD-1+ TR1-like cells in secondary lymphoid organs (SLO) of patients. Intriguingly, we detected a higher number of CD4+T cells per CLL cell in LNs compared to paired blood samples (Supplementary Fig. 2G), and a sig-nificantly higher frequency of TR1-like cells in LNs (Fig.1A), which moreover revealed a higher activation state based on CD69 and HLA-DR expression (Supplementary Fig. 2H). These results suggest that TR1-like cells are of pathological relevance in SLO of patients with CLL.
We further analyzed the transcription factors interferon regulatory factor 4 (IRF4) and basic leucine zipper ATF-like transcription factor (BATF), which were shown to be involved in the development of TR1 cells [5], in paired blood and LN samples of CLL patients. We observed a higher expression of IRF4 and BATF in PD-1+ CD4+ T cells in LN compared to blood (Supplementary Fig. 2I, J), supporting the results of an increased frequency of TR1-like cells in SLO of CLL patients. By analyzing the cytotoxic proficiency of T cells, we observed a higher CD107a and IFNγ expression in PD-1+compared to PD-1−cells in the LN (Fig.1B), which is in line with our observation in blood and our hypothesis of a pathological relevance of TR1-like cells.
Ultimately, we aimed to compare the frequency of TR 1-like cells in reactive, nonmalignant LNs (rLNs) versus CLL and DLBCL LNs. We detected a substantial proportion of TR1-like cells in all investigated CLL (median: 12.90%) and DLBCL (median: 14.75%) LN samples. In contrast, the majority of rLNs had a lower frequency (median: 4.85%) of this cell type (Fig.1C and Supplementary Fig. 2K).
Hence, TR1-like CD4+ T cells show cytotoxic abilities and accumulate in LNs of CLL and DLBCL patients,
making their potential pathological involvement in these malignancies very likely.
EOMES controls a T
R1 cell-speci
fic gene signature
including inhibitory receptors in CD4
+T cells
In order to understand the role of EOMES in TR1 cells, we turned to animal models and took advantage of Eomes-GFP reporter mice (Eomes+/GFP) in which Eomes-expressing CD4+ T cells can be identified as GFP-positive cells [37]. As we have previously demonstrated that adoptive transfer of naive CD4+ T cells into lymphopenic Rag2−/− hosts
* %T R 1-like out of CD4 +T -cells PB LN 0 20 40 60 0 103 104 0 -103 103 104 LN 49.4 0 103 104 0 -103 103 104 24.4 PB EOMES PD-1 A 15.5 1.46 45.5 37.8 0 -103 103 104 105 0 104 105 rLN 0 10 10 1.81 4.85 35.9 57.4 3 4 0 103 104 CLL PD-1 EOMES %T R 1-like o ut of CD4 +T -cells rLN CLL 0.1 1 10 100 C PD-1 -0 2 4 6 8 nMFI CD107a out of PD-1 +/-CD4 +T -cells * PD-1 + 0 20 40 60 %I F N γ +out o f PD-1 +/-CD4 +T -cells * PD-1 -PD-1 + B
Fig. 1 EOMES+ PD-1+ TR1-like cells with cytotoxic function accumulate in CLL lymph node samples. APaired PB and lymph node (LN) samples of patients with CLL were analyzed by flow cytometry. Representative dot plots as well as frequency of Eomes+ PD-1+TR1-like cells. B LN samples of CLL patients were stimulated with PMA/ionomycin ex vivo. nMFI of CD107a, and frequency of IFNγ+ cells of PD-1+ or PD-1− CD4+ T cells. C Representative contour plots and frequency of EOMES+PD-1+TR1-like cells out of CD4+T cells in reactive, nonpathogenic lymph nodes (rLN) and CLL patient LN samples. Each dot represents data of an individual patient. Data derived from paired samples are connected by a line. In (C), median of data is depicted. Statistical analysis was performed using Mann–Whitney test. Comparison of matched samples was performed using Wilcoxon matched-pairs signed rank test *p < 0.05. nMFI= normalized median fluorescence intensity.
leads to an accumulation of EOMES+PD-1+cells with TR1 phenotype [28], we transferred CD4+T cells of Eomes-GFP reporter mice into Rag2−/−mice, and 3 weeks later, sorted GFP-positive and GFP-negative CD4+T cells of these mice for RNA sequencing. This allowed us to identify a tran-scriptional signature of 1,048 genes, with 568 upregulated
and 480 downregulated genes, in Eomes-GFP-positive versus Eomes-GFP-negative CD4+ T cells (Fig. 2A, com-parison 1, and Supplementary Tables 5 and 6). As expected, one of the top upregulated genes was Eomes itself, vali-dating our experimental approach. Among the top upregu-lated genes in GFP+ cells, we identified several molecules
Eomes+/GFP EomesΔT/GFP
in Rag2-/- 3 weeks 1 in Rag2
-/-2 CD4 CD4 GFP neg GFP pos GFP pos GFP neg Eomes +/GFP Eomes ΔT/GFP Itgb2l Slfn4 Spi1 Clgn Tbc1d8 Abca13 Eps8l1 Chdh Syt14 Il10 Cpm Fam101b Syk Ildr1 Cd86 Mmp25 C3 Ms4a3 Itga7 Alox5 Ikzf2 Ctla4 Pdcd1 F5 Fcnb Prg2 Prom1 Aldh2 Srgap3 Pde2a Hp 6430548M08Rik Crispld2 Ltf Rab6b Gas7 Igsf6 Lrg1 Gm4955 Camp Olfml2b Dmxl2 Tox Map3k9 B430306N03Rik Mpeg1 Ckap4 Cd300lf Gpr55 Wdfy4 Cd177 Cebpe Socs3 5830411N06Rik Bcl2 Spock2 Adamts14 Rab44 Sort1 Tigit Pydc4 Trbc1 F630028O10Rik Znf41−ps 9130208D14Rik Vmn2r96 Art2a−ps Gm9522 Gm29112 AI506816 Fosb Chn2 Aim1l Arnt2 Il12rb2 Itgb1 Zeb2 Klrb1f Kcnj8 Itgax Nedd4 1700025G04Rik Raver2 Stag3 Notch3 Prdm16 Gbp2b S1pr5 Fut10 Gjb4 Amica1 Zfp683 Cx3cr1 Cass4 Trbv26 Gm13225 H2−T10 9530036M11Rik Rprl2 Gm11942 Gm14403 Gm7809 Gm43305 −6 −4 −2 0 GFP pos GFP pos downregulated in Eomes Δ T /GFP upregulated in Eomes ΔT /G F P
A
0102 103 104 105 0 102 103 104 105 70.9 34.0 Eomes -Eomes + %L A G 3 +in Eomes +/- *** 0 20 40 60 80 100 PD-1 EOMES %o fP D -1 + in Eomes +/-**** 0 20 40 60 80 100 0102 103 104 105 0 102 103 104 105 85.6 36.4 Lag3 chr6 124,905 kb 124,910 kb Eomes+/GFPGFP pos Eomes+/GFP GFP neg EomesΔT/GFPGFP pos EomesΔT/GFPGFP neg Pdcd1 94,040 kb 94,050 kb chr1 Eomes+/GFP GFP pos Eomes+/GFPGFP neg EomesΔT/GFPGFP pos EomesΔT/GFPGFP neg LAG3 EOMES Eomes -Eomes +B
C
3 weeksthat were associated with a TR1 phenotype in mice and men, such as Il10, Il10ra, Pdcd1 (encoding PD-1), Lag3, Tigit, and Cd27 (Supplementary Table 6) [5]. This supports the validity of EOMES as a marker for TR1 cells. Among the top downregulated genes in GFP+cells, we detected Foxp3 (Supplementary Table 6), which is in line with our previous findings of an antagonistic relationship between Eomes and Foxp3 [28].
To analyze the relevance of EOMES in regulating TR1 cell identity, we included a Eomes knock-out mouse model (EomesΔT/GFP) in which one allele of the Eomes gene is disrupted by a GFP knock-in, while the second allele lacks exons 2–5, which encode the DNA-binding domain of EOMES. The truncated mRNA and protein of this second Eomes allele are expressed and detectable in these mice (Supplementary Fig. 3A), but EOMES is dysfunctional and cannot induce target genes [38]. Hence, GFP expression in these mice identifies cells with active Eomes transcription, but lack of EOMES activity. We used the same adoptive transfer approach of CD4+ T cells in Rag2−/− hosts as described above, and performed RNA sequencing of sorted GFP+ and GFP− CD4+ T cells 3 weeks after the transfer. This allowed us to compare gene expression profiles of EOMES-proficient and EOMES-deficient CD4+T cells upon activation of Eomes transcription, and thereby to determine which genes are transcriptionally regulated by EOMES (Fig. 2A, comparison 2). The results of these comparative analyses showed that 109 genes were dependent on tran-scriptional activity of EOMES, with 71 genes showing a lower expression in EOMES-deficient cells, which are therefore most likely direct transcriptional targets of EOMES, while 38 genes showed a higher expression in EOMES-deficient cells (Fig. 2B and Supplementary Table 6).
Despite a low number of differentially expressed genes, EOMES-deficient GFP+cells from two biological replicates clustered separately from EOMES-proficient GFP+ samples on a multidimensional scaling plot (Supplementary Fig. 3B). This suggests that EOMES transcriptional proficiency is indeed required to express a specific transcriptional program. As expected, the GFP-negative samples of both genotypes did not separate well.
Out of these 109 genes, 61 genes were also differentially expressed in comparison 1 representing the transcriptional signature of TR1 cells (Supplementary Fig. 3C; genes highlighted in bold in Fig. 2B), indicating that the TR1 phenotype is driven partly by EOMES.
EOMES has been previously associated with T-cell exhaustion, and abundant expression of inhibitory receptors is a hallmark of TR1 cells [5]. In line with this, we observed that expression of several inhibitory receptor genes, such as Ctla4, Pdcd1, Cd300lf, and Tigit, depends on EOMES, and so does the expression of the exhaustion-associated transcription factor Tox [39,40] (genes highlighted in red in Fig.2B; read alignment for Pdcd1 and Lag3 in Fig.2C). We further vali-dated that EOMES+cells show a higher protein expression of PD-1 and LAG3 in comparison to EOMES−cells (Fig.2C). Using Ingenuity Pathway Analysis of the differentially expressed genes in comparisons 1 and 2, we identified “neuroinflammation signaling” and “T-cell exhaustion sig-naling” as the top deregulated pathways in GFP+cells that are controlled by EOMES (Supplementary Fig. 3D). Altogether, our results suggest that EOMES, via its relevance in TR1 cells, contributes to pathogenesis of inflammatory diseases and potentially also of cancer, including CLL.
To address the question whether EOMES only promotes transcription of a few specific genes (e.g., inhibitory receptors) or acts as a driver of TR1 cells, we developed a marker combination forflow cytometry, which allowed us to enrich for EOMES+ CD4+ T cells in the Rag2−/− adoptive transfer model. We observed that EOMES+cells contain the majority of PD-1+ CD44lo cells in these mice (Supplementary Fig. 3E). Interestingly, adoptive transfer of Eomes-deficient naive CD4+T cells yielded a significantly lower number of PD-1+CD44loCD4+T cells compared to transfer of Eomes-proficient cells, an effect that was pre-served when both Eomes-proficient and -deficient T cells were co-transferred into the same Rag2−/−recipient (Sup-plementary Fig. 3F). These results suggest that EOMES does not only activate the expression of several target genes but is rather controlling the accumulation of this specific CD4+ T-cell subset. Whereas the marker combination PD-1+CD44lo was suitable to identify EOMES+ CD4+ T cells in T-cell transfer experiments in Rag2−/− mice, a respective cell population was not detectable in aged mice (Supplementary Fig. 3E), which argues against the general suitability of this marker combination for identifying TR1 cells.
Fig. 2 EOMES controls a TR1 cell-specific gene signature includ-ing inhibitory receptors in CD4+T cells.Naive CD25−CD45RBhigh CD4+T cells of Eomes-GFP reporter mice (Eomes+/GFP), and of mice with a T cell-specific deletion of Eomes in combination with a GFP reporter (EomesΔT/GFP) were transferred into Rag2−/− mice. Three weeks after adoptive transfer, RNA sequencing of sorted splenic GFP+ and GFP−CD4+T-cell subsets was performed. A Analysis strategy: comparison 1 reveals transcriptional differences between GFP+ TR1 cells and GFP− CD4+ T cells from Eomes+/GFP donor mice; comparison 2 shows differential gene expression between EOMES-proficient (Eomes+/GFP) and EOMES-deficient (EomesΔT/GFP) GFP+ CD4+T cells. B Heatmap of log2 normalized expression of EOMES-dependent genes (comparison 2). T-cell receptor transcripts were excluded from the heatmap. Bold font shows genes which are also differentially expressed in comparison 1. Red highlights genes of interest. C Representative RNA-seq tracks andflow cytometry plots of PD-1 and LAG3 expression in Eomes-GFP+and Eomes-GFP−CD4+ T cells, and quantification of percentage PD-1- or LAG3-expressing cells out of GFP+ or GFP− cells. Each dot represents data of an individual mouse. Lines link data of EOMES− and EOMES+ cells from the same animal. Statistical analysis of matched samples in (C) was performed using Wilcoxon matched-pairs signed rank test. ***p < 0.001; ****p < 0.0001.
In summary, our transcriptome analyses identify a TR1 cell-specific gene signature that includes several inhibitory receptors and is enriched for key TR1-associated pathways and markers. We further show that a part of this signature is driven by EOMES.
EOMES drives IL-10 expression and genes enriched
in the human T
R1 signature
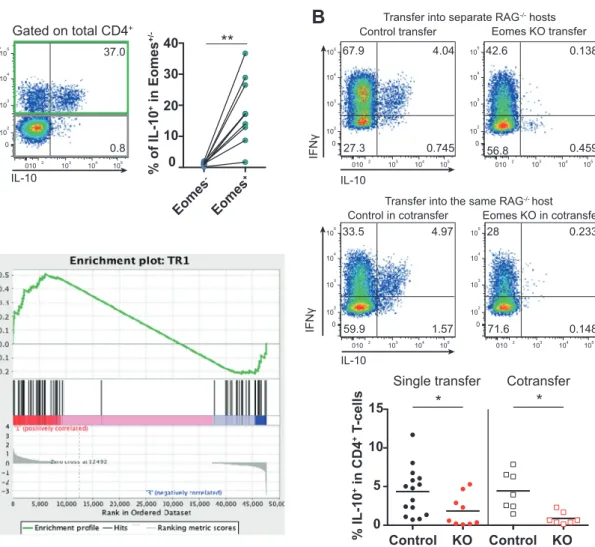
To further investigate pathways controlled by EOMES in TR1 cells, we performed KEGG pathway analysis. The top identified pathway map was “cytokine–cytokine receptor interaction,” followed by several pathways in which cyto-kines are of major importance (Supplementary Fig. 4A). This suggests that EOMES regulates cytokines and cytokine receptors in TR1 cells. Along this line, we identified among the upregulated genes in GFP+ cells that depend on the presence of EOMES, the TR1 signature cytokine Il10 (Fig. 2B and Supplementary Fig. 4B), which is in agree-ment with previous reports [2–4]. Transplantation of T cells into Rag2−/− mice confirmed that the majority of IL-10-producing CD4+ T cells co-express EOMES (Fig. 3A). Importantly, most IL-10-producing cells also co-expressed IFNγ (Fig. 3B), concordant with previously published TR1 descriptions [3,41]. IL-10/IFNγ co-expression was depen-dent on EOMES and not on non-cell autonomous factors within the microenvironment, as Eomes-deficient CD4+ T cells did not produce IL-10, regardless whether they were transferred alone or together with Eomes-proficient, CD4+ T cells (Fig.3B).
Finally, we performed gene set enrichment analysis, which showed that the identified EOMES-dependent tran-scripts in GFP+ cells (comparison 2) were enriched in a published human TR1 gene signature (Fig. 3C). Beyond underlining the similarity between human and mouse TR1 cells, these results confirm that a small subset of EOMES-dependent genes is crucial for TR1 cell identity.
Leukemia development in the Eµ-TCL1 mouse
model is associated with an accumulation of
cytotoxic T
R1 cells
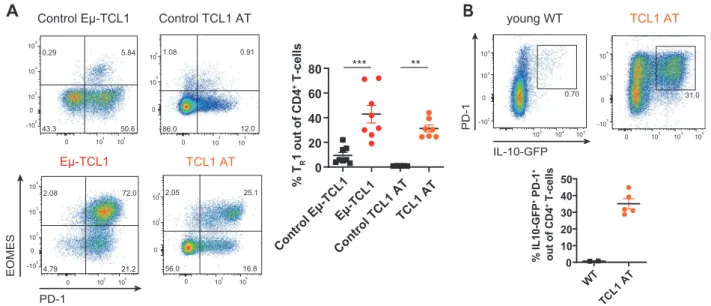
To explore the role of TR1 cells (defined as EOMES+PD-1+) in CLL, we first analyzed their presence in the Eµ-TCL1 (TCL1) mouse model of CLL. Comparing age- and sex-matched leukemic TCL1 mice and WT littermates revealed a higher abundance of TR1 cells in the spleen of TCL1 mice (Fig. 4A, gating strategy in Supplementary Fig. 5A). The majority of these EOMES+PD-1+cells also expressed LAG3 (Supplementary Fig. 5B), which we previously showed to be dependent on EOMES. To overcome long latency of CLL development in this mouse model, leukemic splenocytes of TCL1 mice were adoptively transferred into syngeneic WT
mice (TCL1 AT), as previously described [34,42,43]. Upon leukemia development in the TCL1 AT model, we observed an accumulation of antigen-experienced CD4+T cells (Sup-plementary Fig. 5C) that show signs of activation as measured by CD69 expression (Supplementary Fig. 5D). Moreover, a higher frequency of TR1 CD4+T cells was detected (Fig.4A), which showed a high co-expression rate of LAG3 (Supple-mentary Fig. 5B). Interestingly, the frequency of TR1 cells was higher in aging Eµ-TCL1 mice compared to the younger TCL1 AT mice (Fig.4A), which is in line with our previous observation that EOMES+CD4+T cells accumulate with age [28].
Functional investigation of TR1 cells in TCL1 AT mice confirmed the phenotype observed in CLL patients, with an induced IL-10 expression that increased over time (Fig.4B and Supplementary Fig. 5E), and higher levels of IFNγ, CD107a, and GzmB (Supplementary Fig. 5F, G), as mar-kers of cytotoxicity, in these cells. These data show that TR1 cells, which produce IL-10 and harbor cytotoxic potential, accumulate in mouse models of CLL.
To investigate the impact of this cell type on CLL pro-gression, we transferred CD4+ T cells into Rag2−/− mice, which lack mature B and T cells [44] to exclude the con-tribution of CD8+ T cells to leukemia control. Next, the mice were transplanted with TCL1 leukemia cells, as pre-viously described [34,42,43]. As reported before in other mouse models, we detected an expansion of CD4+T cells in Rag2−/−mice with and without transfer of leukemic cells (Supplementary Fig. 6A). Interestingly, CD4+T cells con-trolled leukemia progression, as indicated by lower spleen weight and leukemia cell content per spleen compared to mice without T-cell transfer (Supplementary Fig. 6B, C). Of interest, CD4+ T cells from spleens of leukemia-bearing Rag2−/− mice showed a higher frequency of TR1 cells (Supplementary Fig. 6D) in comparison to non-leukemic control mice, accompanied by a high co-expression of LAG3 on these cells (Supplementary Fig. 6E). The leu-kemic challenge of animals induced a higher proliferation rate of TR1 cells in comparison to non-diseased mice (Supplementary Fig. 6F). In contrast, the cytotoxic ability of TR1 cells was not changed upon development of TCL1 leukemia (Supplementary Fig. 6G, H).
Next, we clustered FOXP3− CD4+ T cells derived of mice with and without TCL1 AT based on their expression of EOMES, PD-1, LAG3, and KI-67 measured by flow cytometry using T-distributed Stochastic Neighbor Embedding (t-SNE) algorithm to infer if CLL development is changing the phenotype of this cell type. As expected based on prior analyses, TR1 cells clustered similar, regardless if mice were challenged with leukemic cells or not (Supplementary Fig. 6I), suggesting that TCL1 leuke-mia does not alter the phenotype of this cell type but rather induces its expansion.
In sum, the accumulation of cytotoxic TR1 cells advises to investigate their role in controlling CLL progression.
EOMES is indispensable for T
R1 cell-mediated
control of leukemia development in TCL1 AT mice
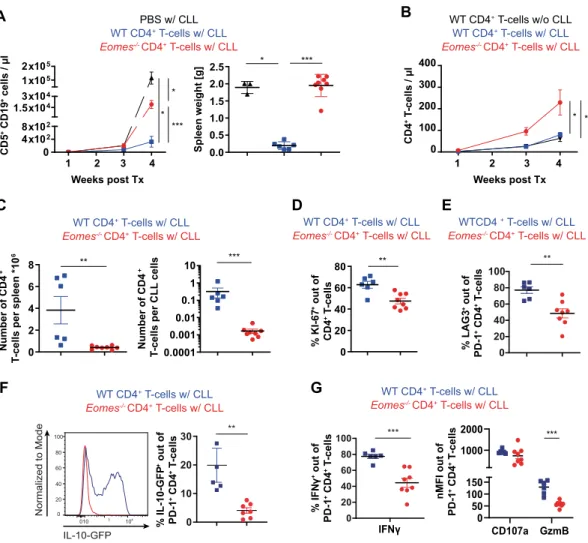
To analyze the role of TR1 cells in controlling CLL progres-sion, we utilized conditional Eomes knock-out (Eomes−/−) mice, as we have shown that EOMES is essential for the generation of functional TR1 cells, in concordance with pre-vious reports [2]. WT or Eomes−/− CD4+ T cells were transplanted into Rag2−/−mice followed by adoptive transfer of TCL1 leukemia cells. Analysis of CLL progression in thesemice showed that Eomes−/− CD4+ T cells failed to control CLL development as evidenced by higher numbers of CD5+ CD19+ CLL cells in blood and higher spleen weights (Fig. 5A). We further monitored CD4+ T-cell expansion in these mice over time and observed higher T-cell numbers in the blood of recipient mice of Eomes−/−CD4+T cells com-pared to WT T cells (Fig.5B). However, in the spleen of these animals, a lower absolute number of CD4+T cells per spleen and per CLL cell was noted in the Eomes−/−in comparison to the WT group (Fig.5C). In line with this, Eomes−/−T cells in the spleen showed a lower proliferation rate based on KI-67 staining compared to WT T cells (Fig. 5D), suggesting that EOMES is important for the expansion of TR1 cells. As our
A
IL-10 EOMES 0102 103 104 105 0 102 103 104 105 37.0 0.8 Gated on total CD4+ Eomes -Eomes + 0 10 20 30 40 %o fI L -1 0 +in Eomes +/-**
B
Transfer into the same RAG-/-host Transfer into separate RAG-/-hosts
IL-10 IL-10 Control transfer IFNγ Eomes KO transfer 0102 103 104 105 0 102 103 104 105 67.9 4.04 0.745 27.3 010 2 103 104 105 0 102 103 104 105 42.6 0.138 0.459 56.8
Control in cotransfer Eomes KO in cotransfer
0102 103 104 105 0 102 103 104 105 33.5 4.97 1.57 59.9 010 2 103 104 105 0 102 103 104 105 28 0.233 0.148 71.6 IFNγ 0 5 10 15 Control KO % IL-10 +in CD4 +T -cells
*
Single transfer*
Cotransfer Control KOC
Fig. 3 EOMES-expressing CD4+T cells express IL-10 and map with TR1 cells.Cells for analyses were prepared as described in Fig.2. ARepresentative dot plot and quantification of IL-10 production by splenic EOMES+and EOMES−CD4+T cells 3 weeks post transfer into Rag2−/−hosts as analyzed by intracellularflow cytometry after stimulation with PMA/ionomycin ex vivo. B Congenically labeled EOMES-proficient (Control) or EOMES-deficient (KO) CD4+T cells were transferred into separate, or the same Rag2−/−hosts, and 3 weeks later, splenocytes were analyzed by flow cytometry. Dot plots show representative expression of IL-10 and IFNγ. Quantification of
IL-10-producing CD4+ T cells in single transfer and co-transfer experiments is depicted at the bottom. C Gene set enrichment analysis plot showing that EOMES-dependent TR1 genes (comparison 2 in Fig. 2A) are enriched in human TR1 signature genes [3]. Each dot represents data of an individual mouse. Lines in (A) link data of EOMES−and EOMES+cells from the same mouse; lines in (B) show median. Statistical analysis was performed using Mann–Whitney test. Comparison of matched samples in co-transfer setting was performed using Wilcoxon matched-pairs signed rank test. *p < 0.05, **p < 0.01.
data showed an enrichment and higher activation state of TR1 cells in lymphoid organs of CLL patients, we subse-quently analyzed splenic T cells of these mice for TR1-related molecules. In line with the RNA-sequencing results, EOMES-deficiency resulted in a reduced expression of LAG3 in comparison to WT T cells (Fig.5E). Moreover, EOMES was indispensable for IL-10 production (Fig. 5F) and cytotoxic function, as we observed a lower expression of IFNγ, a slight reduction in CD107a, and a significantly lower production of GzmB in EOMES-deficient T cells (Fig.5G).
In summary, EOMES is important for the control of CLL progression in mice as it mediates expansion and cyto-toxicity of CD4+T cells.
IL-10R signaling maintains cytotoxic T
R1 cells and
allows them to control CLL
Ingenuity pathway analysis of Eomes-dependent genes indicated Il10 and Stat3 as the top potential upstream reg-ulators (Supplementary Table 7). In line, IL-10R signaling has been shown to be essential for TR1 function [45]. Therefore, we decided to investigate the role of IL-10R-mediated signaling in TR1 cells and its impact on control of TCL1 leukemia. Either Il10rb+/+(WT) or Il10rb−/−CD4+ T cells were injected into Rag2−/− mice followed by transplantation of TCL1 leukemia. Of interest, Il10rb-de fi-cient CD4+ T cells showed a reduced control of CLL as measured by higher CD5+ CD19+ CLL counts in blood
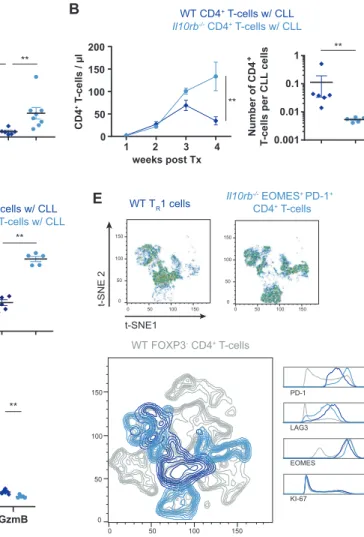
over time and by higher spleen weights 4 weeks after TCL1 AT in comparison to control mice receiving WT T cells (Fig. 6A). To evaluate whether a reduced expansion of Il10rb−/−CD4+T cells contributes to the diminished CLL control, T-cell counts were monitored in blood over time. Three and 4 weeks after transfer of leukemic cells, a higher number of Il10Rb−/−versus WT CD4+T cells was seen in blood (Fig. 6B). CD4+ T-cell counts in spleen showed a trend toward a higher number of Il10rb−/− CD4+ T cells compared to WT T cells per spleen (Supplementary Fig. 7A), which is likely a reflection of the bigger spleen sizes in the Il10rb−/−group, as the number of CD4+T cells per CLL cell was reduced in these mice in comparison to the WT group (Fig. 6B). Nevertheless, proliferation of CD4+ T cells, as measured by KI-67, did not differ sig-nificantly between the two groups (Fig. 6C). Hence, IL-10R-mediated signaling in CD4+T cells is required for their efficient control of CLL development which is not primarily due to an impact on T-cell expansion.
IL-10Rα signaling was shown to be dispensable for the differentiation of TR1 cells, but not for the function of this cell type [45]. Similarly, we investigated the relevance of Il10Rb for TR1 cells. As Il10rb−/−CD4+T cells showed a higher frequency of TR1 cells than WT T cells (Fig.6D), we clustered FOXP3− CD4+ T cells of WT and Il10Rb−/− origin based on their expression of EOMES, PD-1, LAG3, and KI-67 measured by flow cytometry using t-SNE algo-rithm for a comparative analysis. Intriguingly, EOMES+
A
2.08 72.0 21.2 4.79 0 103 104 0 -102 102 103 104 0.29 5.84 50.6 43.3 0 103 104 0 -102 102 103 104 Control Eμ-TCL1 Eμ-TCL1 PD-1 EOMES Control TCL1 AT TCL1 AT 1.08 0.91 12.0 86.0 0 10 3 10 4 0 10 3 104 2.05 25.1 16.8 56.0 0 10 3 10 4 0 103 104 0 20 40 60 80 Control Eμ-TCL1Eμ-TCL1 Control TCL1 AT TCL1 AT *** ** %T R 1 out of CD4 +T-cells TCL1 AT WT o u to fC D 4 +T-cells 0 10 20 30 40 50 % IL10-GF P +PD-1 + 0 103 104 105 0 -103 103 104 31.0 103 104 105 0 -103 103 104 0.70 IL-10-GFP PD-1 young WT TCL1 ATB
Fig. 4 PD-1+CD4+T cells that co-express EOMES are enriched in the Eµ-TCL1 mouse model of CLL. ASpleens of hemizygous Eµ-TCL1 leukemic mice and control littermates at a median age of 65 weeks, or animals after transplantation of Eµ-TCL1 leukemic cells into syngeneic wild type (WT) mice (TCL1 AT) were analyzed by flow cytometry. Representative dot plots and frequency of TR1 cells (EOMES+PD-1+) out of CD4+T cells in Eµ-TCL1 as well as TCL1 AT mice and their respective controls. B FIR × tiger mice were
transplanted with Eµ-TCL1 leukemic splenocytes and expression of IL-10-GFP in splenic PD-1+CD4+ T cells was analyzed by flow cytometry. Representative dot plots as well as percentage of IL-10-expressing cells out of CD4+T cells in WT versus TCL1 AT FIR × tiger mice. All graphs show mean ± SEM. Each dot represents data of an individual mouse. Statistical analysis was performed using Mann–Whitney test. **p < 0.01; ***p < 0.001.
PD-1+ CD4+ TR1-like cells of Il10Rb−/− origin clustered distinct of WT TR1 cells (Fig. 6E and Supplementary Fig. 7B), likely driven by a higher expression of PD-1. This suggests that IL-10R signaling is crucial for maintaining the TR1 cell phenotype. Thisfinding was further supported by a reduced cytotoxic function of Il10rb−/− EOMES+ PD-1+ CD4+ T cells in comparison to WT TR1 cells (Fig. 6F), arguing for a different phenotype of these cells arising upon IL-10R deficiency.
Taken together, our data suggests that EOMES is indis-pensable for the accumulation of cytotoxic TR1 cells, a cell type whose function depends on IL-10R signaling and that limits CLL progression.
Discussion
An altered frequency of CD4+ T-cell subsets in B-NHL patients is widely described [9,35,42,46], but their function and pathological relevance are not well understood [1]. Therefore, we aimed to elucidate the role of PD-1-expressing CD4+T cells in these malignancies. By analyz-ing blood samples of CLL and DLBCL patients, we observed a higher proportion of PD-1-expressing CD4+ T cells in both patient groups compared to HC thus con-firming published data [6–10]. Moreover, we noted that a subset of PD-1+ cells co-expressed EOMES, which has been observed for TR1 cells. Similar to PD-1-expressing D WT CD4+T-cells w/ CLL Eomes-/-CD4+T-cells w/ CLL 0 20 40 60 80 ** %K I-6 7 +out of CD4 +T -cells C WT CD4+T-cells w/ CLL Eomes-/-CD4+T-cells w/ CLL 0.0001 0.001 0.01 0.1 1 10 *** 0 2 4 6 8 ** Number of CD4 + T -cells per C LL cells Number of CD4 + T -cells per s pleen *10 6 A WT CD4+T-cells w/ CLL Eomes-/-CD4+T-cells w/ CLL PBS w/ CLL 0.0 0.5 1.0 1.5 2.0 2.5 *** Weeks post Tx 1 2 3 4 0 4x10² 8x10² 1.5x10⁴ 3x10⁴ 1x10⁵ 2x10⁵ *** * * Spleen weight [g] CD5 +CD19 +cells / μ l F WT CD4+T-cells w/ CLL Eomes-/-CD4+T-cells w/ CLL 0 10 20 30 ** 010 3 104 0 20 40 60 80 100 IL-10-GFP Normalized to Mode % IL-10-GFP +out of PD-1 +CD4 +T -cells G WT CD4+T-cells w/ CLL Eomes-/-CD4+T-cells w/ CLL CD107a GzmB 0 50 100 150 1000 2000 *** nMFI out of PD-1 +CD4 +T -cells 0 20 40 60 80 100 *** %I F N γ +out of PD-1 +CD4 +T -cells IFNγ E 0 20 40 60 80 100 ** WTCD4+T-cells w/ CLL Eomes-/-CD4+T-cells w/ CLL %L A G 3 +out of PD-1 +CD4 +T -cells B WT CD4+T-cells w/ CLL Eomes-/-CD4+T-cells w/ CLL WT CD4+T-cells w/o CLL 0 100 200 300 400 * * CD4 +T -cells / μ l Weeks post Tx 1 2 3 4 *
Fig. 5 EOMES is crucial for TR1 cell-mediated CLL control. Rag2−/−mice were transplanted i.v. with PBS or CD4+T cells of wild type (WT) or Eomes−/−origin on day -1 and the following day with leukemic splenocytes of Eµ-TCL1 mice. Blood and spleen samples were analyzed at indicated time points byflow cytometry. A Absolute numbers of CD5+CD19+CLL cells in peripheral blood are shown over time and spleen weights at endpoint, 4 weeks after transfer of leukemic cells. B Absolute numbers of CD4+T cells in peripheral blood are depicted over time. C Numbers of CD4+T cells per spleen, and numbers of CD4+T cells per CD5+CD19+CLL cell are shown. D Percentages of KI-67+ cells out of splenic CD4+ T cells.
E Percentages of LAG3+cells out of splenic PD-1+CD4+T cells. FExpression of IL-10-GFP out of splenic PD-1+CD4+T cells shown as representative histogram and quantification of data. G Splenocytes were stimulated ex vivo with PMA/ionomycin and cytokine expres-sion was analyzed by intracellular flow cytometry. Frequencies of IFNγ+cells out of PD-1+CD4+T cells, and nMFI of CD107a and GzmB of PD-1+CD4+T cells. All graphs show mean ± SEM. Each dot represents data of an individual mouse. Statistical analysis was performed using Mann–Whitney test. *p < 0.05; **p < 0.01; ***p < 0.001. Tx= transplantation, nMFI = normalized median fluorescence intensity.
CD8+T cells [34,36], TR1-like T cells were enriched in LN samples of CLL patients, the site of tight interactions between malignant B and T cells and of their proliferation [47,48], and showed a higher activity than respective cells in paired blood samples. We further observed that these cells harbor cytotoxic capacities, which is in line with published data shown for CD4+T cells in the blood of B-NHL patients [49–51]. Interestingly, these CD4+T cells have been shown to kill autologous B cells, regardless if they were derived from CLL patients or HC [49].
TR1 cells do not constitutively express FOXP3, produce the immunosuppressive cytokine IL-10, express co-inhibitory
receptors such as PD-1 or LAG3, and produce cytotoxic molecules [5]. EOMES has recently been shown to be of importance for the generation of TR1 cells [2,3] and to reg-ulate the expression of IL-10 in these cells [2,3, 52]. Fur-thermore, the importance of EOMES for the production of cytotoxic molecules of CD4+ T cells is well described [22,23,53]. Using RNA-sequencing and phenotypic analyses of T cells from mouse models, we confirmed an overlap of EOMES+ PD-1+ CD4+ T cells analyzed in our study with human TR1 cells, and proved that EOMES is involved in their generation and indispensable for their function. Of impor-tance, EOMES only controlled a small gene set, which was C Number of CD4 + T -cells p er CLL cells 0.001 0.01 0.1 1 ** A PBS WT CD4+T-cells w/ CLL Il10rb-/-CD4+T-cells w/ CLL 0 1 2 3 4 Spleen weight [g] * ** CD5 +CD19 +CLL c ells / μ l *** 1 2 3 4 0 5×10² 1×10³ 1.1×10⁴ 3×10⁴ 5×10⁴ weeks post Tx * * E 0 20 40 60 80 100 ** % E OMES +PD-1 + o u to fC D 4 +T -cells WT CD4+T-cells w/ CLL Il10rb-/-CD4+T-cells w/ CLL F t-SNE1 t-SNE 2 WT TR1 cells Il10rb -/-EOMES+PD-1+ CD4+T-cells 0 50 100 150 0 50 100 150 0 50 100 150 0 50 100 150 0 0 50 100 150 LAG3 KI-67 EOMES PD-1 WT FOXP3-CD4+T-cells WT CD4+T-cells w/ CLL Il10rb-/-CD4+T-cells w/ CLL 0 20 40 60 80 100 * % IFNγ + out o f Eomes +PD-1 +CD4 + T-c e ll s CD107a GzmB 0 500 1000 1500 2000 * ** nMFI out o f Eomes +PD-1 +CD4 +T -cells IFNγ D 0 20 40 60 80 100 WT CD4+T-cells w/ CLL Il10rb-/-CD4+T-cells w/ CLL KI-67 + outof CD4 +T -cells B 0 50 100 150 200 CD4 + T-c e ll s / μ l WT CD4+T-cells w/ CLL Il10rb-/-CD4+T-cells w/ CLL ** 1 weeks post Tx 2 3 4 50 100 150
Fig. 6 IL-10R signaling controls CLL development by maintaining functional TR1 cells. Rag2−/−mice were transplanted i.v. with PBS or CD4+T cells of wild type (WT) or Il10rb−/−origin on day -1 and the following day with leukemic splenocytes of Eµ-TCL1 mice. Blood and spleen samples were analyzed byflow cytometry. A Absolute numbers of CD5+CD19+CLL cells in peripheral blood are shown over time and spleen weights at endpoint, 4 weeks after transfer of leukemic cells. B Absolute numbers of CD4+T cells in peripheral blood are depicted over time, and numbers of CD4+T cells per CD5+CD19+ CLL cell are shown. C Percentage of KI-67+cells out of splenic CD4+ T cells. D Frequency of EOMES+PD-1+cells out of splenic CD4+ T cells. E t-SNE plots of concatenated, splenic WT TR1 cells and
Il10rb−/−EOMES+ PD-1+ CD4+T cells based onflow cytometry data for PD-1, EOMES, LAG3, and KI-67 expression (upper plots). Overlay of both cell types in dark and light blue with WT FOXP3− CD4+ T cells in gray (lower plot). F Splenocytes were stimulated ex vivo with PMA/ionomycin and cytokine expression was analyzed by intracellularflow cytometry. Frequencies of IFNγ+cells out of PD-1+CD4+T cells, and nMFI of CD107a and GzmB of PD-1+CD4+ T cells. All graphs show mean ± SEM. Each dot represents data of an individual mouse. Statistical analysis was performed using Mann–Whitney. *p < 0.05; **p < 0.01; ***p < 0.001. nMFI = nor-malized medianfluorescence intensity.
enriched in factors that were previously described for TR1 cells, such as IL-10, PD-1, and LAG3. Among those genes were also several integrins which might be involved in migration and homing of T cells, and therefore responsible for the higher number of EOMES-deficient compared to -profi-cient CD4+T cells remaining in the blood after their transfer in Rag2−/−mice with CLL.
Intriguingly, using mouse models of CLL, we showed that EOMES is essential for the CD4+ T cell-mediated control of CLL in Rag2−/− mice. In these mice, CD4+ T cells expanded and acquired cytotoxic activity, which is in line with similar results in mouse models of melanoma [54]. Since IL-10-driven signaling via p38 MAPK was shown to be important to maintain IL-10 production in TR1 cells [45], we investigated the role of IL-10R signaling in TR1 cells and the control of leukemia progression. Interest-ingly, Il10rb−/−CD4+T cells showed a reduced CLL control alongside with a high expression of PD-1 and EOMES, being distinct from that of WT TR1 cells. This increase in PD-1 and EOMES expression was accompanied by a reduction in IFNγ production, suggesting that IL-10R signaling is important to maintain a functional cytotoxic TR1 subset. This is in line with published results for CD8+ T cells, showing that over-expression of EOMES resulted in an increased over-expression of exhaustion molecules such as CD244, Havcr2, and Il10ra, implicating a role for IL-10-mediated signaling in regulating T-cell exhaustion [55]. Studies in infection models and from murine and human cancer showed that the expression level of PD-1 in CD8+ T cells determines their state of exhaustion and potential for reinvigoration by PD-1 blockade [56]. Along this line, we observed that IL-10-mediated signaling maintains a subset of CD8+T cells with intermediate PD-1 expression and high potential to control CLL in mice [57]. Together, this suggests that IL-10-mediated signals are important to maintain effector function not only in CD8+ T cells but also in TR1 cells.
Genome-wide association studies showed that single nucleotide polymorphisms (SNPs) in proximity of the EOMES gene are associated with a higher risk of CLL (rs9880772) [58, 59], DLBCL (rs6773363) [60], and Hodgkin’s Lymphoma (rs3806624) [61]. The higher like-lihood of B-NHL in individuals carrying these SNPs was thought to be caused by a deregulated immune function, which could at least partially be explained by the reduced control of CLL development, as seen in our study. Along-side, preclinical data in mouse models [62], and data of a phase 1 basket trial (NCT02009449) using pegylated IL-10 for treatment of solid cancer, demonstrated that IL-10 helps to maintain CD8+ T cell-mediated tumor control and improves patients’ responses to PD-1 blockade [63].
In summary, this report highlights the presence of cyto-toxic TR1 cells in LNs of CLL and DLBCL patients and in
the TCL1 mouse model of CLL. Our data in this animal model clearly show that EOMES-expressing CD4+T cells are crucial for disease control. We further demonstrate the importance IL-10-mediated signaling in maintaining TR1 cells, which mediate effector activity and thus control of leukemia.
Acknowledgements This study was supported by the German Research Foundation (DFG) project EV-RNA (SE 2331/2-1), the Eurostars project E!10865—LeukeMab (01QE1716) as part of the Horizon 2020 EU funding framework, and by the German José Car-reras Foundation (grant 13R/2018) to MS. PMR was supported by the German Cancer Aid grant number 112069 and has been funded by a fellowship of the DKFZ Clinician Scientist Program, supported by the Dieter Morszeck Foundation. EL and AI were supported by Bundes-ministerium für Bildung und Forschung (grant BMBF 01 EO 1303), and EL, FK, MK, and AI were supported by the Max Planck Society. SJA was supported by the German Research Foundation (AR 732/2-1, AR 732/3-1), project A03 of SFB 850 (project ID 89986987), and Germany’s Excellence Strategy (CIBSS—EXC-2189—Project ID 390939984). DC was supported by the Spanish Ministry of Economy and Competitiveness (SAF 15/31242R) and the Generalitat de Cata-lunya (2017 SGR 1009). SS was supported by DFG SFB1074 subproject B1. SD was supported by a grant of the Hairy Cell Leukemia Foundation, the Heidelberg Research Centre for Molecular Medicine (HRCMM), and an e:med BMBF junior group grant.
Author contributions PMR, LLC, and EL designed the study, per-formed experiments, analyzed and interpreted data, preparedfigures, and wrote the paper. TR, MB, CS, MK, LA, and ACG performed experiments. EL and FK performed bioinformatics analysis. LS, DC, SS, and SD provided clinical samples and information. SJA provided mice and advised the study. PL critically advised the study and reviewed the paper. AI and MS designed and supervised the study, interpreted data, and wrote the paper.
Funding Open Access funding enabled and organized by Projekt DEAL.
Compliance with ethical standards
Conflict of interest The authors declare that they have no conflict of interest.
Publisher’s note Springer Nature remains neutral with regard to jurisdictional claims in published maps and institutional affiliations. Open Access This article is licensed under a Creative Commons Attribution 4.0 International License, which permits use, sharing, adaptation, distribution and reproduction in any medium or format, as long as you give appropriate credit to the original author(s) and the source, provide a link to the Creative Commons license, and indicate if changes were made. The images or other third party material in this article are included in the article’s Creative Commons license, unless indicated otherwise in a credit line to the material. If material is not included in the article’s Creative Commons license and your intended use is not permitted by statutory regulation or exceeds the permitted use, you will need to obtain permission directly from the copyright holder. To view a copy of this license, visithttp://creativecommons. org/licenses/by/4.0/.
References
1. Roessner PM, Seiffert M. T-cells in chronic lymphocytic leukemia: guardians or drivers of disease? Leukemia. 2020;34:2012–24. 2. Zhang P, Lee JS, Gartlan KH, Schuster IS, Comerford I, Varelias
A, et al. Eomesodermin promotes the development of type 1 regulatory T (TR1) cells. Sci Immunol. 2017;2.
3. Gruarin P, Maglie S, De Simone M, Haringer B, Vasco C, Ran-zani V, et al. Eomesodermin controls a unique differentiation program in human IL-10 and IFN-gamma coproducing regulatory T cells. Eur J Immunol. 2019;49:96–111.
4. Brockmann L, Soukou S, Steglich B, Czarnewski P, Zhao L, Wende S, et al. Molecular and functional heterogeneity of IL-10-producing CD4(+) T cells. Nat Commun. 2018;9:5457. 5. Roncarolo MG, Gregori S, Bacchetta R, Battaglia M, Gagliani N.
The biology of T regulatory type 1 cells and their therapeutic application in immune-mediated diseases. Immunity. 2018;49:1004–19.
6. Brusa D, Serra S, Coscia M, Rossi D, D’Arena G, Laurenti L, et al. The PD-1/PD-L1 axis contributes to T-cell dysfunction in chronic lymphocytic leukemia. Haematologica. 2013;98:953–63. 7. Palma M, Gentilcore G, Heimersson K, Mozaffari F,
Nasman-Glaser B, Young E, et al. T cells in chronic lymphocytic leukemia display dysregulated expression of immune checkpoints and activation markers. Haematologica. 2017;102:562–72.
8. Riches JC, Davies JK, McClanahan F, Fatah R, Iqbal S, Agrawal S, et al. T cells from CLL patients exhibit features of T-cell exhaustion but retain capacity for cytokine production. Blood. 2013;121:1612–21.
9. Zhang L, Du H, Xiao TW, Liu JZ, Liu GZ, Wang JX, et al. Prognostic value of PD-1 and TIM-3 on CD3+ T cells from dif-fuse large B-cell lymphoma. Biomed Pharmacother. 2015;75:83–7. 10. Muenst S, Hoeller S, Willi N, Dirnhofera S, Tzankov A. Diag-nostic and progDiag-nostic utility of PD-1 in B cell lymphomas. Dis Markers. 2010;29:47–53.
11. McClanahan F, Hanna B, Miller S, Clear AJ, Lichter P, Gribben JG, et al. PD-L1 checkpoint blockade prevents immune dys-function and leukemia development in a mouse model of chronic lymphocytic leukemia. Blood. 2015;126:203–11.
12. Hanna BS, Yazdanparast H, Demerdash Y, Roessner PM, Schulz R, Lichter P, et al. Combining ibrutinib and checkpoint blockade improves CD8+ T-cell function and control of chronic lympho-cytic leukemia in Em-TCL1 mice. Haematologica. 2020; haematol.2019.238154.
13. Ding W, LaPlant BR, Call TG, Parikh SA, Leis JF, He R, et al. Pembrolizumab in patients with CLL and Richter transformation or with relapsed CLL. Blood. 2017;129:3419–27.
14. Fang X, Xiu B, Yang Z, Qiu W, Zhang L, Zhang S, et al. The expression and clinical relevance of PD-1, PD-L1, and TP63 in patients with diffuse large B-cell lymphoma. Medicine. 2017;96: e6398.
15. Ahearne MJ, Bhuller K, Hew R, Ibrahim H, Naresh K, Wagner SD. Expression of PD-1 (CD279) and FoxP3 in diffuse large B-cell lymphoma. Virchows Arch. 2014;465:351–8.
16. Zhang J, Medeiros LJ, Young KH. Cancer immunotherapy in diffuse large B-cell lymphoma. Front Oncol. 2018;8:351. 17. Naiche LA, Harrelson Z, Kelly RG, Papaioannou VE. T-box genes
in vertebrate development. Annu Rev Genet. 2005;39:219–39. 18. Cruz-Guilloty F, Pipkin ME, Djuretic IM, Levanon D, Lotem J,
Lichtenheld MG, et al. Runx3 and T-box proteins cooperate to establish the transcriptional program of effector CTLs. J Exp Med. 2009;206:51–9.
19. Pearce EL, Mullen AC, Martins GA, Krawczyk CM, Hutchins AS, Zediak VP, et al. Control of effector CD8+ T cell function by the transcription factor eomesodermin. Science. 2003;302:1041–3.
20. Intlekofer AM, Takemoto N, Wherry EJ, Longworth SA, Northrup JT, Palanivel VR, et al. Effector and memory CD8+ T cell fate coupled by T-bet and eomesodermin. Nat Immunol. 2005;6:1236–44.
21. Hegel JK, Knieke K, Kolar P, Reiner SL, Brunner-Weinzierl MC. CD152 (CTLA-4) regulates effector functions of CD8+ T lym-phocytes by repressing eomesodermin. Eur J Immunol. 2009;39:883–93.
22. Qui HZ, Hagymasi AT, Bandyopadhyay S, St Rose MC, Rama-narasimhaiah R, Menoret A, et al. CD134 plus CD137 dual costimulation induces eomesodermin in CD4 T cells to program cytotoxic Th1 differentiation. J Immunol. 2011;187:3555–64. 23. Curran MA, Geiger TL, Montalvo W, Kim M, Reiner SL,
Al-Shamkhani A, et al. Systemic 4-1BB activation induces a novel T cell phenotype driven by high expression of eomesodermin. J Exp Med. 2013;210:743–55.
24. Gordon SM, Chaix J, Rupp LJ, Wu J, Madera S, Sun JC, et al. The transcription factors T-bet and Eomes control key checkpoints of natural killer cell maturation. Immunity. 2012;36:55–67. 25. Banerjee A, Gordon SM, Intlekofer AM, Paley MA, Mooney EC,
Lindsten T, et al. Cutting edge: the transcription factor eomeso-dermin enables CD8+ T cells to compete for the memory cell niche. J Immunol. 2010;185:4988–92.
26. Paley MA, Kroy DC, Odorizzi PM, Johnnidis JB, Dolfi DV, Barnett BE, et al. Progenitor and terminal subsets of CD8+ T cells cooperate to contain chronic viral infection. Science. 2012;338:1220–5.
27. Llao Cid L, Hanna BS, Iskar M, Roessner PM, Ozturk S, Lichter P, et al. CD8(+) T-cells of CLL-bearing mice acquire a tran-scriptional program of T-cell activation and exhaustion. Leuk Lymphoma. 2020;61:351–6.
28. Lupar E, Brack M, Garnier L, Laffont S, Rauch KS, Schachtrup K, et al. Eomesodermin expression in CD4+ T cells restricts peripheral Foxp3 induction. J Immunol. 2015;195:4742–52. 29. Suto A, Wurster AL, Reiner SL, Grusby MJ. IL-21 inhibits
IFN-gamma production in developing Th1 cells through the repression of eomesodermin expression. J Immunol. 2006;177:3721–7. 30. Steiner DF, Thomas MF, Hu JK, Yang Z, Babiarz JE, Allen CD,
et al. MicroRNA-29 regulates T-box transcription factors and interferon-gamma production in helper T cells. Immunity. 2011;35:169–81.
31. Yang Y, Xu J, Niu Y, Bromberg JS, Ding Y. T-bet and eome-sodermin play critical roles in directing T cell differentiation to Th1 versus Th17. J Immunol. 2008;181:8700–10.
32. Mazzoni A, Maggi L, Siracusa F, Ramazzotti M, Rossi MC, Santarlasci V, et al. Eomes controls the development of Th17-derived (non-classic) Th1 cells during chronic inflammation. Eur J Immunol. 2019;49:79–95.
33. Catovsky D, Miliani E, Okos A, Galton DA. Clinical significance of T-cells in chronic lymphocytic leukaemia. Lancet. 1974;2:751–2.
34. Hanna BS, Roessner PM, Yazdanparast H, Colomer D, Campo E, Kugler S, et al. Control of chronic lymphocytic leukemia devel-opment by clonally-expanded CD8(+) T-cells that undergo functional exhaustion in secondary lymphoid tissues. Leukemia. 2019;33:625–37.
35. Roessner PM, Hanna BS, Ozturk S, Schulz R, Llao Cid L, Yaz-danparast H, et al. TBET-expressing Th1 CD4(+) T cells accu-mulate in chronic lymphocytic leukaemia without affecting disease progression in Emicro-TCL1 mice. Br J Haematol. 2020;189:133–45.
36. de Weerdt I, Hofland T, de Boer R, Dobber JA, Dubois J, van Nieuwenhuize D, et al. Distinct immune composition in lymph node and peripheral blood of CLL patients is reshaped during venetoclax treatment. Blood Adv. 2019;3:2642–52.
37. Arnold SJ, Sugnaseelan J, Groszer M, Srinivas S, Robertson EJ. Generation and analysis of a mouse line harboring GFP in the Eomes/Tbr2 locus. Genes. 2009;47:775–81.
38. Arnold SJ, Hofmann UK, Bikoff EK, Robertson EJ. Pivotal roles for eomesodermin during axis formation, epithelium-to-mesenchyme transition and endoderm specification in the mouse. Development. 2008;135:501–11.
39. Khan O, Giles JR, McDonald S, Manne S, Ngiow SF, Patel KP, et al. TOX transcriptionally and epigenetically programs CD8(+) T cell exhaustion. Nature. 2019;571:211–8.
40. Scott AC, Dundar F, Zumbo P, Chandran SS, Klebanoff CA, Shakiba M, et al. TOX is a critical regulator of tumour-specific T cell differentiation. Nature. 2019;571:270–4.
41. Trinchieri G. Regulatory role of T cells producing both interferon gamma and interleukin 10 in persistent infection. J Exp Med. 2001;194:F53–7.
42. Hanna BS, Roessner PM, Scheffold A, Jebaraj BMC, Demerdash Y, Ozturk S, et al. PI3Kdelta inhibition modulates regulatory and effector T-cell differentiation and function in chronic lymphocytic leukemia. Leukemia. 2019;33:1427–38.
43. Ozturk S, Roessner PM, Schulze-Edinghausen L, Yazdanparast H, Kalter V, Lichter P, et al. Rejection of adoptively transferred Emicro-TCL1 chronic lymphocytic leukemia cells in C57BL/ 6 substrains or knockout mouse lines. Leukemia. 2019;33:1514–39.
44. Shinkai Y, Rathbun G, Lam KP, Oltz EM, Stewart V, Mendelsohn M, et al. RAG-2-deficient mice lack mature lymphocytes owing to inability to initiate V(D)J rearrangement. Cell. 1992;68:855–67. 45. Brockmann L, Gagliani N, Steglich B, Giannou AD, Kempski J,
Pelczar P, et al. IL-10 receptor signaling is essential for TR1 cell function in vivo. J Immunol. 2017;198:1130–41.
46. Bagnara D, Kaufman MS, Calissano C, Marsilio S, Patten PE, Simone R, et al. A novel adoptive transfer model of chronic lymphocytic leukemia suggests a key role for T lymphocytes in the disease. Blood. 2011;117:5463–72.
47. Herishanu Y, Perez-Galan P, Liu D, Biancotto A, Pittaluga S, Vire B, et al. The lymph node microenvironment promotes B-cell receptor signaling, NF-kappaB activation, and tumor proliferation in chronic lymphocytic leukemia. Blood. 2011;117:563–74. 48. Mempel TR, Henrickson SE, Von Andrian UH. T-cell priming by
dendritic cells in lymph nodes occurs in three distinct phases. Nature. 2004;427:154–9.
49. Lindqvist CA, Christiansson LH, Thorn I, Mangsbo S, Paul-Wetterberg G, Sundstrom C, et al. Both CD4+ FoxP3+ and CD4 + FoxP3- T cells from patients with B-cell malignancy express cytolytic markers and kill autologous leukaemic B cells in vitro. Immunology. 2011;133:296–306.
50. Porakishvili N, Roschupkina T, Kalber T, Jewell AP, Patterson K, Yong K, et al. Expansion of CD4+ T cells with a cytotoxic phenotype in patients with B-chronic lymphocytic leukaemia (B-CLL). Clin Exp Immunol. 2001;126:29–36.
51. Yang ZZ, Kim HJ, Villasboas JC, Chen YP, Price-Troska T, Jalali S, et al. Expression of LAG-3 defines exhaustion of intratumoral PD-1(+) T cells and correlates with poor outcome in follicular lymphoma. Oncotarget. 2017;8:61425–39.
52. Reiser J, Sadashivaiah K, Furusawa A, Banerjee A, Singh N. Eomesodermin driven IL-10 production in effector CD8(+) T cells promotes a memory phenotype. Cell Immunol. 2019;335:93–102.
53. Patil VS, Madrigal A, Schmiedel BJ, Clarke J, O’Rourke P, de Silva AD, et al. Precursors of human CD4(+) cytotoxic T lym-phocytes identified by single-cell transcriptome analysis. Sci Immunol. 2018;3.
54. Quezada SA, Simpson TR, Peggs KS, Merghoub T, Vider J, Fan X, et al. Tumor-reactive CD4(+) T cells develop cytotoxic activity and eradicate large established melanoma after transfer into lymphopenic hosts. J Exp Med. 2010;207:637–50.
55. Li J, He Y, Hao J, Ni L, Dong C. High levels of eomes promote exhaustion of anti-tumor CD8(+) T cells. Front Immunol. 2018;9:2981.
56. Im SJ, Hashimoto M, Gerner MY, Lee J, Kissick HT, Burger MC, et al. Defining CD8+ T cells that provide the proliferative burst after PD-1 therapy. Nature. 2016;537:417–21.
57. Hanna BS, Rossner PM, Iskar M, Mack N, Kalter V, Schmidt M, et al. IL-10 receptor deficiency aggravates exhaustion of CD8(+) T-cells and impedes their control of chronic lymphocytic leuke-mia. Blood. 2017;130:385.
58. Berndt SI, Camp NJ, Skibola CF, Vijai J, Wang Z, Gu J, et al. Meta-analysis of genome-wide association studies discovers multiple loci for chronic lymphocytic leukemia. Nat Commun. 2016;7:10933.
59. Law PJ, Sud A, Mitchell JS, Henrion M, Orlando G, Lenive O, et al. Genome-wide association analysis of chronic lymphocytic leukaemia, Hodgkin lymphoma and multiple myeloma identifies pleiotropic risk loci. Sci Rep. 2017;7:41071.
60. Kleinstern G, Yan H, Hildebrandt MAT, Vijai J, Berndt SI, Ghesquieres H, et al. Inherited variants at 3q13.33 and 3p24.1 are associated with risk of diffuse large B-cell lymphoma and impli-cate immune pathways. Hum Mol Genet. 2020;29:70–9. 61. Frampton M, da Silva Filho MI, Broderick P, Thomsen H, Forsti
A, Vijayakrishnan J, et al. Variation at 3p24.1 and 6q23.3 in flu-ences the risk of Hodgkin’s lymphoma. Nat Commun. 2013;4:2549.
62. Mumm JB, Emmerich J, Zhang X, Chan I, Wu L, Mauze S, et al. IL-10 elicits IFNgamma-dependent tumor immune surveillance. Cancer Cell. 2011;20:781–96.
63. Naing A, Infante JR, Papadopoulos KP, Chan IH, Shen C, Ratti NP, et al. PEGylated IL-10 (pegilodecakin) induces systemic immune activation, CD8(+) T cell invigoration and polyclonal T cell expansion in cancer patients. Cancer Cell. 2018;34:775–91.e3.
Affiliations
Philipp M. Roessner 1●Laura Llaó Cid1,2●Ekaterina Lupar3,11 ●Tobias Roider 4●Marie Bordas1,2●
Christoph Schifflers 1,12,13●Lavinia Arseni1●Ann-Christin Gaupel1●Fabian Kilpert3,14●Marit Krötschel3,15●
Sebastian J. Arnold 5,6●Leopold Sellner 4●Dolors Colomer 7●Stephan Stilgenbauer8●Sascha Dietrich4●
Peter Lichter 1●Ana Izcue 3,9,10●Martina Seiffert 1
1 Division of Molecular Genetics, German Cancer Research Center (DKFZ), Heidelberg, Germany
2 Faculty of Biosciences, University of Heidelberg, Heidelberg, Germany
3 Max-Planck-Institute of Immunobiology and Epigenetics, Freiburg, Germany
4 Department of Medicine V, Hematology, Oncology and Rheumatology, University of Heidelberg, Heidelberg, Germany 5 Institute of Experimental and Clinical Pharmacology and
Toxicology, Faculty of Medicine, University of Freiburg, Freiburg, Germany
6 Signalling Research Centres BIOSS and CIBSS, University of Freiburg, Freiburg, Germany
7 Institut d’Investigacions Biomèdiques August Pi i Sunyer (IDIBAPS), Hematopathology Unit, Hospital Clinic, CIBERONC, Barcelona, Spain
8 Department of Internal Medicine III, University of Ulm, Ulm, Germany
9 Center for Chronic Immunodeficiency, University Medical Center Freiburg and University of Freiburg, Freiburg, Germany 10 Institute of Molecular Medicine, University Hospital RWTH
Aachen, Aachen, Germany
11 Present address: Cellzome, Heidelberg, Germany
12 Present address: Cell Biology Research Unit (URBC)—Namur Research Institute of Life Science (Narilis), University of Namur, Namur, Belgium
13 Present address: Immunotherapy and Immunoprevention, German Cancer Research Center (DKFZ), Heidelberg, Germany 14 Present address: Essen University Hospital, Institute of Human
Genetics, Genome Informatics, Essen, Germany