RESEARCH OUTPUTS / RÉSULTATS DE RECHERCHE
Author(s) - Auteur(s) :
Publication date - Date de publication :
Permanent link - Permalien :
Rights / License - Licence de droit d’auteur :
Institutional Repository - Research Portal
Dépôt Institutionnel - Portail de la Recherche
researchportal.unamur.be
University of Namur
PPAR Agonist-Induced Reduction of Mcp1 in Atherosclerotic Plaques of Obese,
Insulin-Resistant Mice Depends on Adiponectin-Induced Irak3 Expression
Hulsmans, M.; Geeraert, B.; Arnould, T.; Tsatsanis, C.; Holvoet, P.
Published in:
PLoS ONE
DOI:
10.1371/journal.pone.0062253
Publication date:
2013
Document Version
Publisher's PDF, also known as Version of record
Link to publication
Citation for pulished version (HARVARD):
Hulsmans, M, Geeraert, B, Arnould, T, Tsatsanis, C & Holvoet, P 2013, 'PPAR Agonist-Induced Reduction of
Mcp1 in Atherosclerotic Plaques of Obese, Insulin-Resistant Mice Depends on Adiponectin-Induced Irak3
Expression', PLoS ONE, vol. 8, no. 4. https://doi.org/10.1371/journal.pone.0062253
General rights
Copyright and moral rights for the publications made accessible in the public portal are retained by the authors and/or other copyright owners and it is a condition of accessing publications that users recognise and abide by the legal requirements associated with these rights. • Users may download and print one copy of any publication from the public portal for the purpose of private study or research. • You may not further distribute the material or use it for any profit-making activity or commercial gain
• You may freely distribute the URL identifying the publication in the public portal ?
Take down policy
If you believe that this document breaches copyright please contact us providing details, and we will remove access to the work immediately and investigate your claim.
Atherosclerotic Plaques of Obese, Insulin-Resistant Mice
Depends on Adiponectin-Induced Irak3 Expression
Maarten Hulsmans1., Benjamine Geeraert1., Thierry Arnould2, Christos Tsatsanis3, Paul Holvoet1* 1 Atherosclerosis and Metabolism Unit, Department of Cardiovascular Sciences, KU Leuven, Leuven, Belgium, 2 Laboratory of Biochemistry and Cell Biology (URBC), NAmur Research Institute for LIfe Sciences (NARILIS), University of Namur (FUNDP), Namur, Belgium, 3 Department of Clinical Chemistry, School of Medicine, University of Crete, Heraklion, Greece
Abstract
Synthetic peroxisome proliferator-activated receptor (PPAR) agonists are used to treat dyslipidemia and insulin resistance. In this study, we examined molecular mechanisms that explain differential effects of a PPARa agonist (fenofibrate) and a PPARc agonist (rosiglitazone) on macrophages during obesity-induced atherogenesis. Twelve-week-old mice with combined leptin and LDL-receptor deficiency (DKO) were treated with fenofibrate, rosiglitazone or placebo for 12 weeks. Only rosiglitazone improved adipocyte function, restored insulin sensitivity, and inhibited atherosclerosis by decreasing lipid-loaded macrophages. In addition, it increased interleukin-1 receptor-associated kinase-3 (Irak3) and decreased monocyte chemoattractant protein-1 (Mcp1) expressions, indicative of a switch from M1 to M2 macrophages. The differences between fenofibrate and rosiglitazone were independent of Pparc expression. In bone marrow-derived macrophages (BMDM), we identified the rosiglitazone-associated increase in adiponectin as cause of the increase in Irak3. Interestingly, the deletion of Irak3 in BMDM (IRAK32/2 BMDM) resulted in activation of the canonical NFkB signaling pathway and increased Mcp1
protein secretion. Rosiglitazone could not decrease the elevated Mcp1 secretion in IRAK32/2BMDM directly and fenofibrate
even increased the secretion, possibly due to increased mitochondrial reactive oxygen species production. Furthermore, aortic extracts of high-fat insulin-resistant LDL-receptor deficient mice, with lower adiponectin and Irak3 and higher Mcp1, showed accelerated atherosclerosis. In aggregate, our results emphasize an interaction between PPAR agonist-mediated increase in adiponectin and macrophage-associated Irak3 in the protection against atherosclerosis by PPAR agonists.
Citation: Hulsmans M, Geeraert B, Arnould T, Tsatsanis C, Holvoet P (2013) PPAR Agonist-Induced Reduction of Mcp1 in Atherosclerotic Plaques of Obese, Insulin-Resistant Mice Depends on Adiponectin-Induced Irak3 Expression. PLoS ONE 8(4): e62253. doi:10.1371/journal.pone.0062253
Editor: Andrea Cignarella, University of Padova, Italy
Received November 20, 2012; Accepted March 19, 2013; Published April 19, 2013
Copyright: ! 2013 Hulsmans et al. This is an open-access article distributed under the terms of the Creative Commons Attribution License, which permits unrestricted use, distribution, and reproduction in any medium, provided the original author and source are credited.
Funding: Funding was provided by the Fonds voor Wetenschappelijk Onderzoek-Vlaanderen (G.0548.08, G0846.11, and Vascular Biology Network), and by Interdisciplinair Ontwikkelingsfonds - Kennisplatform (KP/12/009). M. Hulsmans is a postdoctoral fellow of the Fonds voor Wetenschappelijk Onderzoek-Vlaanderen. The funders had no role in study design, data collection and analysis, decision to publish, or preparation of the manuscript.
Competing Interests: The authors have declared that no competing interests exist. * E-mail: [email protected]
. These authors contributed equally to this work.
Introduction
Low-grade chronic inflammation is associated with obesity and obesity-induced metabolic disorders such as insulin resistance, type 2 diabetes, the metabolic syndrome and atherosclerosis [1,2]. The recruitment of monocytes and differentiation and polarization to classically activated pro-inflammatory M1 macrophages instead of anti-inflammatory M2 macrophages, have been causally linked to the development of adipose tissue dysfunction, the metabolic syndrome and atherosclerosis [3]. The monocyte chemoattractant protein-1 (Mcp1, also known as chemokine (C-C motif) ligand-2, Ccl2), a marker of M1 macrophages, increases macrophage infiltration, inflammation and insulin resistance in transgenic mice. Conversely, disruption of Mcp1 or its receptor Ccr2 impairs migration of macrophages thereby lowering adipose tissue in-flammation and improving insulin sensitivity [4]. It is also recognized that maladaptive production of various adipocytokines (e.g. adiponectin, resistin, visfatin, and leptin) and pro-inflamma-tory cytokines, such as tumor necrosis factor-a (TNFa) and interleukin (IL)-6, are implicated in the development of
obesity-related systemic inflammation and insulin resistance. In particular, the blood levels of adiponectin are significantly lower in obese individuals and have been associated with metabolic inflamma-tion, insulin resistance and the development of cardiovascular disease [5]. The protective effect of adiponectin has mainly been attributed to its anti-inflammatory action [6]. Interestingly, interleukin-1 receptor-associated kinase-3 (IRAK3; also referred to as IRAK-M), a kinase deficient member of the IRAK family and an important negative regulator of toll-like receptor/nuclear factor kB (NFkB) signaling [7,8], is a major mediator of globular adiponectin-induced endotoxin tolerance in macrophages [9]. Recently, we showed that decreased expression of IRAK3 in monocytes of obese patients is associated with a high prevalence of metabolic syndrome; weight loss results in an increase in IRAK3 that is associated with decreased systemic inflammation [10].
Several clinical trials support the use of peroxisome proliferator-activated receptor (PPAR) agonists to treat dyslipidemia and insulin resistance in obesity and type 2 diabetes. PPARa agonists such as fenofibrate regulate lipoprotein metabolism [11]. PPARc agonists such as rosiglitazone reduce blood glucose levels in
patients with type 2 diabetes [12]. Recent data also suggest critical roles of PPAR agonists in inhibiting vascular inflammation and atherosclerosis [13–15]. However, it remains to be determined if molecular mechanisms that confer their vascular protection are identical for PPARa and PPARc agonists.
In the present study, we aimed to analyze the consequences of PPARa and PPARc agonist treatment on macrophage activation in relation to atherogenesis using mice with combined leptin (Ob/ Ob) and LDL-receptor deficiency (double knockout [DKO] mice). These mice are characterized by morbid obesity, dyslipidemia, glucose intolerance and insulin resistance, and accelerated atherosclerosis [16,17]. Atherosclerotic lesions cover 20% of total area of the thoracic abdominal aorta in double-mutant mice compared with 3.5% in LDL-receptor deficient mice. Ob/Ob mice have no detectable lesions. Higher macrophage homing is detected prior to increase in plaque volumes in the aortic root of DKO mice [16]. In intra-abdominal adipose tissues of DKO mice, Pparc expression is lower than in LDL-receptor deficient and Ob/ Ob mice, and Ppara expression is lower than in LDL-receptor deficient mice. Weight loss increases Ppara and Pparc, associated with a decrease in atherosclerosis [17]. Because DKO mice, in contrast to single KO mice, are characterized by decreases in Ppara and Pparc and accelerated atherosclerosis, we selected DKO mice to investigate the effect of fenofibrate and rosiglita-zone. We found that rosiglitazone treatment in contrast to fenofibrate increases systemic adiponectin levels and Irak3 expression, resulting in decreased expression of Mcp1 in athero-sclerotic plaques. Moreover, the presence of Irak3 in macrophages is necessary for the indirect Mcp1-reducing effects of PPAR agonists. Because defective leptin signaling was found to modulate inflammation and atherosclerosis [18], we also studied the relation between low adiponectin (Adipoq) and Irak3 expression in aortic extracts of high-fat and insulin resistant LDL-receptor deficient mice characterized by high plasma leptin levels.
Materials and Methods
Experimental Protocol of Animal Studies
Animal experiments conformed to the Guide for the Care and Use of Laboratory Animals published by the US National Institutes of Health. They were approved by the Institutional Animal Care and Research Advisory Committee of the KU Leuven (Permit Number: P087/2007). Breeding and genotyping of DKO mice, on the C57BL/6 J background, were performed as previously described [16,17]. Figure 1 shows a schematic diagram of the experimental protocol. For comparison, age- and gender-matched lean C57BL/6 J mice (n = 12) were used. Fenofibrate and rosiglitazone (Avandia) were purchased from Sigma-Aldrich and GlaxoSmithKline. DKO mice were treated with fenofibrate (n = 14), rosiglitazone (n = 13) or placebo (n = 26) for 12 weeks starting at the age of 12 weeks. Fenofibrate (50 mg kg21 day21) and rosiglitazone (10 mg kg21day21) were added to standard diet (SD) containing 4% fat (Ssniff), placebo-treated mice received the grinded chow only. Food and water were available ad libitum. Food intake of the DKO mice was<5.7 g/day and was not affected by the treatments. LDL-receptor deficient mice, on the C57BL/6 J background, were fed ad libitum for a period of 12 weeks starting at the age of 12 weeks with SD (n = 32) or with a high-fat diet (HFD) containing 45% fat (n = 9). Food intake was 50% of that of DKO mice, and was not different between SD- and HFD-fed mice. All mice were sacrificed by Nembutal overdose at the age of 24 weeks.
Blood Values
After an overnight fast, blood was collected by puncturing the vena cava. Plasma was obtained by centrifugation. Total cholesterol and triglycerides were measured using standard enzymatic colorimetric assays (Boehringer Mannheim). Glucose was mea-sured with a glucometer (Menarini Diagnostics) and plasma insulin with a mouse insulin enzyme-linked immunosorbent assay (ELISA) (Mercodia). To convert from mg/dL to mM, we divided glucose by 18 ( = molecular weight), triglycerides by 89 and total cholesterol by 39. Insulin resistance was calculated by a homeo-stasis model assessment of insulin resistance (HOMA-IR) = fasting plasma insulin (mU/L) x fasting blood glucose (mM)/22.5. To determine glucose tolerance, glucose was measured in samples obtained by tail bleeding before and 15, 30, 60, 120 and 240 minutes after intraperitoneal administration of glucose (20% glucose solution; 2 g/kg). Plasma adiponectin, TNFa and IL6 were measured with specific mouse ELISAs (R&D Systems) [19,20].
Histological Analysis of Visceral Adipose Tissue and Atherosclerosis
Tenmm-thick paraffin sections of adipose tissue were stained for macrophages with an antibody against mouse Mac-3 antigen (Pharmingen). Blinded analysis was performed on 12 fields of 3 sections from different levels (every 0.1 mm) of the visceral adipose depot for each individual mouse with the Quantimet600 image analyzer (Leica) and a light microscope with 206 magnification. Adipocyte size was determined as the mean adipocyte area calculated by dividing the total adipocyte area by the total number
Figure 1. Experimental protocol. Twelve-week old DKO mice were treated for 12 weeks with fenofibrate (50 mg kg21 day21) or with rosiglitazone (10 mg kg21day21) and were compared with
placebo-treated DKO and C57BL/6 J background mice. LDL-receptor deficient (LDLR2/2) mice, on the C57BL/6 J background, were fed for a period of 12 weeks with standard diet (SD) or with a high-fat diet (HFD). The mice were sacrificed at 24 weeks and total blood, the aortic arch, the abdominal aorta, and visceral adipose tissue were collected.
of adipocytes for each mouse. The number of nuclei of Mac-3-positive cells was averaged over 12 different fields, which were most enriched with macrophages, and expressed as ratio to the number of adipocytes. Dead/dying adipocytes were identified by the presence of crown-like structures (CLS). CLS density was
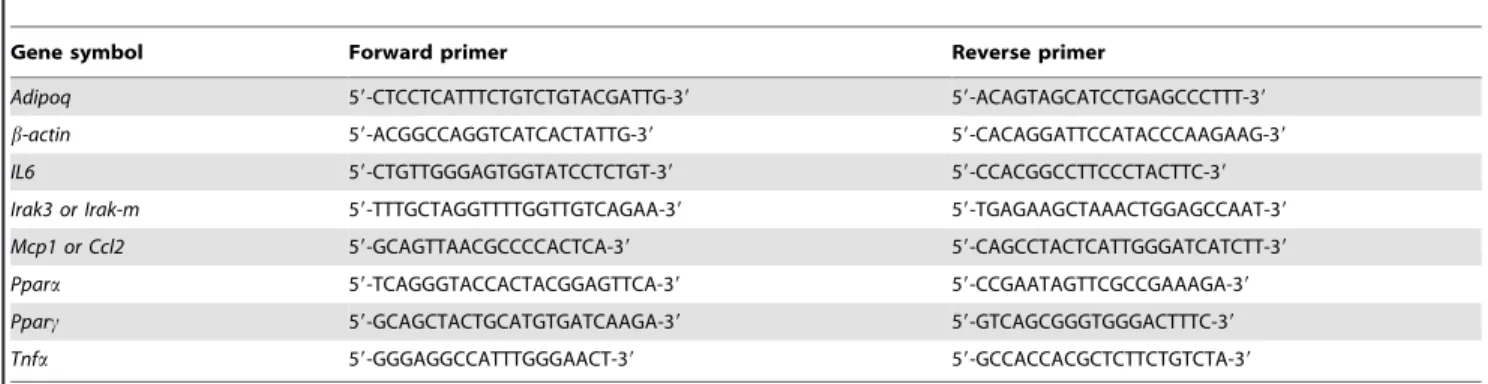
obtained by counting the number of CLS in each section and expressed as ratio to the number of adipocytes. Preparation of sections of the aortic valves, determination of the extent of atherosclerosis, and lipid (oil red O) and macrophage (Mac-3 Table 1. Primers used for qRT-PCR analysis.
Gene symbol Forward primer Reverse primer
Adipoq 59-CTCCTCATTTCTGTCTGTACGATTG-39 59-ACAGTAGCATCCTGAGCCCTTT-39 b-actin 59-ACGGCCAGGTCATCACTATTG-39 59-CACAGGATTCCATACCCAAGAAG-39 IL6 59-CTGTTGGGAGTGGTATCCTCTGT-39 59-CCACGGCCTTCCCTACTTC-39 Irak3 or Irak-m 59-TTTGCTAGGTTTTGGTTGTCAGAA-39 59-TGAGAAGCTAAACTGGAGCCAAT-39 Mcp1 or Ccl2 59-GCAGTTAACGCCCCACTCA-39 59-CAGCCTACTCATTGGGATCATCTT-39 Ppara 59-TCAGGGTACCACTACGGAGTTCA-39 59-CCGAATAGTTCGCCGAAAGA-39 Pparc 59-GCAGCTACTGCATGTGATCAAGA-39 59-GTCAGCGGGTGGGACTTTC-39 Tnfa 59-GGGAGGCCATTTGGGAACT-39 59-GCCACCACGCTCTTCTGTCTA-39
doi:10.1371/journal.pone.0062253.t001
Table 2. Blood, adipose tissue and plaque variables.
C57BL/6 J DKO ANOVA
Placebo Fenofibrate Rosiglitazone
A. Weight and blood variables
Weight (g) 28.161.0 61.860.8*** 58.761.1***/$ 54.961.0***/$$$/£ P,0.001 Total cholesterol (mM) 1.160.1 13.460.8*** 13.761.0*** 16.661.2***/$ P,0.001 Triglycerides (mM) 0.3060.24 3.160.3*** 2.460.3*** 1.960.3***/$ P,0.001 Glucose (mM) 4.260.2 8.260.5*** 7.060.5*** 4.960.3*/$$$/££ P,0.001 Insulin (mU/L) 74.364.4 213.3624.7*** 106.365.9***/$$$ 67.1616.3$$$ P,0.001 HOMA-IR 14.261.0 90.1615.1*** 31.262.2***/$$ 15.864.5$$$/£ P,0.001 AUC of IPGTT 35.160.4 87.664.9*** 74.864.2*** 50.861.2***/$$$/£££ P,0.001 TNFa (pg/mL) 22.461.2 29.761.9** 29.661.0*** 24.761.3$/££ P,0.01 IL6 (pg/mL) 17.960.6 29.362.4*** 21.162.3$ 14.661.7$$$/£ P,0.001 Adiponectin (mg/mL) 5.460.6 2.960.4** 1.160.2***/$$$ 16.260.7***/$$$/£££ P,0.001
B. Adipose tissue variables
Adipocyte size (x 103mm3) 2.160.2 7.960.2*** 8.160.2*** 6.460.4***/$$/££ P,0.001 Macrophages/adipocyte 2.860.5 219.7610.8*** 122.5615.3***/$$$ 49.963.0***/$$$/£££ P,0.001 CLS (%) 0.0860.03 10.961.1*** 5.961.3***/$$ 1.360.2***/$$$/££ P,0.001 C. Plaque variables Plaque volume (x 1023mm3) ND 93.965.4 114.6610.1 60.3614.2$/££ P,0.01
Plaque macrophages (% of plaque area) ND 28.562.2 22.561.3$ 11.661.2$$$/£££ P,0.001
Plaque lipids (% of plaque area) ND 30.361.4 28.461.2 24.361.2$$/£ P,0.05
Data are means 6 SEM. *P,0.05,
**P,0.01 and
***P,0.001 DKO compared with C57BL/6 J mice;
$
P,0.05,
$$
P,0.01 and
$$$
P,0.001 PPAR agonist-treated compared with placebo-treated DKO mice;
£P,0.05, ££P,0.01 and £££
P,0.001 rosiglitazone-treated compared with fenofibrate-treated DKO mice. Abbreviations: CLS, crown-like structures; ND, not detectable.
antibody) stainings were performed according to previously described protocols [19,20].
Cell Culture
Bone marrow cells were isolated from 24-weeks-old C57BL/6 J, DKO and IRAK32/2 mice. IRAK32/2 mice were kindly provided by Dr. Flavell (Yale University) [8]. After euthanasia, the mice were sprayed with 70% ethanol and the femurs were
dissected. Muscles connected to the bone were removed using clean gauze, and the femurs were placed into a Petri dish containing sterile PBS on ice. Both epiphyses were removed using sterile scissors and the bones were flushed with a syringe with DMEM containing 10% FBS (Gibco) to extrude bone marrow. Single cell suspensions were prepared by passing the cells through a 70-mm cell strainer. Cells were washed and incubated in erythrocyte-lysis buffer (Miltenyi) for 10 minutes, according to the
Figure 2. Rosiglitazone and not fenofibrate treatment reduces macrophage accumulation and improves adiponectin expression in visceral adipose tissue. (A) Representative Mac-3 staining of visceral adipose tissue of placebo-, fenofibrate- and rosiglitazone-treated DKO mice at 24 weeks. (B) Relative RNA levels of Tnfa, IL6, Mcp1 and Adipoq as determined by qRT-PCR. Data are means 6 SEM. Scale bar = 100mm. *P,0.05 and ***P,0.001 DKO compared with C57BL/6 J mice; $$P,0.01 and $$$P,0.001 PPAR agonist-treated compared with placebo-treated DKO mice;
££P,0.01 and£££P,0.001 rosiglitazone-treated compared with fenofibrate-treated DKO mice.
manufacturer’s instructions. These fresh bone marrow cells were differentiated to bone marrow-derived macrophages (BMDM) [21], using L929 cell conditioned medium (LCCM) as a source of granulocyte/macrophage colony stimulating factor [22]. The cells derived from one femur were resuspended in 25 mL bone marrow differentiation media, which is DMEM supplemented with 20% FBS, 30% LCCM, 100 U/mL penicillin, 100 mg/mL streptomy-cin, and 2 mM L-glutamine (Gibco). Cells were seeded in non-tissue culture-treated 150 mm Petri dishes and incubated at 37uC in a 5% CO2 atmosphere. Six days after seeding the cells, the
attached cells were washed and incubated overnight under normal growth conditions. Then, cells were incubated with 50mM fenofibrate, 10mM rosiglitazone, 5 mM GW9662 (Sigma-Aldrich) and 1 or 10mg/mL murine globular adiponectin (PeproTech) for 24 hours. Cell viability, as determined by trypan blue exclusion, was .80%.
RNA Extraction and Gene Expression Analysis
Total RNA was extracted with TRIzol reagent (Invitrogen) and purified on RNeasy Mini kit columns (Qiagen). First-strand cDNA was generated from total RNA with the SuperScript VILO cDNA synthesis kit (Invitrogen). Quantitative real-time PCR (qRT-PCR) was performed using Fast SYBRGreen master mix according to the supplier’s protocol (Applied Biosystems). Oligonucleotides (Invitrogen) used as forward and reverse primers were designed using the Primer Express software (Applied Biosystems) and are summarized in Table 1. Data were normalized to the housekeep-ing gene b-actin as previously described [20].
Western Blotting
Western blot analysis was performed with 20mg of total protein. Protein was electrophoresed through a 10–20% SDS-polyacryl-amide gel (Bio-Rad) and transferred to a polyvinylidene difluoride membrane (Millipore). Membranes were processed according to standard Western blotting procedures. To detect protein levels, membranes were incubated with primary antibodies against b-actin (Cell Signaling Technology) and Irak3 (Rockland Immuno-chemicals). The membranes were then incubated with horseradish peroxidase-coupled secondary antibody (Santa Cruz Biotechnol-ogy) and developed with SuperSignal chemiluminescent substrate
(Pierce). A PC-based image analysis program was used to quantify the intensity of each band (Bio-1D).
Soluble Mcp1 Cytokine Levels
Conditioned medium was harvested after treatment of BMDM and stored at 280uC. Soluble Mcp1 protein levels in the conditioned medium were determined by ELISA according to the manufacturer’s instructions (R&D Systems).
NFkB p50 DNA Binding Activity
NFkB p50 DNA binding activity was assessed on isolated nuclear extracts of BMDM by ELISA using the TransAM NFkB p50 transcription factor assay kit according to the manufacturer’s protocol (Active Motif). Briefly, 10mg of nuclear extract diluted in complete lysis buffer was used in the p50 binding assay. The samples were shaken for 1 hour at room temperature in 30mL binding buffer. After washing, anti-p50 antibody diluted 1:1000 was applied to the wells for 1 hour at room temperature. Specific binding was estimated by spectrophotometry after incubation with a horseradish peroxidaseconjugated antibody (1 hour at room temperature, 1:1000 diluted) at 450 nm wave length.
Mitochondrial Reactive Oxygen Species Detection
To detect mitochondrial reactive oxygen species (mROS) formation in treated BMDM, measurements of MitoSOX Red (Invitrogen) fluorescence were performed by flow cytometry (Becton, Dickinson and Company). Cells were incubated with PBS containing 5mM MitoSOX for 10 minutes at 37uC and 5% CO2. The labeled cells were washed twice with PBS and then
suspended in warm PBS for analysis by flow cytometry.
Statistical Analysis
The Kruskal-Wallis nonparametric one-way ANOVA, followed by the Dunn’s multiple comparisons test was used to compare more than two independent samples. The unpaired t-test with Welch’s correction test was used for the two-sample comparisons (Graph Pad Prism version 5). Correlations were calculated using the nonparametric Spearman’s correlation coefficient (rs).
Non-parametric tests were used because Gaussian distribution cannot be expected in small sample size studies as performed in this article. The area under the curve of the intraperitoneal glucose tolerance test (AUC of IPGTT) was calculated in Graph Pad Prism version 5. A probability value of P,0.05 was considered statistically significant.
Results
Rosiglitazone in Contrast to Fenofibrate Decreases Systemic Inflammation and Restores Insulin Sensitivity
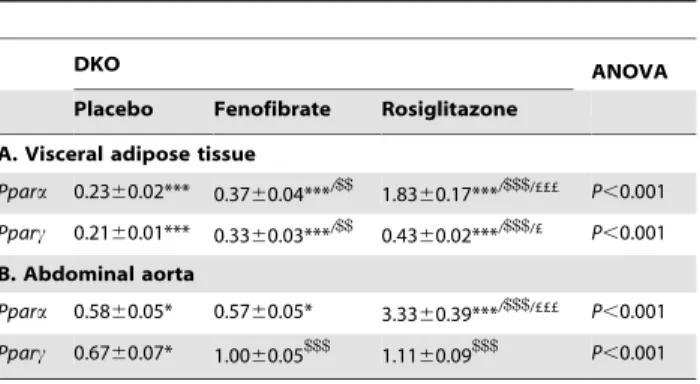
Body weight, plasma total cholesterol and triglycerides were significantly higher in placebo-treated DKO mice compared with lean C57BL/6 J background mice. Glucose and insulin levels, and thus the HOMA-IR index were similarly elevated. Glucose tolerance as measured by AUC of IPGTT was increased. The higher levels of TNFa and IL6, and the lower adiponectin levels indicated systemic inflammation (Table 2A). Both fenofibrate and rosiglitazone decreased weight and insulin levels. Interestingly, only rosiglitazone treatment reduced glucose levels resulting in a decrease in HOMA-IR and a partial normalization of glucose tolerance. Systemic inflammation was only decreased after rosiglitazone treatment evidenced by lower levels of TNFa and IL6 and increased adiponectin levels. Both treatments had almost no effect on total cholesterol and triglycerides (Table 2A). Table 3. Ppara and Pparc expressions in visceral adipose and
aortic tissues of PPAR agonist-treated DKO mice.
DKO ANOVA
Placebo Fenofibrate Rosiglitazone
A. Visceral adipose tissue Ppara 0.2360.02*** 0.3760.04***/$$ 1.8360.17***/$$$/£££ P,0.001 Pparc 0.2160.01*** 0.3360.03***/$$ 0.4360.02***/$$$/£ P,0.001 B. Abdominal aorta Ppara 0.5860.05* 0.5760.05* 3.3360.39***/$$$/£££ P,0.001 Pparc 0.6760.07* 1.0060.05$$$ 1.1160.09$$$ P,0.001
Data are means 6 SEM. *P,0.05 and
***P,0.001 DKO compared with C57BL/6 J mice;
$$
P,0.01 and
$$$
P,0.001 PPAR agonist-treated compared with placebo-treated DKO mice;
£P,0.05 and
£££P,0.001 rosiglitazone-treated compared with fenofibrate-treated DKO mice.
Rosiglitazone and not Fenofibrate Improves Adipocyte Function by Decreasing Macrophage Accumulation
Figure 2A shows representative sections of visceral adipose tissue stained for macrophages of placebo-, fenofibrate-, and rosiglitazone-treated DKO mice. The adipocyte size, number of macrophages and CLS, which indicates necrotic adipocytes surrounded by phagocytes, were increased in DKO mice compared with lean C57BL/6 J mice (Table 2B). Only
zone decreased the adipocyte size. Both treatments, but rosiglita-zone more than fenofibrate, reduced the number of macrophages and CLS in adipose tissue of DKO mice (Table 2B and Figure 2A). Furthermore, rosiglitazone decreased Tnfa, IL6 and Mcp1 expres-sions, and increased the expression of Adipoq (Figure 2B). Rosiglitazone treatment also resulted in a greater increase in Ppara than fenofibrate treatment; differences in Pparc were less pronounced (Table 3A).
Figure 3. Rosiglitazone and not fenofibrate treatment decreases atherogenesis in obese, insulin resistant mice. (A) Representative Mac-3 staining of aortic sinus plaques of placebo-, fenofibrate- and rosiglitazone-treated DKO mice at 24 weeks. (B) Gene expression in the aorta was analyzed by measuring relative RNA levels using qRT-PCR for Tnfa, IL6, Mcp1 and Irak3. Data are means 6 SEM. Scale bar = 500mm. *P,0.05, **P,0.01 and ***P,0.001 DKO compared with C57BL/6 J mice;$$P,0.01 and$$$P,0.001 PPAR agonist-treated compared with placebo-treated DKO mice;
£
P,0.05,££P,0.01 and£££P,0.001 rosiglitazone-treated compared with fenofibrate-treated DKO mice. doi:10.1371/journal.pone.0062253.g003
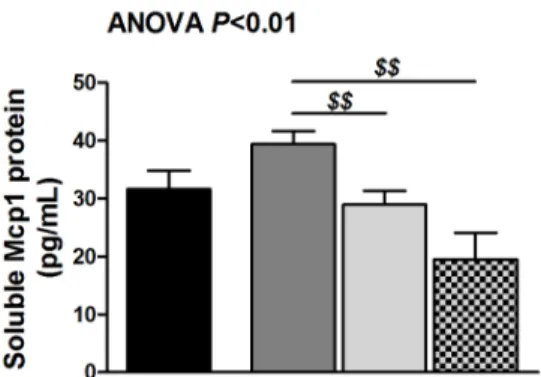
Figure 4. Adiponectin-induced Irak3 plays an important role in rosiglitazone-mediated decrease of Mcp1. (A) Soluble Mcp1 protein levels in DKO BMDM exposed to 50mM fenofibrate, 10 mM rosiglitazone or 5 mM GW9662 for 24 hours as determined by ELISA. Data are means 6 SEM; n = 16 from three different mice.$$P,0.01 compared with fenofibrate-treated BMDM. (B) Irak3 RNA and protein levels of DKO BMDM exposed to 1 or 10mg/mL globular adiponectin for 24 hours as determined by qRT-PCR and Western blotting. Data are means 6 SEM; n = 6. ***P,0.001 compared with DKO BMDM;$P,0.05 and$$P,0.01 compared with DKO BMDM exposed to 1mg/mL globular adiponectin. (C) Soluble Mcp1 protein
Rosiglitazone and not Fenofibrate Reduces
Atherosclerotic Plaque Volume and Macrophage Content by Decreasing Macrophage Accumulation
Figure 3A shows representative sections of atherosclerotic lesions stained for macrophages of placebo-, fenofibrate-, and rosiglitazone-treated DKO mice. Fenofibrate had no effect on overall plaque volume. In contrast, rosiglitazone decreased plaque volume by inhibiting macrophage and lipid deposition (Table 2C). In addition, rosiglitazone treatment decreased Tnfa, IL6 and Mcp1 expressions in extracts of abdominal aorta. Furthermore, Irak3 expression was increased after rosiglitazone treatment (Figure 3B). Irak3 in the aorta correlated positively with circulating adiponectin levels (rs= 0.41, P,0.01) and negatively with Tnfa (rs= 20.43,
P,0.01), IL6 (rs= 20.35, P,0.05) and Mcp1 (rs= 20.46,
P,0.001). The expression of Adipoq in aortic extracts, 2.1-fold decreased in DKO compared with C57BL/6 J mice (P,0.01), increased more after rosiglitazone treatment (1.8-fold vs. DKO,
P,0.01; 1.4-fold vs. fenofibrate treatment, P,0.05) than fenofi-brate treatment (1.2-fold vs. DKO, P,0.05). Rosiglitazone treatment also resulted in a greater increase in Ppara than fenofibrate treatment; differences in Pparc were not significant (Table 3B).
Irak3 Induction Dependent on High Adiponectin is Required for the Decreased Expression of Mcp1 after Rosiglitazone Treatment
We investigated the direct effect of fenofibrate, rosiglitazone, and PPARc antagonist (GW9662) treatment on BMDM from DKO mice to elucidate the observed differences between PPAR treatments. Fenofibrate tended to increase Mcp1 protein. Rosiglitazone did not decrease Mcp1 protein and addition of the PPARc antagonist did not increase Mcp1 protein. In aggregate, we did not observe a direct inhibitory effect of PPAR agonists on
levels (n = 18 from three different mice), NFkB p50 DNA binding activity (n = 8 from two different mice) and mROS production (n = 6) in IRAK32/2 BMDM exposed to 50mM fenofibrate or 10 mM rosiglitazone for 24 hours as determined by ELISA and flow cytometry. Data are means 6 SEM. *P,0.05, **P,0.01 and ***P,0.001 compared with C57BL/6 J BMDM; $P,0.05 and $$$P,0.001 compared with IRAK32/2 BMDM; £££P,0.001 compared with fenofibrate-treated BMDM. Abbreviations: BMDM, bone marrow-derived macrophages; mROS, mitochondrial reactive oxygen species. doi:10.1371/journal.pone.0062253.g004
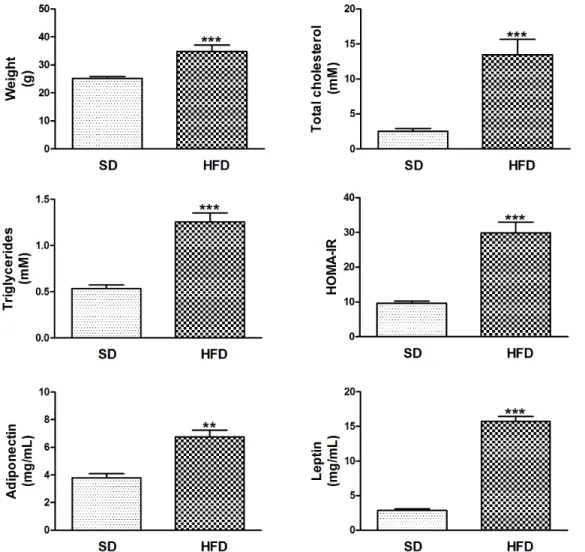
Figure 5. HFD-induced weight gain is associated with dyslipidemia, insulin resistance and hyperleptinemia in the presence of high blood adiponectin. Data are means 6 SEM. **P,0.01 and ***P,0.001 HFD-fed compared with SD-fed LDL-receptor deficient mice. Abbreviations: HFD, high fat diet; SD, standard diet.
Mcp1 protein secretion (average Mcp1 concentration in DKO BMDM: 31.861.6 pg/mL) (Figure 4A).
However, we have previously shown that there is a causal relation between variable globular adiponectin levels and IRAK3 expression in blood monocytes of obese patients [10]. Because we found that rosiglitazone increased adiponectin more than fenofi-brate, we determined the effect of low (as in untreated and fenofibrate-treated DKO mice) and high (as in rosiglitazone-treated DKO mice) globular adiponectin concentrations on the Irak3 expression in BMDM. Indeed, exposure to 10mg/mL globular adiponectin increased the Irak3 expression (RNA and protein) in comparison with exposure to 1mg/mL globular adiponectin (Figure 4B).
Then, we investigated if Irak3 deletion had an effect on Mcp1 expression. The deletion of Irak3 in BMDM (IRAK32/2BMDM) was characterized by activation of the canonical NFkB signaling pathway as determined by NFkB p50 DNA binding activity. This resulted in a 2.2-fold increase in Mcp1 protein secretion compared with control cells (185.5624.5 vs. 84.567.3 pg/mL, P,0.001). Rosiglitazone treatment did not decrease the elevated Mcp1 secretion in IRAK32/2BMDM and fenofibrate even increased the production of Mcp1, independently from NFkB p50 DNA
binding activity. However, the observed increase in Mcp1 after fenofibrate treatment was associated with increased mROS production (Figure 4C).
Lower Adipoq and Irak3 Expressions are Associated with M1 Macrophages and Accelerated Atherosclerosis in High-fat Insulin Resistant Mice
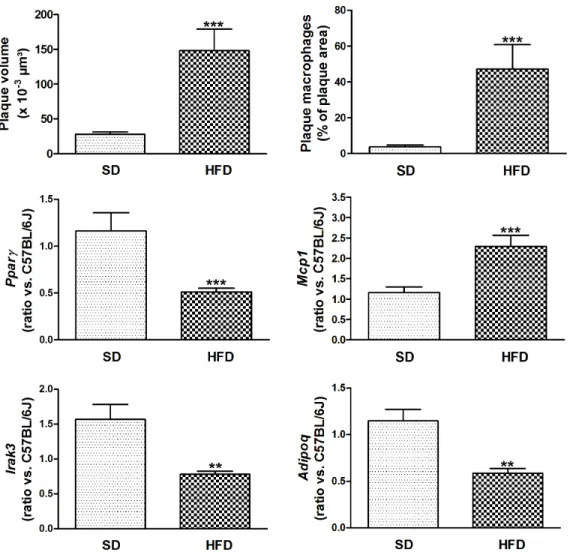
Body weight, plasma total cholesterol and triglycerides were significantly higher in HFD-fed LDL-receptor deficient mice compared with SD-fed mice, with C57BL/6 J background. Glucose tolerance, as measured by AUC of IPGTT and HOMA-IR index was elevated. In contrast to DKO, HFD-fed LDL-receptor deficient mice had increased blood levels of adiponectin. In addition, their leptin levels were elevated (Figure 5). Figure 6 shows accelerated atherosclerosis in aortic arch of high-fat insulin resistant mice, due to increased macrophage content. Aortic Pparc, Adipoq and Irak3 expressions were decreased, whereas Mcp1 expression was increased. Ppara expression was not significantly decreased in aorta of HFD-fed mice (data not shown). Increased aortic inflammation in HFD-fed mice was further evidenced by a 1.6-fold increase in Tnfa (P,0.01) and a 7.2-fold increase in IL6 (P,0.001).
Figure 6. HFD increases atherogenesis in insulin resistant mice. Plaque volume was determined by measuring lipid (oil red O)-stained surfaces in subsequent sections; macrophages were stained with anti-Mac-3 antibody. Gene expression in the aorta was analyzed by measuring relative RNA levels using qRT-PCR for Pparc, Mcp1, Irak3 and Adipoq. Data are means 6 SEM. **P,0.01 and ***P,0.001 HFD-fed compared with SD-fed LDL-receptor deficient mice. Abbreviations: HFD, high fat diet; SD, standard diet.
Discussion
Previous studies have shown that treatment with PPAR agonists could prevent vascular inflammation, atherosclerosis and the development of cardiovascular disease [23–25]. In the present study, we showed that rosiglitazone, a PPARc agonist, could reduce obesity-induced systemic inflammation, insulin resistance, macrophage accumulation and atherosclerotic plaque formation. In contrast, treatment with fenofibrate, a PPARa agonist, did not reduce systemic inflammation or plaque formation.
PPARc agonists not only increase peripheral insulin sensitivity but also cause dramatic decreases in systemic inflammation. In obese diabetic patients, rosiglitazone has been shown to decrease circulating C-reactive protein and IL6 levels [26,27]. Rosiglita-zone, but not fenofibrate, also increased adiponectin in our DKO mice. Previously, we demonstrated a relation between adiponectin and Pparc in the heart, insulin sensitivity, and cardiac function, independent of cholesterol and triglycerides [28]. PPARc increases adiponectin through a PPAR-responsive element in the nectin promoter in adipocytes [29,30]. The increase in adipo-nectin may explain the more pronounced increase in Ppara expression in adipose and aortic tissues [31,32]. Our study also confirmed that adiponectin is essential for the indirect vascular protective effect of rosiglitazone [33–35] at least partially through upregulation of Irak3 in plaque macrophages. Indeed, we observed that high levels of adiponectin increases the expression of Irak3 in BMDM, which at its turn is necessary for the indirect vascular protective effect of rosiglitazone on macrophages as evidenced by the elevated Mcp1 protein secretion in IRAK32/2 BMDM in vitro. Several recent studies have demonstrated that IRAK3 regulates critical aspects of innate immunity, including the development of endotoxin tolerance after adiponectin exposure. Adiponectin induces IRAK3 expression through ERK1/2 and PI3K/Akt signaling cascades [9]. Furthermore, IRAK3 is an important regulator by which tumor-associated macrophages mimic the phenotype of alternatively activated (M2) macrophages [36]. IRAK3 also attenuates post-infarction remodeling by protecting the heart from uncontrolled inflammation and excessive
matrix degradation [37]. A surprising finding was that aortic expression of Irak3 in HFD-fed insulin resistant mice was observed in association with increased blood levels of adiponectin. But aortic Adipoq expression was decreased in association with lower Pparc expression, suggesting that local expression in macrophages is more relevant than systemic expression by adipose tissues. This is in agreement with the observation that rosiglitazone inhibited monocyte/macrophage adhesion through de novo adiponectin production in human monocytes [38]. Also, HFD-fed mice had elevated levels of leptin that together with high insulin induces inflammation [39,40]. Previously, it has been suggested that PPARc guarantees a balanced and adequate production of secretion from adipose tissue of adipocytokines such as adiponectin and leptin, which are important mediators of insulin action in peripheral tissues [41]. Our data in HFD-fed mice indicate that imbalanced production does not necessarily imply high leptin and low adiponectin. Elevated leptin, even in presence of high adiponectin, is sufficient to generate an inflammatory response.
Similar to PPARc agonists, PPARa agonists, like fenofibrate, have also demonstrated anti-inflammatory properties in addition to their other beneficial effects on metabolism [15,42]. However, in our study, fenofibrate treatment had no effect on systemic inflammatory markers, and did not increase adiponectin levels and Irak3 expression and did not decrease the expression of Mcp1. In addition, exposure of IRAK32/2BMDM to fenofibrate resulted in an increased secretion of Mcp1 protein in vitro. The different Mcp1 secretion after rosiglitazone and fenofibrate treatment is independent of activation of the canonical NFkB signaling pathway but is possibly due to the increased ROS production observed after fenofibrate treatment. Indeed, it has been suggested that ROS production is involved in the regulation of Mcp1 expression [43]. However, we have to take into account that a mouse model is not the best model to evaluate PPARa selective compounds for their anti-atherosclerotic efficacy because in humans fenofibrate also influences lipid metabolism through modulation of cholesteryl ester transfer protein [44]. In diet-fed hamsters, the anti-atherosclerotic efficacy of fenofibrate occurred primarily via reductions in pro-atherogenic lipoproteins. However,
Figure 7. Adiponectin and macrophage-associated Irak3 are indispensable molecules in the anti-atherosclerotic properties of PPAR agonists. The schematic draw demonstrates the anti-atherosclerotic properties of the PPARc agonist rosiglitazone. Treatment with rosiglitazone improves the adipocyte function characterized by a decrease in adipocyte size, a reduction in adipose tissue macrophages and an increased expression of anti-inflammatory adiponectin. The increase in blood adiponectin and de novo adiponectin production in atherosclerotic lesions is necessary for the upregulation of Irak3 in plaque macrophages, which is crucial for the indirect rosiglitazone-mediated decrease in Mcp1 secretion. Abbreviations: Mw, macrophages; ROS, reactive oxygen species.
these hamsters were not obese and did not display insulin resistance [45]. Furthermore, the dosages of fenofibrate and rosiglitazone were approximately 2 and 6 times higher than the maximum recommended daily dose in humans. However, in this study, fenofibrate and rosiglitazone were used as experimental tools to identify underlying mechanisms that could apply to patients treated with the drug. Finally, our data are in agreement with previous data of Duez et al. showing that fenofibrate did not reduce atherosclerotic lesion area in the aortic sinus of ApoE deficient mice [46]. However, they found a reduction of cholesterol content in descending aortas of treated mice, an effect that was more pronounced in older mice exhibiting more advanced lesions. Unfortunately, in our study we did not measure cholesterol levels in the descending aorta. Interestingly, fenofibrate reduced lesions in the aortic sinus of ApoE deficient mice overexpressing human apolipoprotein-A1 [46].
Conclusions
In summary, we found that rosiglitazone in contrast to fenofibrate improves insulin sensitivity and adiponectin levels
and inhibits inflammation and atherosclerotic plaque formation by reducing M1 macrophage accumulation in the vascular wall. In addition, the adiponectin-dependent upregulation of Irak3 in macrophages is necessary for the reduction in Mcp1 secretion, and thus switch from M1 to M2. HFD-induced increase in leptin causes inflammation associated with decreased Irak3 expression in association with accelerated atherosclerosis, even in presence of high blood levels of adiponectin but decreased plaque expression of Adipoq. In summary, we showed that Irak3 as an inhibitor of NFkB and ROS production is required for the protective action of particularly the PPARc agonist (Figure 7).
Acknowledgments
We thank Roxane Menten for excellent technical assistance.
Author Contributions
Conceived and designed the experiments: MH BG PH. Performed the experiments: MH BG. Analyzed the data: MH BG PH. Contributed reagents/materials/analysis tools: TA CT. Wrote the paper: MH BG PH.
References
1. Hotamisligil GS (2006) Inflammation and metabolic disorders. Nature 444: 860– 867.
2. Hulsmans M, Holvoet P (2010) The vicious circle between oxidative stress and inflammation in atherosclerosis. J.Cell Mol.Med. 14: 70–78.
3. Weisberg SP, McCann D, Desai M, Rosenbaum M, Leibel RL, et al. (2003) Obesity is associated with macrophage accumulation in adipose tissue. J.Clin.Invest 112: 1796–1808.
4. Odegaard JI, Ricardo-Gonzalez RR, Goforth MH, Morel CR, Subramanian V, et al. (2007) Macrophage-specific PPARgamma controls alternative activation and improves insulin resistance. Nature 447: 1116–1120.
5. Kadowaki T, Yamauchi T, Kubota N, Hara K, Ueki K, et al. (2006) Adiponectin and adiponectin receptors in insulin resistance, diabetes, and the metabolic syndrome. J.Clin.Invest 116: 1784–1792.
6. Yang WS, Lee WJ, Funahashi T, Tanaka S, Matsuzawa Y, et al. (2001) Weight reduction increases plasma levels of an adipose-derived anti-inflammatory protein, adiponectin. J.Clin.Endocrinol.Metab 86: 3815–3819.
7. Wesche H, Gao X, Li X, Kirschning CJ, Stark GR, et al. (1999) IRAK-M is a novel member of the Pelle/interleukin-1 receptor-associated kinase (IRAK) family. Journal of Biological Chemistry 274: 19403–19410.
8. Kobayashi K, Hernandez LD, Galan JE, Janeway CA Jr, Medzhitov R, et al. (2002) IRAK-M is a negative regulator of Toll-like receptor signaling. Cell 110: 191–202.
9. Zacharioudaki V, Androulidaki A, Arranz A, Vrentzos G, Margioris AN, et al. (2009) Adiponectin promotes endotoxin tolerance in macrophages by inducing IRAK-M expression. Journal of Immunology 182: 6444–6451.
10. Hulsmans M, Geeraert B, De Keyzer D, Mertens A, Lannoo M, et al. (2012) Interleukin-1 receptor-associated kinase-3 is a key inhibitor of inflammation in obesity and metabolic syndrome. PLoS.ONE. 7: e30414.
11. Staels B, Dallongeville J, Auwerx J, Schoonjans K, Leitersdorf E, et al. (1998) Mechanism of action of fibrates on lipid and lipoprotein metabolism. Circulation 98: 2088–2093.
12. Phillips LS, Grunberger G, Miller E, Patwardhan R, Rappaport EB, et al. (2001) Once- and twice-daily dosing with rosiglitazone improves glycemic control in patients with type 2 diabetes. Diabetes Care 24: 308–315.
13. Zhang LL, Gao CY, Fang CQ, Wang YJ, Gao D, et al. (2011) PPAR{gamma} attenuates intimal hyperplasia through inhibiting TLR4-mediated inflammation in vascular smooth muscle cells. Cardiovascular Research 92: 484–493. 14. Kadoglou NP, Iliadis F, Angelopoulou N, Perrea D, Liapis CD, et al. (2008)
Beneficial effects of rosiglitazone on novel cardiovascular risk factors in patients with Type 2 diabetes mellitus. Diabetic Medicine 25: 333–340.
15. Delerive P, Martin-Nizard F, Chinetti G, Trottein F, Fruchart JC, et al. (1999) Peroxisome proliferator-activated receptor activators inhibit thrombin-induced endothelin-1 production in human vascular endothelial cells by inhibiting the activator protein-1 signaling pathway. Circ.Res. 85: 394–402.
16. Mertens A, Verhamme P, Bielicki JK, Phillips MC, Quarck R, et al. (2003) Increased low-density lipoprotein oxidation and impaired high-density lipopro-tein antioxidant defense are associated with increased macrophage homing and atherosclerosis in dyslipidemic obese mice: LCAT gene transfer decreases atherosclerosis. Circulation 107: 1640–1646.
17. Verreth W, De Keyzer D, Pelat M, Verhamme P, Ganame J, et al. (2004) Weight-loss-associated induction of peroxisome proliferator-activated receptor-alpha and peroxisome proliferator-activated receptor-gamma correlate with reduced atherosclerosis and improved cardiovascular function in obese insulin-resistant mice. Circulation 110: 3259–3269.
18. Taleb S, Herbin O, Ait-Oufella H, Verreth W, Gourdy P, et al. (2007) Defective leptin/leptin receptor signaling improves regulatory T cell immune response and protects mice from atherosclerosis. Arteriosclerosis, Thrombosis, and Vascular Biology 27: 2691–2698.
19. Verreth W, De Keyzer D, Davey PC, Geeraert B, Mertens A, et al. (2007) Rosuvastatin restores superoxide dismutase expression and inhibits accumula-tion of oxidized LDL in the aortic arch of obese dyslipidemic mice. British Journal of Pharmacology 151: 347–355.
20. Geeraert B, Crombe F, Hulsmans M, Benhabiles N, Geuns JM, et al. (2010) Stevioside inhibits atherosclerosis by improving insulin signaling and antioxidant defense in obese insulin-resistant mice. Int.J.Obes.(Lond) 34: 569–577. 21. Zamboni DS, Rabinovitch M (2003) Nitric oxide partially controls Coxiella
burnetii phase II infection in mouse primary macrophages. Infect.Immun. 71: 1225–1233.
22. Englen MD, Valdez YE, Lehnert NM, Lehnert BE (1995) Granulocyte/ macrophage colony-stimulating factor is expressed and secreted in cultures of murine L929 cells. J.Immunol.Methods 184: 281–283.
23. Bouhlel MA, Derudas B, Rigamonti E, Dievart R, Brozek J, et al. (2007) PPARgamma activation primes human monocytes into alternative M2 macrophages with anti-inflammatory properties. Cell Metab 6: 137–143. 24. Wayman NS, Hattori Y, McDonald MC, Mota-Filipe H, Cuzzocrea S, et al.
(2002) Ligands of the peroxisome proliferator-activated receptors (PPAR-gamma and PPAR-alpha) reduce myocardial infarct size. FASEB Journal 16: 1027– 1040.
25. Calkin AC, Forbes JM, Smith CM, Lassila M, Cooper ME, et al. (2005) Rosiglitazone attenuates atherosclerosis in a model of insulin insufficiency independent of its metabolic effects. Arteriosclerosis, Thrombosis, and Vascular Biology 25: 1903–1909.
26. Haffner SM, Greenberg AS, Weston WM, Chen H, Williams K, et al. (2002) Effect of rosiglitazone treatment on nontraditional markers of cardiovascular disease in patients with type 2 diabetes mellitus. Circulation 106: 679–684. 27. Chu NV, Kong AP, Kim DD, Armstrong D, Baxi S, et al. (2002) Differential
effects of metformin and troglitazone on cardiovascular risk factors in patients with type 2 diabetes. Diabetes Care 25: 542–549.
28. Verreth W, Ganame J, Mertens A, Bernar H, Herregods MC, et al. (2006) Peroxisome proliferator-activated receptor-alpha,gamma-agonist improves in-sulin sensitivity and prevents loss of left ventricular function in obese dyslipidemic mice. Arteriosclerosis, Thrombosis, and Vascular Biology 26: 922–928.
29. Combs TP, Wagner JA, Berger J, Doebber T, Wang WJ, et al. (2002) Induction of adipocyte complement-related protein of 30 kilodaltons by PPARgamma agonists: a potential mechanism of insulin sensitization. Endocrinology 143: 998–1007.
30. Iwaki M, Matsuda M, Maeda N, Funahashi T, Matsuzawa Y, et al. (2003) Induction of adiponectin, a fat-derived antidiabetic and antiatherogenic factor, by nuclear receptors. Diabetes 52: 1655–1663.
31. Padmalayam I, Suto M (2013) Role of Adiponectin in the metabolic syndrome: current perspectives on its modulation as a treatment strategy. Curr.Pharm.Des doi:CPD-EPUB-20130220-9.
32. Hu D, Fukuhara A, Miyata Y, Yokoyama C, Otsuki M, et al. (2013) Adiponectin Regulates Vascular Endothelial Growth Factor-C Expression in Macrophages via Syk-ERK Pathway. PLoS.ONE. 8: e56071.
33. Tao L, Wang Y, Gao E, Zhang H, Yuan Y, et al. (2010) Adiponectin: an indispensable molecule in rosiglitazone cardioprotection following myocardial infarction. Circulation Research 106: 409–417.
34. Wong WT, Tian XY, Xu A, Yu J, Lau CW, et al. (2011) Adiponectin is required for PPARgamma-mediated improvement of endothelial function in diabetic mice. Cell Metab 14: 104–115.
35. Bahia L, Aguiar LG, Villela N, Bottino D, Godoy-Matos AF, et al. (2007) Adiponectin is associated with improvement of endothelial function after rosiglitazone treatment in non-diabetic individuals with metabolic syndrome. Atherosclerosis 195: 138–146.
36. Standiford TJ, Kuick R, Bhan U, Chen J, Newstead M, et al. (2011) TGF-beta-induced IRAK-M expression in tumor-associated macrophages regulates lung tumor growth. Oncogene 30: 2475–2484.
37. Chen W, Saxena A, Li N, Sun J, Gupta A, et al. (2012) Endogenous IRAK-M Attenuates Postinfarction Remodeling Through Effects on Macrophages and Fibroblasts. Arteriosclerosis, Thrombosis, and Vascular Biology 32: 2598–2608. 38. Tsai JS, Chen CY, Chen YL, Chuang LM (2010) Rosiglitazone inhibits monocyte/macrophage adhesion through de novo adiponectin production in human monocytes. J.Cell Biochem. 110: 1410–1419.
39. Burgos-Ramos E, Sackmann-Sala L, Baquedano E, Cruz-Topete D, Barrios V, et al. (2012) Central leptin and insulin administration modulates serum cytokine-and lipoprotein-related markers. Metabolism 61: 1646–1657.
40. de Heredia FP, Gomez-Martinez S, Marcos A (2012) Obesity, inflammation and the immune system. Proceedings of the Nutrition Society 71: 332–338. 41. Kintscher U, Law RE (2005) PPARgamma-mediated insulin sensitization: the
importance of fat versus muscle. Am.J.Physiol Endocrinol.Metab 288: E287– E291.
42. Madej A, Okopien B, Kowalski J, Zielinski M, Wysocki J, et al. (1998) Effects of fenofibrate on plasma cytokine concentrations in patients with atherosclerosis and hyperlipoproteinemia IIb. Int.J Clin.Pharmacol.Ther. 36: 345–349. 43. Chakrabarti S, Blair P, Freedman JE (2007) CD40–40L signaling in vascular
inflammation. Journal of Biological Chemistry 282: 18307–18317.
44. van der Hoogt CC, de Haan W, Westerterp M, Hoekstra M, Dallinga-Thie GM, et al. (2007) Fenofibrate increases HDL-cholesterol by reducing cholesteryl ester transfer protein expression. Journal of Lipid Research 48: 1763–1771. 45. Srivastava RA (2011) Evaluation of anti-atherosclerotic activities of PPAR-alpha,
PPAR-gamma, and LXR agonists in hyperlipidemic atherosclerosis-susceptible F(1)B hamsters. Atherosclerosis 214: 86–93.
46. Duez H, Chao YS, Hernandez M, Torpier G, Poulain P, et al. (2002) Reduction of atherosclerosis by the peroxisome proliferator-activated receptor alpha agonist fenofibrate in mice. Journal of Biological Chemistry 277: 48051–48057.