Publisher’s version / Version de l'éditeur:
Journal of Membrane Science, 459, pp. 264-276, 2014-02-11
READ THESE TERMS AND CONDITIONS CAREFULLY BEFORE USING THIS WEBSITE. https://nrc-publications.canada.ca/eng/copyright
Vous avez des questions? Nous pouvons vous aider. Pour communiquer directement avec un auteur, consultez la
première page de la revue dans laquelle son article a été publié afin de trouver ses coordonnées. Si vous n’arrivez pas à les repérer, communiquez avec nous à PublicationsArchive-ArchivesPublications@nrc-cnrc.gc.ca.
Questions? Contact the NRC Publications Archive team at
PublicationsArchive-ArchivesPublications@nrc-cnrc.gc.ca. If you wish to email the authors directly, please see the first page of the publication for their contact information.
NRC Publications Archive
Archives des publications du CNRC
This publication could be one of several versions: author’s original, accepted manuscript or the publisher’s version. / La version de cette publication peut être l’une des suivantes : la version prépublication de l’auteur, la version acceptée du manuscrit ou la version de l’éditeur.
For the publisher’s version, please access the DOI link below./ Pour consulter la version de l’éditeur, utilisez le lien DOI ci-dessous.
https://doi.org/10.1016/j.memsci.2014.02.003
Access and use of this website and the material on it are subject to the Terms and Conditions set forth at
Mixed gas sorption in glassy polymeric membranes: II. CO2/CH4 mixtures in a polymer of intrinsic microporosity (PIM-1)
Vopička, Ondřej; De Angelis, Maria Grazia; Du, Naiying; Li, Nanwen; Guiver, Michael D.; Sarti, Giulio Cesare
https://publications-cnrc.canada.ca/fra/droits
L’accès à ce site Web et l’utilisation de son contenu sont assujettis aux conditions présentées dans le site LISEZ CES CONDITIONS ATTENTIVEMENT AVANT D’UTILISER CE SITE WEB.
NRC Publications Record / Notice d'Archives des publications de CNRC:
https://nrc-publications.canada.ca/eng/view/object/?id=2522486d-a6b8-4645-9edb-62131e9dbe36 https://publications-cnrc.canada.ca/fra/voir/objet/?id=2522486d-a6b8-4645-9edb-62131e9dbe36
1 2 3 4 5 6 7 8 9 10 11 12 13 14 15 16 17 18 19 20 21 22 23 24 25 26 27 28 29 30 31 32 33 34 35 36 37 38 39 40 41 42 43 44 45 46 47 48 49 50 51 52 53 54 55 56 57 58 59 60 61 62 63 64 65 1 Mixed gas sorption in glassy polymeric membranes:
II. CO2/CH4 mixtures in a polymer of intrinsic microporosity (PIM-1).
Ond
Naiying Du
b , Nanwen Li b, Michael D. Guiver b, Giulio Cesare Sarti a
a) Dipartimento di Ingegneria Civile, Chimica, Ambientale e dei Materiali (DICAM) Via Terracini 28 I-40131 Bologna, Italy.
b) National Research Council Canada, 1200 Montreal Road, Ottawa, ON, K1A 0R6, Canada Abstract
The individual solubility of CH4 and CO2 from binary gas mixtures was measured at 35 °C and up to 35 bar in a polymer of intrinsic microporosity (PIM-1), at different compositions of the gas phase (from 0 to 50 mol% of CO2). The experiments were conducted on a pressure-decay apparatus equipped with a gas chromatograph, allowing a highly flexible measuring procedure. The gas solubility was plotted versus gas phase composition, total pressure, gas fugacity and second gas concentration. The mixed gas solubility of both species, CH4 and CO2, is lower than the pure gas value at the same fugacity, but the reduction of methane solubility due to the presence of CO2 is generally more significant. Such behavior is due to the fact that CO2 has normally higher solubility than methane: indeed the depression of the solubility coefficient with respect to the pure gas value is similar for both gases, when reported at the same concentration of the second gas.The real, mixed gas solubility selectivity is in general higher than the ideal value calculated from pure gas behavior. The ratio between real and ideal solubility selectivity increases with CO2 concentration in the membrane, according to a single mastercurve, reaching a maximum value of 4, and increases also with the ratio between CO2 and CH4 concentration in the membrane. In particular, as in the case of other glassy polymers, the real solubility selectivity of CO2 over CH4 is higher than the ideal value if c(CO2)>c(CH4), and it is lower than the ideal value if the opposite condition holds true. Such behavior occurs because the competition for sorption is normally less effective on the more abundant penetrant in the polymer. A selectivity-solubility performance plot can be drawn for this system.
Keywords: PIM-1; intrinsic microporosity; gas transport; solubility; mixed gas
*
Present address: Department of Physical Chemistry - Institute of Chemical Technology Prague *
Corresponding author, e-mail: grazia.deangelis@unibo.it, tel. +39 (0) 51 2090410, fax. +39 (0) 51 6347788
*Manuscript
1 2 3 4 5 6 7 8 9 10 11 12 13 14 15 16 17 18 19 20 21 22 23 24 25 26 27 28 29 30 31 32 33 34 35 36 37 38 39 40 41 42 43 44 45 46 47 48 49 50 51 52 53 54 55 56 57 58 59 60 61 62 63 64 65 2 Introduction
The separation and removal of carbon dioxide from methane gaseous streams is a process of extreme industrial importance. Such a separation is required in natural gas or biogas treatment in order to increase the heating value and reduce the volume of gas to be transported. In the last two decades, the application of membranes to the removal of CO2 from methane, e.g. in natural gas and biogas processing, has been under the attention of membrane scientists.[1-4] Membrane technology may be more advantageous than conventional absorption of acid gases in basic solvents, and pressure swing adsorption (PSA), for small-to-medium scale separations and those not requiring stringent product purity. In particular, it is highly desirable to explore membrane materials which can selectively remove CO2 from gas mixtures, thereby maintaining CH4 at or near feed pressure to avoid gas recompression. [1,2]
The performance of a polymeric membrane for gas separation is expressed by its gas permeability and gas pair selectivity, which must be considered together with other important factors such as chemical and mechanical resistance.[5] The determination of permeability and selectivity of membrane materials in conditions as close as possible to the real operating conditions is essential for the design of membrane separation processes of gaseous mixtures and to identify the most appropriate range of conditions, and also to understand the fundamental mechanisms governing the transport processes. To this aim, it is important to point out that the interactions between gases play an important role in membrane gas separation, especially when swelling and/or polar gases are considered, and the transport parameters measured from pure gas experiments often differ significantly from those measured in the mixed gas state.[6] Therefore, the gas transport parameters required for the design of membrane separation processes must be measured or estimated in mixed gas conditions. Consequently, several works report permeability of gases from multicomponent gas mixtures, in promising membrane materials.[7-12]
Gas permeability in dense membranes is the product of the solubility and diffusivity contributions, as the permeation process requires dissolution of the fluid inside the solid phase, together with
1 2 3 4 5 6 7 8 9 10 11 12 13 14 15 16 17 18 19 20 21 22 23 24 25 26 27 28 29 30 31 32 33 34 35 36 37 38 39 40 41 42 43 44 45 46 47 48 49 50 51 52 53 54 55 56 57 58 59 60 61 62 63 64 65 3 diffusion through the polymer matrix under a driving force. Selectivity in a binary gas mixture is the product of solubility selectivity, dependent upon the different sorption levels of each gas inside the matrix, and diffusivity selectivity, essentially associated to the different sizes of each gas penetrant. These two factors can have different relative importance, depending upon the polymeric membrane material considered. In low-medium free volume glassy polymers, the most relevant contribution is diffusivity selectivity, and correspondingly these polymers are more permeable to the smaller molecules. However, there is an entire class of more novel polymeric materials, characterized by high free volume values, which shows the opposite behavior, with little size sieving character and more predominantly solubility selective. This effect may also result in the so-called „reverse selectivity‟, with the larger molecules having higher permeability than the smaller ones. Of course such effects become important when the CO2/CH4 gas pair is considered, as these two gases have similar values of the molecular kinetic diameter and therefore the diffusivity selectivity, based on size, is not far from unity. On the other hand, CO2 has higher condensability than methane, and the solubility selectivity in polymers is favorable to CO2: such contribution can even be augmented by incorporating functional groups into the polymeric matrix capable of interacting more specifically with CO2.
According to the Robeson upper-bound trade-off plot, among the membrane materials having the highest performance for CO2/CH4 separations are polymides, PIM-based polymers and PTMSP.[5] In particular, the latter polymers lie in the region of ultrahigh permeability (order of magnitude of 1000 Barrer for PIM-1 and 10000 Barrer for PTMSP) and low-medium CO2/CH4 selectivity (around 18 for PIM-1 and around 4 for PTMSP). The solubility selectivity values reported range from 3 to 5 [13] for PIM-1, and from 2 to 3 in PTMSP, according to the pure gas solubility measurements.[14] The diffusivity selectivity is estimated to be around 5 for PIM-1 and slightly higher than unity (around 1.5) for PTMSP. [15]
It is thus clear that the solubility selectivity and diffusivity selectivity have similar weightings in determining the overall selectivity performance: actually in both PTMSP and PIM-1, the pure gas
1 2 3 4 5 6 7 8 9 10 11 12 13 14 15 16 17 18 19 20 21 22 23 24 25 26 27 28 29 30 31 32 33 34 35 36 37 38 39 40 41 42 43 44 45 46 47 48 49 50 51 52 53 54 55 56 57 58 59 60 61 62 63 64 65 4 data seem to indicate that solubility selectivity is equal to or higher than diffusivity selectivity for the CO2/CH4 couple. It is thus evident that an accurate estimation of the solubility and of the solubility selectivity in these matrices is fundamental to evaluate and explain mixed gas permeation behavior at different operating conditions.
In this study we focus on the behavior of polymers having intrinsic microporosity (PIMs), which are promising materials, having high permeabilities and selectivities. [16-17] For example, a permselectivity of ca. 12-25 was reported for the equimolar carbon dioxide/methane mixture being separated on a PIM-1 membrane at 25 ºC up to the pressure of ca. 33 atm. [18] The permselectivity CO2/CH4 of a membrane functionalized with pendant tetrazole groups (TZPIM) decreases with the increasing feed pressure and, at the same time, does not reveal significant difference between the ideal and real permselectivity in those conditions. [13]
The aim of the present work is to assess, in a wide range of compositions and pressures, the solubility properties of CO2/CH4 mixtures absorbed in films of PIM-1. In particular, we study and determine the effect of mixture composition, pressure, second component fugacity and concentration on the solubility and solubility selectivity values, as well as on the deviation from the corresponding pure gas properties.
In previous work [19] it was shown that the solubility selectivity for CO2/CH4 mixed gases in PTMSP can be significantly higher than that evaluated from pure gas conditions, up to 4-5 times. That behavior is due to significant competition between the two penetrants for polymer sorption, which is in favour of the most abundant penetrant, usually CO2. In PTMSP, pure gas behaviour is approximately similar to that of CH4 mixtures diluted with low levels of CO2, which may occur in relatively pure natural gases. For CO2 molar fractions higher than 5-10%, which are present in many natural gas and biogas feed streams, the solubility of methane is much lower than the corresponding pure gas solubility value and the solubility selectivity based on pure gases can be highly underestimated.
1 2 3 4 5 6 7 8 9 10 11 12 13 14 15 16 17 18 19 20 21 22 23 24 25 26 27 28 29 30 31 32 33 34 35 36 37 38 39 40 41 42 43 44 45 46 47 48 49 50 51 52 53 54 55 56 57 58 59 60 61 62 63 64 65 5 challenging task than the measurement of mixed gas permeability, for which several data have been reported.[7-12] In previous work we have presented in detail the experimental apparatus used for binary gas solubility, [19] that was inspired by the one designed by Sanders et al.[20-22] The present system relies on a similar layout, which consisted of a pressure decay system combined with chromatographic analysis of the equilibrium gaseous mixture, but applies a novel procedure which makes the system more flexible. In particular, the method allows measurements of the solubility of each component with two different protocols: i) at constant fugacity (or partial pressure) of one component and variable fugacity of the second component, or ii) at constant equilibrium composition of the gaseous phase and variable total pressure. The latter set of conditions is more suitable to study the gas separation process, in which the composition of the gas mixture is fixed, and the total pressure of the mixture can be increased by compression.
It must also be mentioned that the values of pure and multicomponent solubility can be properly calculated in a predictive way using existing models, thus allowing the extension of the observed mixed gas behavior to a range of operating conditions greater than the one investigated experimentally, thereby avoiding or limiting as much as possible delicate and time consuming mixed gas measurements. The experimental data collected in part I and part II of this work will later be used, in part III of this work, to test, validate and compare the performance of two models for multicomponent solubility in glassy polymeric membranes, namely the Dual Mode model [23-24] and the Nonequilibrium Lattice Fluid (NELF) model.[25-27]
1. Experimental
1.1 Membrane and chemicals
PIM-1 was prepared by polycondensation of monomers 5,5′,6,6′-tetrahydroxy-3,3,3′,3′-tetramethylspirobisindane (Sigma-Aldrich, purified by crystallization from methanol) and tetrafluoroterephthalonitrile (Matrix scientific, purified by vacuum sublimation at 150 °C),
1 2 3 4 5 6 7 8 9 10 11 12 13 14 15 16 17 18 19 20 21 22 23 24 25 26 27 28 29 30 31 32 33 34 35 36 37 38 39 40 41 42 43 44 45 46 47 48 49 50 51 52 53 54 55 56 57 58 59 60 61 62 63 64 65 6 following a reported high temperature procedure at 160 °C. [28] The resulting PIM-1 had Mn = 53000 Da, measured by GPC, and a polydispersity of 2.2.
PIM-1 membranes were prepared from ca. 2.0 wt.% filtered chloroform solutions, which were poured into a fluoropolymer-coated Petri dish and partially covered. Chloroform (Riedel de Haen, stabilised, 99.0-99.4%) was allowed to evaporate slowly from the solution over ca 3 days under ambient air conditions; the membrane was then placed into a vacuum oven (70 °C, vacuum) for 24 h. Afterwards, the mass of the membranes was checked over time and was found to be time-invariant. The polymer was then submerged in liquid methanol for 2 hours, cut into pieces and dried under vacuum for 12 h at 70 °C. This membrane preparation method in which the final drying was performed under air at 70 °C, is a modification of that previously reported.[29]
Thickness of the samples was (102±13) µm, and the mass of the membrane used for experiments was 1.1602 g.
The following gases and chemicals were used without further purification: carbon dioxide (Siad, >99.999%), helium (SOL, >99.9999%), methane (Siad, >99.995%), methanol (Carlo Erba Réactifs, > 99.9%).
1.2 Polymer density
The density of the membrane was evaluated using the method of repeatedly weighing the mass of polymer in air and in demineralized, re-boiled water [30] at (25±1) ºC; the density of pure PIM-1 was (1.143±0.008) g/cm3. The effect of water sorption in PIM-1 on the measured density was corrected by measuring the masses of a polymer sample just removed from the vacuum oven and after its exposure to saturated water vapor for ca. 20 minutes.
1.3. Mixed gas sorption
Experiments were performed using a laboratory-built pressure decay apparatus, designed as an evolution of those used by Sanders et al., [20-22] Raharjo et. al [31-32] and Ribeiro et al. [33].
1 2 3 4 5 6 7 8 9 10 11 12 13 14 15 16 17 18 19 20 21 22 23 24 25 26 27 28 29 30 31 32 33 34 35 36 37 38 39 40 41 42 43 44 45 46 47 48 49 50 51 52 53 54 55 56 57 58 59 60 61 62 63 64 65 7 The schematic of the setup used in the present work is reported in previous work.[19] The pressure decay equipment is connected to a micro-gas chromatograph for gas phase analysis. Details about the equipment and the experimental protocol, as well as the calibration procedures, can be found elsewhere.[19] Concentrations of methane and carbon dioxide in PIM-1 were evaluated from the directly measured data of initial and final gas composition in the calibrated volume, using species mass balance. Soave-Redlich-Kwong (SRK) [34] equation of state was used for the description of the properties of pure gases and their mixtures. The experimental uncertainty was estimated with the law of propagation of unbiased uncertainties; uncertainties on pressure, volumes and gas chromatograph analysis were included in this calculation. The procedure followed was described in detail earlier.[19]
2 Results and discussion
2.1 Pure gas solubility isotherms
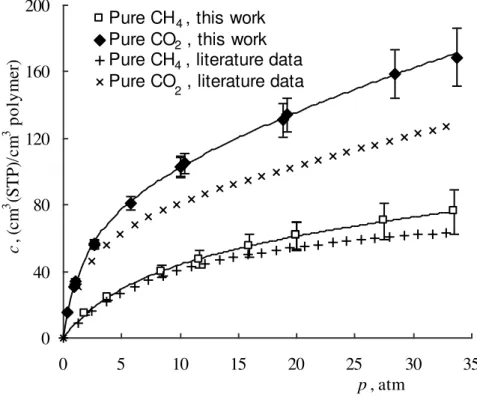
The solubility isotherms of pure gases were measured using the procedures described above. Fig. 1 reports the solubility isotherm of pure CH4 and pure CO2 measured in PIM-1 in this work. In comparison with previously published isotherms [35], the values obtained here are similar at low pressure for both penetrants, but are somewhat higher at higher pressures. This effect may be due to the different pre-treatment applied to the samples; in this work the sample was kept under vacuum at a relatively moderate temperature (70 °C), while Holck et al. [35] applied a more intensive treatment (150 °C) which can result in a remarkable reduction of the gas solubility and transport properties of the sample, as it accelerates the process of physical ageing.
1 2 3 4 5 6 7 8 9 10 11 12 13 14 15 16 17 18 19 20 21 22 23 24 25 26 27 28 29 30 31 32 33 34 35 36 37 38 39 40 41 42 43 44 45 46 47 48 49 50 51 52 53 54 55 56 57 58 59 60 61 62 63 64 65 8 0 40 80 120 160 200 0 5 10 15 20 25 30 35 p , atm c , (c m 3 (S T P )/ c m 3 p o ly m e r)
Pure CH , this work Pure CO , this work Pure CH , literature data Pure CO , literature data
4 2
2 4
Fig. 1. Pure methane and pure carbon dioxide sorption in PIM-1 at 35.0 ºC. Interpolation with Dual Mode Sorption model is shown, both with parameters obtained in this work and with parameters from literature. [35]
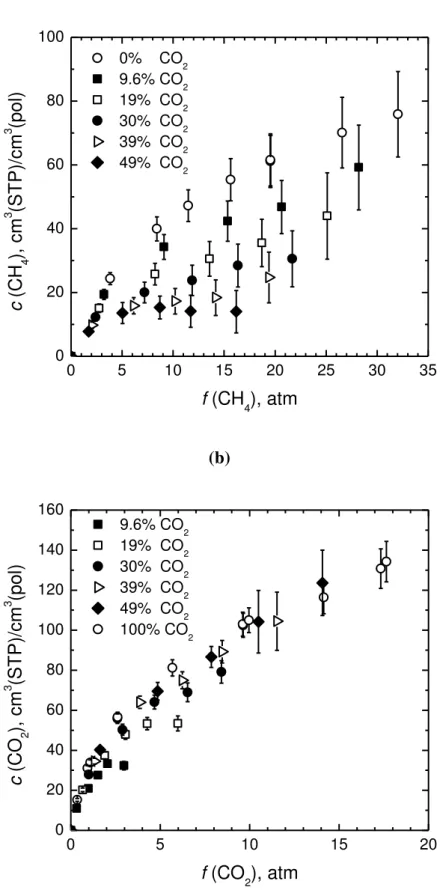
1 2 3 4 5 6 7 8 9 10 11 12 13 14 15 16 17 18 19 20 21 22 23 24 25 26 27 28 29 30 31 32 33 34 35 36 37 38 39 40 41 42 43 44 45 46 47 48 49 50 51 52 53 54 55 56 57 58 59 60 61 62 63 64 65 11 (a) 0 5 10 15 20 25 30 35 0 20 40 60 80 100 c (C H 4 ), c m 3 (ST P)/ c m 3 (pol) f (CH 4), atm 0% CO2 9.6% CO2 19% CO2 30% CO2 39% CO2 49% CO2 (b) 0 5 10 15 20 0 20 40 60 80 100 120 140 160 c (C O 2 ), c m 3 (ST P)/ c m 3 (pol) f (CO 2), atm 9.6% CO2 19% CO2 30% CO2 39% CO2 49% CO2 100% CO2
Fig. 3: Pure and mixed gas solubility of CH4 (a) and CO2 (b) in PIM-1 at 35.0 ºC, versus component fugacity, at different mol fractions of CO2 in the gaseous mixture.
1 2 3 4 5 6 7 8 9 10 11 12 13 14 15 16 17 18 19 20 21 22 23 24 25 26 27 28 29 30 31 32 33 34 35 36 37 38 39 40 41 42 43 44 45 46 47 48 49 50 51 52 53 54 55 56 57 58 59 60 61 62 63 64 65 12 The trends reported in Figures 2 and 3 confirm the competitive nature of mixed gas solubility in glassy polymers, where for each species the deviations from the ideal pure gas case increase as pressure and mole fraction of the second gas increase. It is interesting to observe that the competition has a much stronger impact on methane than on carbon dioxide solubility. Such an effect is in general beneficial, because it increases the CO2-selective sorption in the membrane, although it is somehow unexpected. It is also interesting to compare the behavior observed for PIM-1 with other mixed gases effects for CO2/CH4 mixtures in different glassy polymers which also showed a solubility decrease of both penetrants with respect to the ideal pure gas case. In particular, in poly(phenylene oxide) [36] from a gas mixture containing about 24 mole% of CO2 at about 21 atm total pressure, the solubility of CH4 was seen to decrease about 30% with respect to pure CH4, while for a mixture containing about 76 mole% of CO2 at the same pressure, the solubility decrease of CH4 was around 70%. In the latter case the concentration of CO2 in the polymer was about 30 cm3(STP)/cm3(pol), while in the former it was only about 13 cm3(STP)/cm3(pol), indicating that the competitive effect towards CH4 solubility is higher as CO2 concentration in the polymer increases. In PTMSP, [19] the maximum relative decrease of CH4 concentration in the polymer, with respect to the pure gas value, reaches 24 % with 20 mole% CO2 in the gas phase, 51 % with 50 mole% CO2, 63 % with 70 mole% CO2 and 77 % with 90 mol% CO2, respectively. On the contrary, CO2 solubility in PTMSP is much less affected by the presence of methane; indeed a decrease of CO2 solubility with respect to pure gas value is visible only at high CH4 mole fractions in the gas: 7 % at 4.9 % CO2 and 20 % at 9.7% CO2, respectively.
It was previously observed, based on data for different binary gaseous mixtures and various glassy polymers, that as a rule of thumb the relative decrease of solubility with respect to the pure gas conditions is higher for the penetrant whose molar concentration is less abundant in the polymer. [19,27] That behavior appears to be independent of the total pressure or partial pressure of penetrants and of gaseous mixture composition. When the polymer contains similar molar concentrations of both penetrants, the extent of solubility depression is practically the same for
1 2 3 4 5 6 7 8 9 10 11 12 13 14 15 16 17 18 19 20 21 22 23 24 25 26 27 28 29 30 31 32 33 34 35 36 37 38 39 40 41 42 43 44 45 46 47 48 49 50 51 52 53 54 55 56 57 58 59 60 61 62 63 64 65 13 both penetrants.
2.3 Mixed gas solubility coefficients
The multicomponent solubility data relative to CH4 and CO2 in PIM-1 are expressed in terms of solubility coefficient of each component, defined as:
i i i c S f (1)
where ci is the concentration of component i in the membrane and fi its fugacity. The solubility
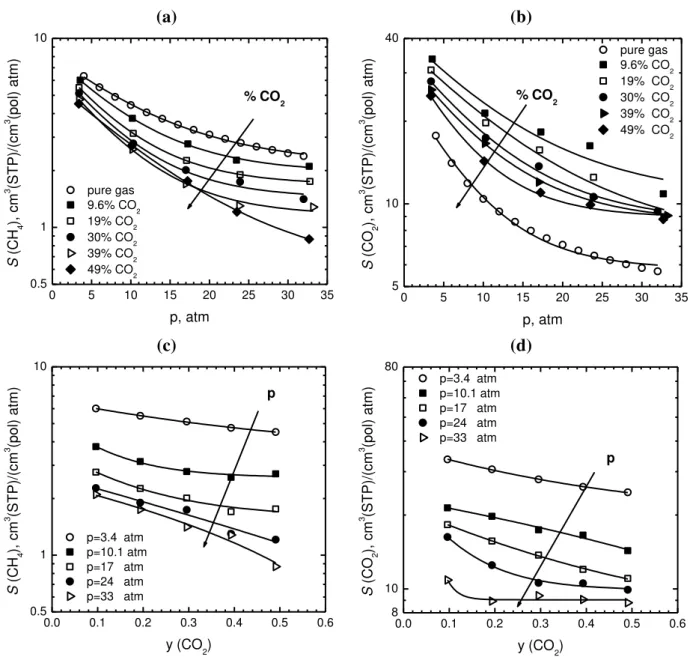
coefficients of methane and carbon dioxide in PIM-1 are plotted versus pressure in Figs. 4a and 4b, as well as versus CO2 mole fraction in the gas in Figs. 4c and 4d. As expected, the solubility coefficients decrease with increasing pressure, but also, less markedly, with increasing CO2 mole fraction in the gas. Remarkably, the solubility coefficient of both methane and CO2 decrease with increasing molar fraction of CO2 in the gas. The situation here is complicated by the fact that different parameters are varying simultaneously, i.e. pressure and gas composition. The latter two variables can also be grouped in different ways, which may offer a better insight on the more relevant effects of the mixed gas solubility investigated here.
1 2 3 4 5 6 7 8 9 10 11 12 13 14 15 16 17 18 19 20 21 22 23 24 25 26 27 28 29 30 31 32 33 34 35 36 37 38 39 40 41 42 43 44 45 46 47 48 49 50 51 52 53 54 55 56 57 58 59 60 61 62 63 64 65 14 (a) (b) 0 5 10 15 20 25 30 35 0.5 1 10 % CO 2 S (C H4 ), c m 3 (ST P)/ (c m 3 (pol) at m ) p, atm pure gas 9.6% CO2 19% CO2 30% CO2 39% CO2 49% CO2 0 5 10 15 20 25 30 35 5 10 40 % CO 2 S (C O 2 ), c m 3 (ST P)/ (c m 3 (pol) at m ) p, atm pure gas 9.6% CO2 19% CO2 30% CO2 39% CO2 49% CO2 (c) (d) 0.0 0.1 0.2 0.3 0.4 0.5 0.6 0.5 1 10 p S (C H4 ), c m 3 (ST P)/ (c m 3 (pol) at m ) y (CO2) p=3.4 atm p=10.1 atm p=17 atm p=24 atm p=33 atm 0.0 0.1 0.2 0.3 0.4 0.5 0.6 8 10 80 p=3.4 atm p=10.1 atm p=17 atm p=24 atm p=33 atm p S (C O 2 ), c m 3 (ST P)/ (c m 3 (pol) at m ) y (CO2)
Fig. 4. Solubility coefficient S of CH4 (a) and CO2 (b) versus average total equilibrium pressure.
Solubility coefficient S of CH4 (c) and CO2 (d) versus equilibrium gas phase composition. Data obtained in PIM-1 at 35.0°C.
Thus, with the aim of providing a more meaningful representation of the data, we plotted the solubility coefficients versus the gas fugacities. The latter are representative of the penetrant chemical potential, and are also easy to calculate from pressure and gas composition, by using a common equation of state. In particular, the solubility of each penetrant was plotted against the same component fugacity (Figures 5a and 5c) and against the other component fugacity (Figures 5b and 5d), at different gas compositions. It is seen that the solubility coefficient of methane decreases with its fugacity, and also with molar fraction of CO2 in the gas mixture. Therefore, the
1 2 3 4 5 6 7 8 9 10 11 12 13 14 15 16 17 18 19 20 21 22 23 24 25 26 27 28 29 30 31 32 33 34 35 36 37 38 39 40 41 42 43 44 45 46 47 48 49 50 51 52 53 54 55 56 57 58 59 60 61 62 63 64 65 15 solubility coefficient of methane depends on two variables: methane fugacity and mixture composition (Figure 5a). However, it is interesting to note that, by re-plotting the same solubility coefficient data as a function of CO2 fugacity in the mixture, Fig. 5b, the curves representing solubility coefficients at the different compositions become much closer to one another.
In Fig. 5c we plot the CO2 solubility coefficient, S(CO2), versus its fugacity in the mixture. The value decreases with fugacity, as it is common in glassy polymers, but it does also increase with increasing molar fraction of carbon dioxide in the gas mixture, at fixed CO2 fugacity, as expected. A plot of the same data versus CH4 fugacity (Fig. 5d) shows that the solubility coefficients of CO2 decrease, both with increasing methane fugacity at constant gas composition, and with increasing the molar fraction of CO2 at constant methane fugacity.
Therefore, the solubilities of both CH4 and CO2 in PIM-1 depend strongly on the fugacity of CO2, with an additional effect attributed to the gas mixture composition: in particular, at fixed CO2 fugacity, the solubility coefficient of methane decreases with increasing y(CO2), while the opposite occurs for CO2 solubility coefficient, as otherwise expected.
1 2 3 4 5 6 7 8 9 10 11 12 13 14 15 16 17 18 19 20 21 22 23 24 25 26 27 28 29 30 31 32 33 34 35 36 37 38 39 40 41 42 43 44 45 46 47 48 49 50 51 52 53 54 55 56 57 58 59 60 61 62 63 64 65 16 (a) 0 5 10 15 20 25 30 35 0 1 2 3 4 5 6 7 (y (CO2)) 0% CO2 9.6% CO2 19% CO2 30% CO2 39% CO2 49% CO2 S (C H 4 ), c m 3 (ST P)/ (c m 3 (pol) at m ) f (CH 4), atm (b) 0 5 10 15 0 1 2 3 4 5 6 7 9.6% CO2 19% CO2 30% CO2 39% CO 2 49% CO2 S (C H4 ), c m 3 (ST P)/ (c m 3 (pol) at m ) f (CO 2), atm (c) 0 5 10 15 0 5 10 15 20 25 30 35 40 y(CO2) 9.6% CO 2 19% CO2 30% CO2 39% CO2 49% CO2 100% CO 2 S (C O2 ), c m 3 (ST P)/ (c m 3 (pol) at m ) f (CO2), atm (d) 0 5 10 15 20 25 30 35 5 10 15 20 25 30 35 40 9.6% CO 2 19% CO2 30% CO2 39% CO2 49% CO 2 S (C O2 ), c m 3 (ST P)/ (c m 3 (pol) at m ) f (CH 4), atm
Fig. 5. Solubility coefficient S of CH4 versus fugacity of (a) CH4 and (b) CO2. Solubility coefficient of CO2 versus fugacity of (c) CO2 and (d) CH4. Curves in figures represent exponential interpolations.
From the above trends it appears that the solubility behavior is governed mainly by CO2 fugacity in the mixture, which thus plays a predominant role in mixed gas sorption.
In order to present the data in a more concise fashion, it is more effective to consider the deviations from pure gas behavior, thus highlighting only the effects of the second component in mixed gas conditions. To this aim, the ratio between mixed gas and pure gas solubility coefficient, evaluated at the same component fugacity, is reported as a function of total pressure in Figs. 6a and 6b for CH4 and CO2, respectively. Both quantities are lower than unity, indicating that, in the mixed gas state competition for sorption into the polymer matrix lowers the solubility of both
1 2 3 4 5 6 7 8 9 10 11 12 13 14 15 16 17 18 19 20 21 22 23 24 25 26 27 28 29 30 31 32 33 34 35 36 37 38 39 40 41 42 43 44 45 46 47 48 49 50 51 52 53 54 55 56 57 58 59 60 61 62 63 64 65 19 quantity, one can rely on the component fugacity, which can be easily estimated from an equation of state (or approximated to the partial pressure, in the case of little deviation from ideality). Indeed the deviation of the solubility from pure gas behavior is also related to the component fugacities, according to the following correlation (Figure 7d):
4 2 4 (CH ) exp 0.119 (CH ) pure S f CO S R 2 =0.61 (3)where fugacity is in atmospheres.
On the contrary, a similar procedure for CO2 solubility does not lead to any reasonable single mastercurve, neither using CH4 fugacity (see Fig. 7e) nor using CO2 fugacity (not shown).
Of course, the above correlations are merely empirical, and can be applied only in the experimental range considered (0-34 bar total pressure and y(CO2)=10-50%).
1 2 3 4 5 6 7 8 9 10 11 12 13 14 15 16 17 18 19 20 21 22 23 24 25 26 27 28 29 30 31 32 33 34 35 36 37 38 39 40 41 42 43 44 45 46 47 48 49 50 51 52 53 54 55 56 57 58 59 60 61 62 63 64 65 20 (a) 0 20 40 60 80 100 120 140 0.0 0.2 0.4 0.6 0.8 1.0 1.2 1.4 1.6 1.8 2.0 S (C H 4 )/ S p u re (C H 4 ) c (CO 2), cm 3 (STP)/cm3(pol) 9.6% CO2 19% CO2 30% CO2 39% CO2 49% CO2 (b) 0 20 40 60 80 0.0 0.2 0.4 0.6 0.8 1.0 1.2 1.4 1.6 1.8 2.0 9.6% CO2 19% CO2 30% CO2 39% CO2 49% CO2 S (C O2 )/ Sp u re (C O2 ) c(CH 4), cm 3 (STP)/cm3(pol) (c) 0 20 40 60 80 100 120 140 0.0 0.2 0.4 0.6 0.8 1.0 1.2
gas A=CH4, gas B=CO2 gas A=CO2, gas B=CH4
S (gas A)/ Sp u re (gas A) c (gas B), cm3(STP)/cm3(pol) (d) 0 5 10 15 0.0 0.2 0.4 0.6 0.8 1.0 1.2 1.4 1.6 1.8 2.0 S (C H 4 )/ S p u re (C H 4 ) f (CO 2), atm 9.6% CO2 19% CO2 30% CO2 39% CO2 49% CO2 (e) 0 10 20 30 40 0.0 0.2 0.4 0.6 0.8 1.0 1.2 1.4 1.6 1.8 2.0 9.6% CO2 19% CO2 30% CO2 39% CO2 49% CO2 S (C O 2 )/ S p u re (C O 2 ) f (CH 4), atm
Fig. 7. Ratio between mixed gas and pure gas Solubility coefficient S of (a) CH4, (b) CO2, (c) CH4 and CO2 versus 2nd component molar concentration; Ratio between mixed gas and pure gas
Solubility coefficient S of (d) CH4 and (e) CO2, versus 2nd component fugacity. Data obtained in PIM-1 at 35.0°C, for different molar fractions of CO2 in the gas mixture.
1 2 3 4 5 6 7 8 9 10 11 12 13 14 15 16 17 18 19 20 21 22 23 24 25 26 27 28 29 30 31 32 33 34 35 36 37 38 39 40 41 42 43 44 45 46 47 48 49 50 51 52 53 54 55 56 57 58 59 60 61 62 63 64 65 21 2.4 Solubility selectivity of CO2/CH4 mixture
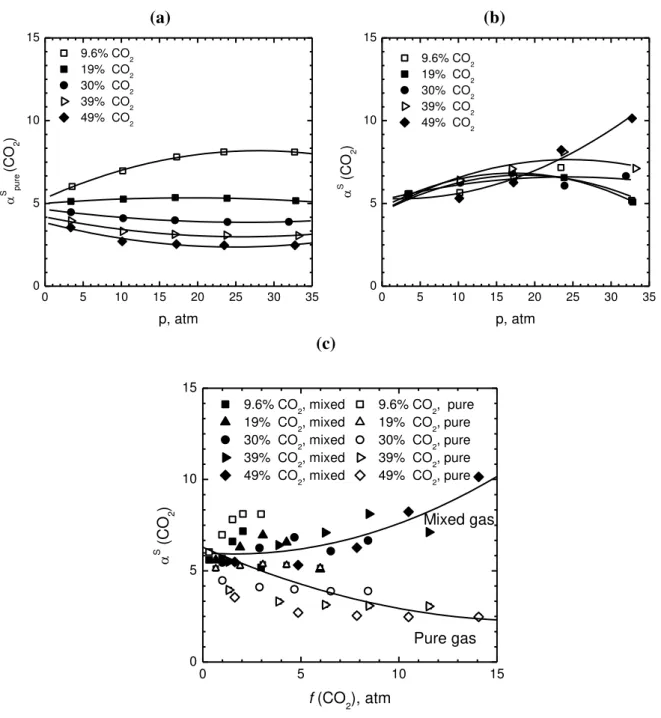
The pure gas (ideal) and mixed gas (real) solubility selectivity of PIM-1 for CO2 over CH4, S
(CO2), are reported in Figs. 8a and 8b, as a function of total pressure. The ideal solubility selectivity, indicated as pure
S 2 (CO )
, decreases with increasing y(CO2) at fixed total pressure, while
the trend with total pressure depends on the mixture composition. In particular, for CO2 mole fractions lower than 19%, the ideal solubility selectivity increases with total pressure, while it decreases with pressure for higher mole fractions: such behavior can be explained by the fact that the solubility coefficients of the two gases decrease in different ways with increasing pressure. The mixed gas selectivity, indicated as (CO )2
S
, shows a behavior which is much less dependent
on mixture composition than the ideal gas value (Fig. 8b), and covers a narrower spectrum of values in a broad pressure range up to 25 bar. The trend with pressure is less regular than the corresponding ideal value.
1 2 3 4 5 6 7 8 9 10 11 12 13 14 15 16 17 18 19 20 21 22 23 24 25 26 27 28 29 30 31 32 33 34 35 36 37 38 39 40 41 42 43 44 45 46 47 48 49 50 51 52 53 54 55 56 57 58 59 60 61 62 63 64 65 22 (a) 0 5 10 15 20 25 30 35 0 5 10 15 S p u re (C O2 ) p, atm 9.6% CO2 19% CO2 30% CO2 39% CO2 49% CO2 (b) 0 5 10 15 20 25 30 35 0 5 10 15 9.6% CO2 19% CO2 30% CO2 39% CO2 49% CO2 S (C O 2 ) p, atm (c) 0 5 10 15 0 5 10 15 Pure gas Mixed gas 9.6% CO2, pure 19% CO2, pure 30% CO2, pure 39% CO2, pure 49% CO2, pure 9.6% CO2, mixed 19% CO2, mixed 30% CO2, mixed 39% CO2, mixed 49% CO2, mixed S (C O 2 ) f (CO 2), atm
Fig. 8: (a) Pure gas (ideal) and (b) mixed gas (real) solubility selectivity for the CO2-CH4 mixture in PIM-1 at 35°C, for different molar fractions of CO2 in the gas mixture, versus total pressure; and versus CO2 fugacity (c). Solid and dashed lines are interpolating curves.
As observed for the solubility coefficients, the mixed gas solubility selectivity appears to be rather strongly correlated to CO2 fugacity (Fig. 8c). The ideal solubility selectivity is decreasing, rather than increasing, with CO2 fugacity, due to the strong decrease of the slope of CO2 solubility isotherm. Therefore, the increasing trend of real S is fully due to the competitive interactions between gases for sorption into the polymer, that are absent in the case of pure gas sorption.
1 2 3 4 5 6 7 8 9 10 11 12 13 14 15 16 17 18 19 20 21 22 23 24 25 26 27 28 29 30 31 32 33 34 35 36 37 38 39 40 41 42 43 44 45 46 47 48 49 50 51 52 53 54 55 56 57 58 59 60 61 62 63 64 65 23 This observation corroborates the idea that the preferential sorption of CO2 molecules inside the matrix increases with the amount of CO2 molecules already absorbed in the matrix or, on the other hand, that the absorption of methane molecules is impeded by the presence of carbon dioxide molecules.
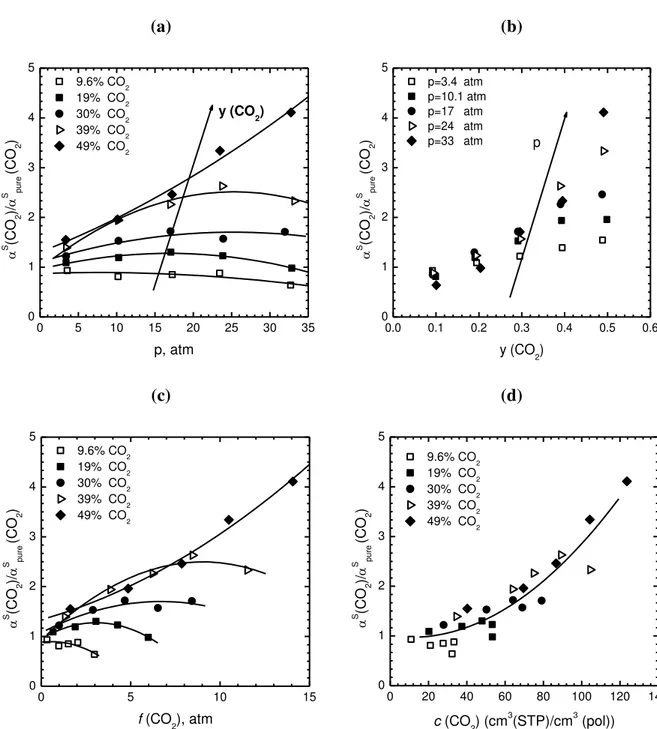
A more concise way of representing the mixed gas information available is obtained by considering the ratio between the mixed gas and ideal gas solubility selectivity, thus showing directly the multicomponent effects. Such a ratio is reported in Fig. 9a as a function of total pressure in the mixture, for different CO2 mole fractions, and in Fig. 9b as a function of CO2 mole fraction, at different total pressures. The plots show an increasing deviation of the solubility selectivity from ideality with increasing total pressure and CO2 mole fraction in the mixture. When the deviation from the pure gas selectivity is plotted as a function of CO2 fugacity (Fig. 9c), the behavior is more complex, as different curves can be drawn at different values of mole fraction in the gas phase. However, by plotting the same quantity as a function of CO2 concentration in the polymer (Fig. 9d), a single mastercurve can be reasonably drawn to represent the deviation of mixed gas solubility selectivity from pure gas behavior, for all gas compositions. Such a mastercurve can be expressed as:
4 2 3 2 2 4 2 2 2 4 (CO / CH ) 2.4 10 (CO ) 5.2 10 (CO ) 1.0 0.89 (CO / CH ) S S pure c c R (4)
This result is interesting in that it actually affirms the strong influence that sorbed CO2 molecules have on the mixed gas solubility behavior of the mixture.
1 2 3 4 5 6 7 8 9 10 11 12 13 14 15 16 17 18 19 20 21 22 23 24 25 26 27 28 29 30 31 32 33 34 35 36 37 38 39 40 41 42 43 44 45 46 47 48 49 50 51 52 53 54 55 56 57 58 59 60 61 62 63 64 65 24 (a) 0 5 10 15 20 25 30 35 0 1 2 3 4 5 y (CO 2) 9.6% CO2 19% CO2 30% CO2 39% CO2 49% CO2 S (C O2 )/ S p u re (C O2 ) p, atm (b) 0.0 0.1 0.2 0.3 0.4 0.5 0.6 0 1 2 3 4 5 p p=3.4 atm p=10.1 atm p=17 atm p=24 atm p=33 atm S (C O2 )/ S p u re (C O2 ) y (CO2) (c) 0 5 10 15 0 1 2 3 4 5 9.6% CO2 19% CO2 30% CO2 39% CO2 49% CO2 S (C O2 )/ S p u re (C O2 ) f (CO 2), atm (d) 0 20 40 60 80 100 120 140 0 1 2 3 4 5 9.6% CO2 19% CO2 30% CO2 39% CO2 49% CO2 S (C O2 )/ S p u re (C O2 ) c (CO 2) (cm 3 (STP)/cm3 (pol))
Fig. 9: Ratio between mixed gas and pure gas solubility selectivity for the CO2/CH4 mixture in PIM-1 at 35 °C, for different mol fractions of CO2 in the gas mixture, versus (a) total pressure; (b) CO2 molar fraction in the gas mixture (c) CO2 fugacity in the polymer and (d) CO2
concentration in PIM-1. Solid lines are interpolating curves.
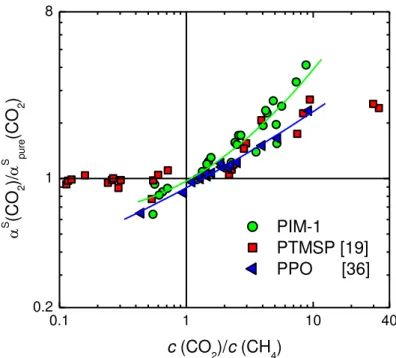
In Fig. 10 the same quantity is reported versus the ratio between the actual CO2 and methane molar concentrations in the polymer, c(CO2)/c(CH4): the higher-than-ideal behavior of the selectivity is observed, in particular, when the molar fraction of CO2 in the polymer overcomes that of methane, as it was also observed for other polymers, in particular in PPO and in PTMSP with the same gas mixture.[19,27] In PPO, a lower-than-ideal behavior is observed when c(CO2) <
1 2 3 4 5 6 7 8 9 10 11 12 13 14 15 16 17 18 19 20 21 22 23 24 25 26 27 28 29 30 31 32 33 34 35 36 37 38 39 40 41 42 43 44 45 46 47 48 49 50 51 52 53 54 55 56 57 58 59 60 61 62 63 64 65 25
c(CH4), [19] while in PTMSP the solubility selectivity follows an ideal trend in this range.[19] In particular one can draw the following correlations for PIM-1:
2
2 1 1 2 4 2 4 2 4 2 4 2 (CO / CH ) 1.6 10 (CO ) (CH ) 2.3 10 (CO ) (CH ) 7.6 10 (CO / CH ) 0.90 S S pure c c c c R (5)Where the right hand side approximately equals 1.00 when c(CO )2 c(CH )4 =1.
It can be noticed that, since the selectivities in mixed and pure gas conditions are calculated at the same fugacity values, the above mentioned solubility selectivity ratio is equal also to the ratio between CO2 concentration depression and CH4 concentration depression, as follows:
2 2 2 4 2 4 4 4 (CO ) / (CO ) (CO / CH ) (CO / CH ) (CH ) / (CH ) S pure S pure pure c c c c (6)
And thus the empirical correlation expressed by equation (5) indicates that, for equimolar penetrant concentrations inside the membrane the extent of solubility depression is the same for both gases, while in the other cases the extent of solubility depression is higher for the less abundant gas in the matrix.
1 2 3 4 5 6 7 8 9 10 11 12 13 14 15 16 17 18 19 20 21 22 23 24 25 26 27 28 29 30 31 32 33 34 35 36 37 38 39 40 41 42 43 44 45 46 47 48 49 50 51 52 53 54 55 56 57 58 59 60 61 62 63 64 65 26 0.1 1 10 40 0.2 1 8 PIM-1 PTMSP [19] PPO [36] S (C O 2 )/ S p u re (C O 2 ) c (CO 2)/c (CH4)
Fig. 10: Ratio between mixed gas and pure gas solubility selectivity for the CO2/CH4 mixture in PIM-1 at 35 °C, for different mol fractions of CO2 in the gas mixture, versus ratio between CO2 and CH4 concentration in PIM-1, together with corresponding literature data measured in PTMSP [19] and PPO [36]. Solid lines are interpolating curves.
2.5 Performance plots
Performance plots are shown for the system CO2/CH4 in PIM-1 at 35 °C in Fig. 11, reporting solubility selectivity versus solubility of CO2. Such a plot is inspired by the well known Robeson‟s plot between permselectivity and permeability. In Fig. 11a, the plot is based on solubility data of PIM-1 only. In pure gas (ideal) conditions it is seen that increasing pressure at constant mole fraction has the effect of lowering CO2 solubility in all cases, thus reducing the separation performance and increasing the departure from a hypothetical tradeoff curve. The effect of increasing pressure on the ideal solubility selectivity depends on the composition of the mixture: selectivity increases with pressure for mixtures poor in CO2 and it decreases for mixtures richer in CO2. On the other hand, when the real mixed gas behavior is considered, such trends are completely different. It can be observed in general that the real gas mixture behavior occupies a
1 2 3 4 5 6 7 8 9 10 11 12 13 14 15 16 17 18 19 20 21 22 23 24 25 26 27 28 29 30 31 32 33 34 35 36 37 38 39 40 41 42 43 44 45 46 47 48 49 50 51 52 53 54 55 56 57 58 59 60 61 62 63 64 65 27 much narrower region in the performance plot. Such an area is located, on the average, at lower values of solubility coefficient, and higher values of solubility selectivity, with respect to the area which represents the pure gas behavior.
In Fig. 11b the analogous data are reported also for PTMSP [19]: data in this case occupy a region of lower solubility coefficient and selectivity with respect to PIM-1, although the qualitative trends shown by the mixed gas behavior, and its relation with pure gas behavior, are similar for both polymers.
1 2 3 4 5 6 7 8 9 10 11 12 13 14 15 16 17 18 19 20 21 22 23 24 25 26 27 28 29 30 31 32 33 34 35 36 37 38 39 40 41 42 43 44 45 46 47 48 49 50 51 52 53 54 55 56 57 58 59 60 61 62 63 64 65 28 (a) 3 10 60 1 10 15 p p 9.6% CO2,mixed 19% CO 2, mixed 30% CO2, mixed 39% CO2, mixed 49% CO 2, mixed 9.6% CO 2,pure 19% CO2, pure 30% CO2, pure 39% CO 2, pure 49% CO2, pure S (C O 2 ) S (CO 2), cm 3 (STP)/(cm3(pol) atm) (b) 3 10 60 1 10 15 10% CO 2,pure 20% CO2, pure 50% CO2, pure 10% CO 2, mixed 20% CO2, mixed 50% CO2, mixed PTMSP PIM-1 9.6% CO2,mixed 19% CO2, mixed 30% CO2, mixed 39% CO2, mixed 49% CO 2, mixed 9.6% CO2,pure 19% CO2, pure 30% CO 2, pure 39% CO2, pure 49% CO2, pure S (C O 2 ) S (CO 2), cm 3 (STP)/(cm3(pol) atm)
Fig. 11. (a) Solubility selectivity versus CO2 solubility coefficient plot in PIM-1 at 35°C: ideal (pure gas) behavior and real (mixed gas) behavior. (b) Solubility
selectivity versus CO2 solubility coefficient in PIM-1 and PTMSP [19] at 35°C: ideal (pure gas) behavior and real (mixed gas) behavior.
1 2 3 4 5 6 7 8 9 10 11 12 13 14 15 16 17 18 19 20 21 22 23 24 25 26 27 28 29 30 31 32 33 34 35 36 37 38 39 40 41 42 43 44 45 46 47 48 49 50 51 52 53 54 55 56 57 58 59 60 61 62 63 64 65 29 3 Conclusions
The solubility of binary mixtures of methane/carbon dioxide in PIM-1 was studied at 35°C and different pressures and compositions, by a modified pressure decay method that allows also measurements at constant composition of the gaseous phase and variable total pressure. The solubility of CH4 is strongly impaired by the presence of CO2, while the solubility of the latter gas is less markedly lowered by the simultaneous sorption of CH4. Part of this phenomenon is not due to a special property of CO2 but simply to the fact that, in most cases, CO2 is the most abundant penetrant in the polymer matrix, as it was also observed in the case of other glassy polymers, PTMSP and PPO. As a consequence, the solubility selectivity of PIM-1 is higher than the corresponding ideal value evaluated at similar pressures and compositions. The deviations from pure gas behavior of both solubility and solubility selectivity values can be univocally correlated to the CO2 molar concentration inside the membrane. The solubility selectivity can actually be also lower than the ideal value, in those few cases in which the content of methane inside the membrane is higher than the content of CO2. Indeed the ratio between real and ideal selectivity increases with the ratio c(CO2)/c(CH4) and becomes unity when c(CO2)=c(CH4). Indeed for equimolar contents of gas inside the membrane, the extent of solubility depression is the same for both gases. A solubility-based Robeson plot can be drawn for this mixture in PIM-1 and compared to a similar plot for PTMSP: mixed gas data are shifted towards the upper part of the plot with respect to pure gas data.
1 2 3 4 5 6 7 8 9 10 11 12 13 14 15 16 17 18 19 20 21 22 23 24 25 26 27 28 29 30 31 32 33 34 35 36 37 38 39 40 41 42 43 44 45 46 47 48 49 50 51 52 53 54 55 56 57 58 59 60 61 62 63 64 65 30 References
1. R.W. Baker, K. Lokhandwala, Natural gas processing with membranes: an overview, Ind. Eng. Chem. Res. 47 (2008) 2109-2121.
2. S. Sridhar, B. Smith, T. M. Aminabhavi, Separation of carbon dioxide from natural gas mixtures through polymeric membranes - A review, Separation & Purification Reviews, 36 (2007), 113-174.
3. Y. Xiao, B. T. Low, S. S. Hosseini, T. S. Chung, D. R. Paul, The strategies of molecular architecture and modification of polyimide-based membranes for CO2 removal from natural gas - A review, Prog. Polym. Sci. 34 (2009), 561-580.
4. E. Favre, R. Bounaceur, D. Roizard, Biogas, membranes and carbon dioxide capture, J. Membr. Sci. 328 (2009) 11–14.
5. L.M. Robeson, The upper bound revisited, J. Membr. Sci. 320 (2008) 390–400.
6. R. T. Chern, W. J. Koros, E.S. Sanders, R. Yui, “Second component” effects in sorption and permeation of gases in glassy polymers, J. Membr. Sci. 15 (1983) 157-169.
7. L. M. Costello, W. J. Koros, Comparison of pure and mixed gas CO2 and CH4 permeabilities in polycarbonate: effect of temperature, Ind. Eng. Chem. Res. 32 (1993), 2277-2280.
8. K.C. O‟Brien, W. J. Koros, T. A. Barbari, E.S. Sanders, A new technique for the measurement of multicomponent gas transport through polymeric films, J. Membr. Sci. 29 (1986) 229-238. 9. C.A. Scholes, G.W. Stevens, S.E. Kentish, The effect of hydrogen sulfide, carbon monoxide
and water on the performance of a PDMS membrane in carbon dioxide/nitrogen separation, J. Membr. Sci. 350 (2010), 189-1999.
10. O.C. David, D. Gorri, A. Urtiaga, I. Ortiz, Mixed gas separation study for the hydrogen recovery from H2/CO/N2/CO2 post combustion mixtures using a Matrimid membrane, J. Membr. Sci. 378 (2011) 359-368.
11. S. Thomas, I. Pinnau, N. Du, M. D. Guiver, Pure- and mixed gas permeation properties of a microporous spirobisindane-based ladder polymer (PIM-1), J. Membr. Sci., 333 (2009) 125 – 131.
12. S. Thomas, I. Pinnau, N. Du, M. D. Guiver, Hydrocarbon / hydrogen mixed gas permeation properties of PIM-1, an amorphous microporous spirobisindane polymer, J. Membr. Sci. 338 (2009) 1 – 4.
13. N. Du, H. B. Park, G. P. Robertson, M. M. Dal-Cin, T. Visser, L. Scoles, M. D. Guiver, Nanosieve membranes for CO2 capture applications, Nature Mater., 10 (2011) 372 – 375. 14. P. Li, T.S. Chung, D. R. Paul, Gas sorption and permeation in PIM-1, J Membrane Sci, 432
(2013) 50-57.
1 2 3 4 5 6 7 8 9 10 11 12 13 14 15 16 17 18 19 20 21 22 23 24 25 26 27 28 29 30 31 32 33 34 35 36 37 38 39 40 41 42 43 44 45 46 47 48 49 50 51 52 53 54 55 56 57 58 59 60 61 62 63 64 65 31 propyne] and related polymers: synthesis, properties and functions, Prog. Polym. Sci. 26 (2001), 721-798.
16. P.M. Budd, B.S. Ghanem, S. Makhseed, N.B. McKeown, K.J. Msayib, C.E. Tattershall, Polymers of intrinsic microporosity (PIMs): robust, solution-processable organic nanoporous materials, Chem. Commun. (2004) 230-231.
17. P.M. Budd, E.S. Elabas, B.S. Ghanem, S. Makhseed, N.B. McKeown, K.J. Msayib, C.E. Tattershall, Solution-processed, organophilic membrane derived from a polymer of intrinsic microporosity Adv. Mater. 16 (2004) 456-459.
18. P. M. Budd, N. B. McKeown, B. S. Ghanem, K. J. Msayib, D. Fritsch, L. Starannikova, N. Belov, O. Sanfirova, Y. Yampolskii, V. Shantarovich, Gas permeation parameters and other physicochemical properties of a polymer of intrinsic microporosity: Polybenzodioxane PIM-1, J- Membrane Sci. 325 (2008) 851-860.
19. O. Vopicka, M. G. De Angelis, G. C. Sarti, Mixed gas sorption in glassy polymeric membranes: I. CO2/CH4 and n-C4/CH4 mixtures sorption in poly(1-trimethylsilyl-1-propyne) (PTMSP), J Membr. Sci. 449 (2014) 97-108.
20. E.S. Sanders, W.J. Koros, H.B. Hopfenberg, V. Stannett, Mixed gas sorption in glassy polymers: equipment design considerations and preliminary results, J. Membr. Sci. 13 (1983) 161-174.
21. E.S. Sanders, W.J. Koros, H.B. Hopfenberg, V. Stannett, Pure and mixed gas sorption of carbon dioxide and ethylene in poly(methyl methacrylete), J. Membr. Sci. 18 (1984) 53-74. 22. E.S. Sanders, Ph.D. Dissertation, North Carolina State University; 1983.
23. R.M. Barrer, J.A. Barrie, J. Slater, Sorption and diffusion in ethyl cellulose, part III. Comparison between ethyl cellulose and rubber, J. Polym. Sci. 27 (1958) 177-197.
24. W.J. Koros, Model for sorption of mixed gases in glassy polymers, J. Polym Sci., B: Polym. Phys. Ed. 18 (1980) 981-992.
25. F. Doghieri, G.C. Sarti, Nonequilibrium Lattice Fluids: a predictive model for the solubility in glassy polymers, Macromolecules 29 (1996) 7885-7896.
26. M.G. De Angelis, G.C. Sarti, Solubility of gases and liquids in glassy polymers, Annu. Rev. Chem. Biomol. Eng. 2 (2011) 97-120.
27. M. Minelli, S. Campagnoli, M.G. De Angelis, F. Doghieri, G.C. Sarti, Predictive model for the solubility of fluid mixtures in glassy polymers, Macromolecules 44 (2011) 4852–4862.
28. N. Du, G. P. Robertson, J. Song, I. Pinnau, S. Thomas, M. D. Guiver, Polymers of Intrinsic Microporosity (PIMs) containing trifluoromethyl and phenylsulfone groups as materials for membrane gas separation, Macromolecules, 41 (2008) 9656- 9662.
1 2 3 4 5 6 7 8 9 10 11 12 13 14 15 16 17 18 19 20 21 22 23 24 25 26 27 28 29 30 31 32 33 34 35 36 37 38 39 40 41 42 43 44 45 46 47 48 49 50 51 52 53 54 55 56 57 58 59 60 61 62 63 64 65 32 from novel disulfone-based monomers, Macromolecules, 42, (2009) 6023 – 6030.
30. W. M. Haynes, ed., Handbook of Chemistry and Physics, 92nd Edition (Internet Version 2012), CRC Press, Taylor and Francis, Boca Raton, FL.
31. R.D. Raharjo, B.D. Freeman, E.S. Sanders, Pure and mixed gas CH4 and n-C4H10 sorption and dilation in poly(dimethylsiloxane), J. Membr. Sci. 292 (2007) 45–61.
32. R.D. Raharjo, B.D. Freeman, E.S. Sanders, Pure and mixed gas CH4 and n-C4H10 sorption and dilation in poly(1-trimethylsilyl-1-propyne), Polymer 48 (2007) 6097–6114.
33. C.P. Ribeiro Jr., B.D. Freeman, Carbon dioxide/ethane mixed gas sorption and dilation in a cross-linked poly(ethylene oxide) copolymer, Polymer 51 (2010) 1156-1168.
34. R.C. Reid, J.M. Prausnitz, B.E. Poling, The Properties of Gases and Liquids, fifth ed., McGraw-Hill, New York, 1987.
35. O. Hölck, M. Böhning, M. Heuchel, M.R. Siegert, D. Hofmann, J. Membr. Sci. 428 (2013) 523-532.
36. B.J. Story, W.J. Koros, Sorption of CO2/CH4 mixtures in poly (phenylene oxide) and a carboxylate derivative, J. Appl. Polym. Sci. 42 (1991) 2613-2626.