Alternative Tolling Schemes for the San Jose Lagoon Bridge
byGeoffrey Kenzo Murase
B.S., Civil Engineering
University of California at Berkeley, 1990
Submitted to the Department of Civil and Environmental Engineering in partial fulfillment of the requirements for the degree of
Master of Science in Transportation at the
Massachusetts Institute of Technology May 1994
© Massachusetts Institute of Technology 1994. All rights reserved.
/¢ //
Signature of Author ...
~~~~~...
'I' ' '·' ;' "'· ... ...
. ....
Department Civil and Environment Engineering May 13, 1994Certified by ... .
-* --4;
~rofessor David H. Bernstein Thesis Supervisor
f,,
..-Accepted
by
...
-...-.
·
...-...
Professor Joseph Sussman Chairman, Departmental Committee on Graduate Students
Eng.
!
Gywl ^7
, ,uuNSTJTUTAlternative Tolling Schemes for the San Jose Lagoon Bridge
byGeoffrey Kenzo Murase
Submitted to the Department of Civil and Environmental Engineering on May 13, 1994 in partial fulfillment of the requirements for the degree of
Master of Science in Transportation
Abstract
The San Jose Lagoon Bridge in Puerto Rico is the first privatized toll facility built in the United States in over 40 years and will serve as a model for future privatization projects. This thesis explores the effects of different tolling schemes on revenues and users of the San Jose Lagoon Bridge. A model is constructed using the best available data for the bridge and the San Juan area. This model is then used to predict demand on the bridge under four different tolling schemes. The first tolling scheme is a flat-rate toll charged throughout the day, the second scheme has different peak and off-peak tolls, the third scheme has different toll rates for the a.m. peak, interpeak, p.m. peak, and off-peak periods, while the fourth scheme changes toll every hour. The results of the study show that if revenue maximization is the goal, then a lower flat-rate toll could be charged. If rate of return regulation for the private firm and optimal use by the public are the goals, then a much lower toll rate is found to be appropriate. A model for congestion management purposes is also developed as well as a model that uses price discrimination to differentiate between different trip purposes. The results of the analysis show that significant increases in revenue can be achieved using price discrimination.
Thesis Supervisor: Professor David H. Bernstein
Thanks To:
Professor David Bernstein, my thesis advisor, who provided me guidance throughout my two years at MIT not only for my thesis, but for my career as well. As a teaching assistant for his class in the Fall of 1993, his trust in me to grade papers as well as lead class discussions helped me mature as an individual. I wish him the best of luck at Princeton and continued success in the future.
Professor Tony Gomez-Ibanez at the Kennedy School of Government at Harvard for providing me with ideas and resources to accomplish my thesis. His class, Transportation Planning, Policy, and Management opened my eyes to a variety of transportation related issues that I had never even considered before.
Roderick Diaz for his help in assembling data and ideas about this thesis.
Harvey Janowitz of Vollmer Associates for providing me with data necessary to complete my thesis.
The many friends I have made here who have made my years at MIT all the more meaningful not only academically, but socially as well.
My parents, Kenji and Seiko, and my sister Emily for their moral support. Special thanks to my sister and roommate Mimi for proofreading much of my work.
Contents
Chapter 1 Introduction ... 17
1.1 Demand for Transportation in Puerto Rico . ... 18
1.1.1 Economic Development ... 19
1.1.2 Population and Auto Ownership Growth ... 21
1.2 Coping with Demand in Puerto Rico ... 22
1.3 The San Jose Lagoon Bridge Project ... 26
1.3.1 Financing ... 27
1.3.2 Termination Option ... 28
1.3.3 Traffic Studies ... 28
1.4 Thesis Objectives and Outline ... 30
Chapter 2 The Economics and Politics of Highway Projects ... 33
2.1 Financing Highway Projects ... 34
2.1.2 Vehicle Registration Fees ... 37
2.1.3 Parking Taxes, Fees, Fines ... 40
2.1.4 Toll Roads ... 42
2.1.4.1 Traditional Tolling ... 43
2.1.4.2 HOV Buy-in ... 45
2.1.4.3 Other Tolling Schemes ... 46
2.2 Congestion and Social Welfare . ... 47
2.2.1 The Congestion Problem . ... 48
2.2.2 Congestion Mitigation ... 48
2.2.2.1 Increasing Supply ... 49
2.2.2.2 Promoting Transit Use ... 49
2.2.2.3 Transportation Demand Management ... 50
2.2.2.4 Congestion Pricing ... 52
2.3 Public and Private Roles in Highway Projects . ... 56
2.3.1 Public/Private Partnerships ... 56
2.3.2 Privatization ... 58
2.3.2.1 The Trend Toward Privatization ... 59
2.3.2.2 Factors Influencing the Development ... 61
2.3.2.3 Obstacles to Privatization ... 62
2.3.2.4 Advantages of Privatization ... 65
2.3.2.5 Disadvantages of Privatization ... 68
2.4 Summary ... 70
Chapter 3 Development of a Demand Model ... 73
3.1 BaseData ... 74
3.2 Toll Sensitivity Functions ... 76
3.2.2 Constant Toll Elasticity Model ... 80
3.2.3 Exponential Model ... 82
3.3 Using the Revised Base Data ... 85
3.4 A Closer Look at Airport Related Traffic ... 87
3.5 A More Disaggregate Analysis ... 89
3.5.1 Trip Generation Model ... 90
3.5.2 Time-of-day Analysis ... 93
3.5.3 Direction Split Factors ... 105
3.5.4 The Resulting Disaggregate Models ... 106
3.5.5 Toll Sensitivity of Different Market Segments ... 108
Chapter 4 Analysis of Different Toll Policies ... 113
4.1 Revenue Maximization ... 114
4.2 Rate of Return Constraints ... 122
4.3 Incorporating Congestion Impacts ... 126
4.4 Price Discrimination ... 129
4.5 Model Limitations ... 132
Chapter 5 Conclusions and Future Research ... 133
5.1 Recommendations ... 133
5.2 Future Research ... 135
Appendix A Toll Sensitivity Calculations ... 139
Appendix B Revenue Maximizing Toll Rates ... 147
Gross Product of Puerto Rico ... 19
Manufacturing Gross Product ... 20
Vehicle Miles Traveled ... 21
Total Highway Mileage ... 22
Capital Outlays ... 23
Total Receipts ... 23
Total Federal Funding ... 24
Proceeds From Bonds ... 25
Bonds Outstanding ... 25
Total Gasoline Usage in Puerto Rico ... 36
Automobile Registrations ... 39
Truck Registrations ... 39
Bus Registrations ... 40
Linear Demand Model ... 78
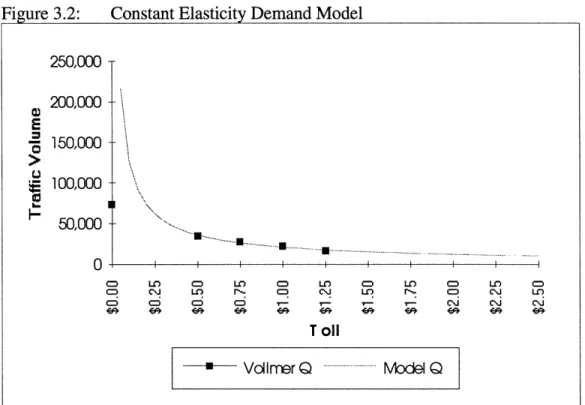
Constant Elasticity Demand Model ... 81
List of Figures
Figure 1.1: Figure 1.2: Figure 1.3: Figure 1.4: Figure 1.5: Figure 1.6: Figure 1.7: Figure 1.8: Figure 1.9: Figure 2.1: Figure 2.2: Figure 2.3: Figure 2.4: Figure 3.1: Figure 3.2:Figure 3.3: Figure 3.4: Figure 3.5: Figure 3.6: Figure 3.7: Figure 3.8: Figure 3.9: Figure 3.10: Figure 3.11: Figure 3.12: Figure 3.13: Figure 3.14: Figure 3.15: Figure 3.16: Figure 3.17: Figure 3.18: Figure 3.19: Figure 3.20: Figure 4.1: Figure B. 1: Figure B.2: Figure B.3:
Exponential Demand Model ... 84
Airline Landings at the Luis Munoz Marin International Airport ... 88
Total BAA Trip Time Distribution ... 94
Home-Based Work Trip Time Distribution ... 94
Home-Based Shop Trip Time Distribution ... 95
Home-Based School Trip Time Distribution ... 96
Home-Based Other Trip Time Distribution ... 97
Non Home-Based Trip Time Distribution ... 97
Earning a Living Trip Time Distribution ... 98
Civic, Educational, & Religious Trip Time Distribution ... 99
Family and Personal Business Trip Time Distribution ... 99
Social and Recreational Trip Time Distribution ... 100
Other Trip Time Distribution ... 100
Total NPTS Trip Time Distribution ... 101
Existing Traffic Conditions ... 102
BAA Model vs. Actual Traffic Counts ... 103
NPTS vs. Actual Traffic Counts ... 103
Average BAA vs. Actual Traffic Counts ... 104
Toll Rate vs. Revenue ... 124
BAA Revenue Maximizing Toll Rates ... BAA1 Revenue Maximizing Toll Rates ... NPTS Revenue Maximizing Toll Rates ...
148 149 .149
List of Tables
Table 1.1: Forecasted Traffic in 2010 for the San Jose Lagoon Bridge ... 29
Table 2.1: Revenue Sources for the PRHTA ... 34
Table 2.2: Gas Taxes in Perspective ... 35
Table 2.3: Vehicle Registrations in Puerto Rico ... 38
Table 2.4: Effects of ALS on Singapore Mode Split ... 55
Table 2.5: Reasons for Privatization ... 60
Table 2.6: Effects of Various Policies ... 70
Table 3.1: Illustrative Time and Distance Savings ... 75
Table 3.2: Results of the Vollmer Associates Traffic Study (1990) ... 76
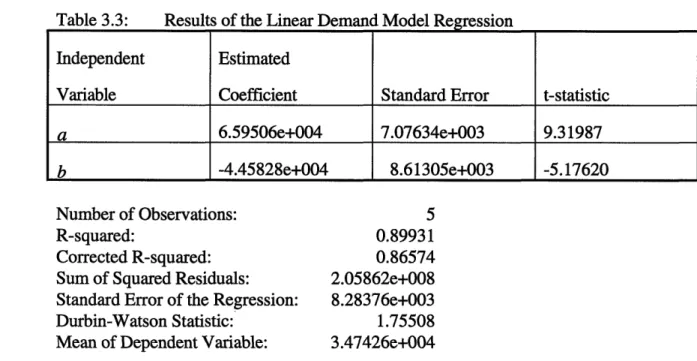
Table 3.3: Results of the Linear Demand Model Regression ... 78
Table 3.4: Vollmer Forecast vs. Linear Model Forecast ... 79
Table 3.5: Results of the Constant Elasticity Demand Model Regression ... 80
Table 3.6: Vollmer Forecast vs. Constant Elasticity Model Forecast ... 82
Table 3.8: Table 3.9: Table 3.10: Table 3.11: Table 3.12: Table 3.13: Table 3.14: Table 3.15: Table 3.16: Table 4.1: Table 4.2: Table 4.3: Table 4.4: Table 4.5: Table 4.6: Table 4.7: Table 4.8: Table 4.9: Table 4.10: Table 4.11: Table 4.12: Table 4.13: Table 4.14: Table 4.15: Table 4.16: Table 4.17:
Vollmer Forecast vs. Exponential Model Forecast ... 84
Vollmer Associates Demand Forecasts (1992) ... 86
1991 Trip Purposes From Survey Data ... 92
1991 Vehicle Trip Purposes From Survey Data ... 92
NPTS Trip Distribution by Purpose ... 93
Directional Trip Time Distribution ... 105
Directional Trip Time Distribution by Percentage ... 106
Usage of the Tolled Section in 1989 and 1990 ... 110
Toll Sensitivities ... 111
Revenue Maximizing Scenarios ... Results the BAA Model ...
Effects of the New Toll Rate on Traffic in Model BAA ... Results of the BAA1 Model ...
Effects of the New Toll Rate on Traffic in Model BAA1 ... Results of the NPTS Model ...
Effects of the New Toll Rate on Traffic in Model NPTS ... Variability in Toll Rates for All Models ...
Maximizing Use Scenarios Subject to Rate of Return Constraints.. Debt Service for the San Jose Lagoon Bridge ...
Toll Rates Required for a 19% Rate of Return ... Toll Rates Required to Break-Even ... Effects of Traffic Level on Travel Time ... Congestion Pricing Scenarios ... Price Discrimination Scenarios ... Price Discrimination Results ...
Effects of the Price Discrimination Toll Rate on Traffic ...
115 117 118 119 120 120 121 122 123 125 125 126 127 128 130 130 131
Table A. 1: Table A.2: Table A.3: Table A.4:
Toll Sensitivity Based on Income ... 143
Toll Sensitivity Based on Frequency of Choice ... 143
Toll Sensitivity Based on Length of Trip ... 144
Toll Sensitivity Based on Payment Method ... 144
Chapter 1
Introduction
Budgetary constraints and tax revolts have put a strain on government resources to construct and maintain the transportation infrastructure necessary to sustain mobility in the United States. Consequently, the interest in the use of private capital to construct transportation improvements has increased dramatically in recent years. The passage of the Intermodal Surface Transportation Efficiency Act (ISTEA) in 1991 has addressed this growing interest by authorizing use of federal highway funds to construct privatized facilities.
The innovative use of private capital to finance public works projects has raised many interesting questions. How should private firms be regulated by the government to insure that excessive profits aren't being made? Who benefits and who pays when a private toll facility is built? The future of privatized toll roads in the United States is uncertain at this time. The projects currently being developed have encountered many obstacles and will serve as prototypes by which the merits of privatization can be measured. However, they must be evaluated as prototypes, taking into account factors unique to the first-time, experimental nature of prototype projects in general.
Puerto Rico has taken a lead role in using privatization to finance transportation improvements. The demand for transportation in Puerto Rico coupled with a lack of funds available to construct improvements has forced the government to use privatization to finance their projects. The first such privatized project in Puerto Rico is the San Jose Lagoon Bridge. This is the only privately owned and operated facility built in the post-Interstate era in the United States. The lessons learned from the experiences of the San Jose Lagoon Bridge will help projects in the future address issues unique to privatized projects.
This chapter motivates the research through a discussion of demand for transportation in Puerto Rico as well as a discussion of the lack of available funds to construct improvements. Then, a brief description of the bridge project is given and the main research objectives are outlined. The chapter concludes by laying out the structure of the remainder of the thesis.
1.1 Demand for Transportation in Puerto Rico
The growth in Puerto Rico's economy and population has created a need for an efficient transportation network to serve its business and citizens. Puerto Rico's economy has been growing at a fast pace and has raised the standard of living of its people. This growth in the economy has resulted in an increase in demand for transportation not only by business but by the citizens as well. Population growth has been accompanied by an increase in auto ownership which has further strained the transportation network of Puerto Rico.
1.1.1 Economic Development
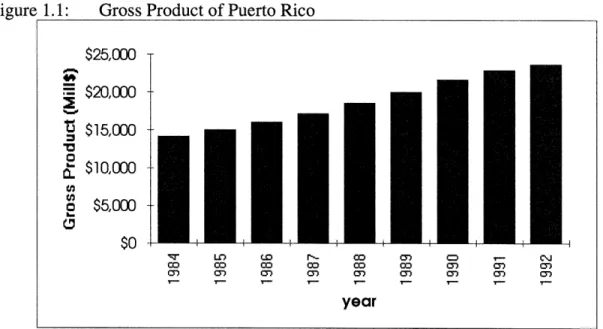
The future of Puerto Rico's economic growth depends largely on the investment in transportation that it makes today. The Puerto Rico Highway and Transportation Authority (PRHTA) has been aggressively pursuing expansion of its transportation infrastructure to keep up with the increased demand that the growing economy is placing on existing facilities. Since 1980, the gross product has more than doubled from $11 billion to over $23.6 billion. Although this growth has leveled off recently, the overall trend remains up as shown in Figure 1.1.
Figure 1.1: Gross Product of Puerto Rico
-4- -I Iqr LO cm r-_ CD cD M cD co cc C" C" CD CM C" mc cc c m year year -.i cc C Cm cD cw C" cD cc
Source: Statistical Abstract [1993]
Much of Puerto Rico's economic growth can be attributed to the growth in the manufacturing sector of the economy. In 1992, the manufacturing sector accounted for over 55% of the gross domestic product. According to a Department of Labor and Human Resources household survey, the manufacturing sector employed 155,000 workers, or 16.8% of total employment in fiscal 1991 (Bond Prospectus [1992]). The
$25,000 $20,000
2
$15,000 0 X $10,000 o $5,000 $0 vmain recipient of manufactured goods is the mainland United States. Many mainland companies have located manufacturing plants in Puerto Rico since the average hourly manufacturing wage in Puerto Rico is only approximately 53% of the average mainland United States rate (Bond Prospectus [1992]). Some of the largest employers include General Electric, Johnson and Johnson, and Westinghouse Electric. Puerto Rico's manufacturing gross product has increased by 78% since 1984 (as shown in Figure 1.2) while the total gross product has increased by only 67% over the same period.
Figure 1.2: Manufacturing Gross Product
-I -I-or- uL cm X - CD w C C C C Co O" Cm C C year -I Cn ' _' c Co Co Cn C" Co 0) cm - Co - Co_
Source: Statistical Abstract [1993]
In addition to manufacturing, a growing sector of the economy is the tourism industry. In 1991, tourism accounted for 6.3% of the island's gross product with tourist expenditures reaching $1.4 billion, an increase of 51% over 1987 expenditures. In fact, the total number of visitors reached 3,517,425 in 1991, a figure almost equivalent to the entire population of Puerto Rico (Bond Prospectus [1992]).
$14,000 " $12,000 5
$10,000
$8,000 E $6,000 w { $4,000 E $2,000 $0 v -I1.1.2 Population and Auto Ownership Growth
According to the U.S. Bureau of the Census, the population of Puerto Rico in 1990 was 3,522,000, representing a 9.9% increase over 1980 levels. Over the same period, the number of vehicle registrations skyrocketed by 56.9% to 1,321,627 (Highway Statistics [1980,1990]). The huge increase in vehicle registrations may be due to the rise in average compensation which increased from $9,563 in 1980 to $15,351 in 1990 in nominal dollars, a 60.5% increase. In addition, the unemployment rate showed a modest decline from 17.0% in 1980 to 14.2% in 1990. However, by 1992, this figure increased to
16.5% (Statistical Abstract [1993]).
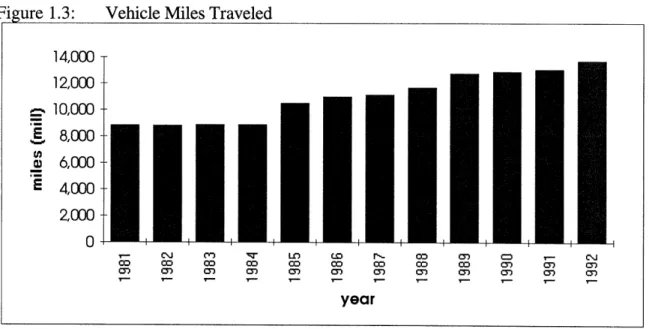
The growth in vehicle ownership has consequently led to an increase in number of vehicle miles traveled (VMT) as shown in Figure 1.3.
Figure 1.3: Vehicle Miles Traveled 14,000 -12,000 10,000 -E 8,000-X 6,000-E 4,000 2,000 -0- --I
7- C\J M v ir) LOD
ra-csc ccr cc c ccy cc ccr
Oa C0 a) a) 0C C) CD
7t- r - 'r 7- " - . r- , -y
-year
Source: Highway Statistics
4 co a cm CJ co Cc 0) C C0 0 ) 0 ) 0 ) 0 ) 0 ) [1981-1992]
-1.2 Coping with Demand in Puerto Rico
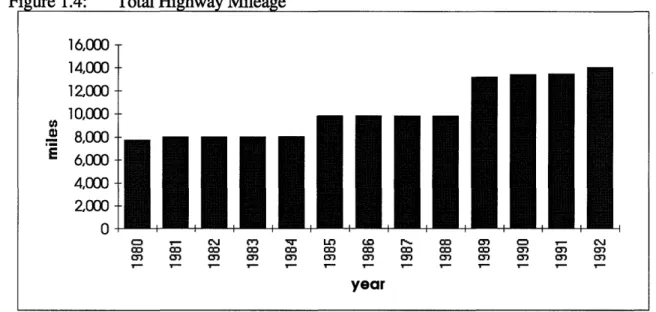
An analysis of various key statistics published in the Federal Highway Administration's publication Highway Statistics provides a good insight into how the PRHTA is dealing with the demands that the economy and population is placing on the transportation infrastructure. In order to accommodate increased demand, the PRHTA
has steadily increased the amount of highway mileage available as shown in Figure 1.4.
Figure 1.4: Total Highway Mileage
Source: Highway Statistics [1980-1992]
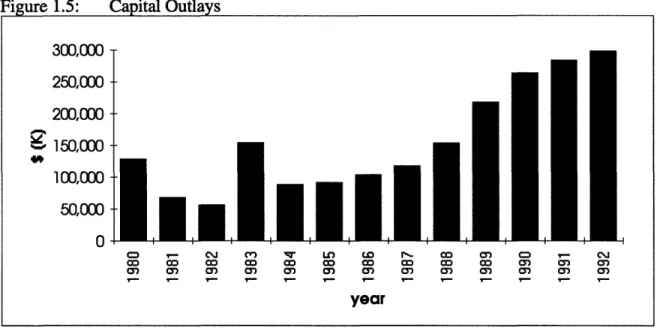
The increase in highway mileage did not come without expense, however. Over the same period, capital outlay has increased dramatically as shown in Figure 1.5.
The large increase in capital outlay was offset somewhat by an increase in total receipts (as shown in Figure 1.6), partially due to revenue from user fees such as gas taxes. A majority of the increase in total receipts, however, is due to an increase in the number of bonds issued by the PRHTA.
1 IA Vn _ 1 Afn -12,000 -10,000 · ,KJ E 6,000-4,000 2,000 n-m _ c J on M r M C rat CD cn VQ : C:D CO C C ' , CD CD CO CD a) C i OC' year I U'~UU a] 0' I v 4I -I- -I- -I
Figure 1.5: Canital Outlays
Source: Highway Statistics [1980-1992]
Figure 1.6: Total Receipts
1,200,000
T
1,ooo000, -800,000 -. - 600,000 fl fmn-- I _I o _ cv M or LO L r CD I - CS] CD W aD CD CD CD C3 CD CD C cn C Co Co Co Co Co Co Co Co CO Co oM aM o 07 ow Co O O~ cn 07 07 07 0 0 7 07 yearSource: Highway Statistics [1980-1992]
That portion of total receipts from federal funding has remained relatively stable over this period due to apportionment based on formulas. The Fiscal Year 1993 apportionment is expected to be $88.47 million. However, this apportionment is
200,000 0 4-I 300,000 250,000 200,000 150,000 100,000 50,000 0 co T- ClI M' s Luo W r- Co 0 - cM Co Co Co CO CO Co CO Co Co Co 0 0 0 year I~~~ i/ I I 4 4 -q
decreased by $6.5 million because of the minimum drinking age penalty resulting in a net allocation of $81.98 million (Parker [1992a]). The Minimum Drinking Age Penalty is 10% of the apportionment provided under the Surface Transportation Program, the National Highway System, and the Interstate Maintenance Program. Total federal funding for Puerto Rico is shown in Figure 1.7.
Figure 1.7: Total Federal Funding
Source: Highway Statistics [1980-1992]
As mentioned earlier, since federal funds have remained relatively constant over this period, the PRHTA has issued bonds to supplement their income to construct transportation improvements (see Figure 1.8). Between 1980 and 1991, the PRHTA had issued bonds in relatively modest amounts.
However, in 1992, an unprecedented $612 million worth of bonds were issued by the PRHTA. This may have been a good move by the PRHTA due to a favorable interest rate environment but the issue also places great pressure on the PRHTA to keep up with debt service payments and maintain an adequate debt coverage ratio.
100,000 T 90,000 80,000 70,000 60,000 i 50,000 " 40,00030,000 -20,000 10,000 n _ M q 1 D W o M _ CM Cn CD Co Co Co CD Co Co Co Co O" M 0) 0'3 0 0'3 03 0'3 Or 0') 0 0'3 0') 0) 0' 0' T- - r " '"'- " ya- ""- ' -year PY
Puerto Rico's aggressive issuance of debt has resulted in over a billion dollars in bonds outstanding as shown in Figure 1.9.
Figure 1.8: Proceeds From Bonds /UULU 600,000 500,000 g 400,000
'*
300,000200,000-
_-cm Cj c' R U) M rl- cc C) cCIJ cc cc cc cc cc cc cc cc cc co Cn MC C C) a) C0 C C) C) 0) ) 0) ) 0) a) ) 7 - ""- 1- 7 7 " . .--yearSource: Highway Statistics [1980-1992]
Figure 1.9: Bonds Outstanding 1,400,00 T 1,200,000 1,000,000
I
-
rnm
n
-Mw 600,000-400,000 200,000 -{3 4
U111
4 . -C-'J 'IT L CD r- Mc O_ ,- c-J O N CO C) C C C0 C)' ) C) 0:1r W C D CO ~ O --- 1"- - -1~ v- " 7- 1- 7'- ¶ v- -- 7- -yearSource: Highway Statistics [1980-1992] 100,000 -0 - l l - l - l l - l - | l v + d- d-7no nore I F / . i .
The interest payments on these bonds must be made and an adequate debt service coverage ratio must be maintained in order to retain a favorable credit rating. These ratings will be used to grade bonds issued in the future and a favorable credit rating would result in lower interest payments for future bond issues. Therefore, the PRHTA has looked to the use of private capital to further develop its transportation network without placing an additional strain on its own finances.
1.3 The San Jose Lagoon Bridge Project
The demands placed on Puerto Rico's transportation infrastructure has far exceeded the resources available to accommodate the needs of its economy and its people. Consequently, the government has looked at alternative ways to finance transportation improvements. One method being implemented is privatization. The government has currently authorized the privatization of two new facilities, the San Jose Lagoon Toll Bridge and the PR 66 Toll Road. Privatization of highways has gained greater exposure in recent years and the lessons learned from these facilities will help ease the implementation of future privatization projects.
The San Jose Lagoon Bridge project is the first of two highway projects identified by the Puerto Rico Highway and Transportation Authority for development through privatization. The second project, the PR 66 Toll Road, will connect San Juan with Fajardo and will begin construction after the San Jose Lagoon Bridge. The bridge is approximately 2.1 miles long and connects Luis Munoz Marin International Airport near PR 26 with the Municipality of Carolina to the south near PR 181. The bridge has two lanes in each direction and has a toll plaza with 10 toll booths at the south end.
On March 27, 1992, the Concession Agreement was signed by Autopistas de Puerto Rico (APR), a consortium consisting of Dragados y Construcciones (the largest construction conglomerate in Spain), Rexach Construction Company (the largest general
contractor in the Commonwealth), and Supra and Company (a special partnership). Under the terms of the Concession Agreement, APR will operate the toll road under the Build Transfer Operate (BTO) scheme for 35 years until the year 2026. The BTO scheme transfers liability from APR to the PRHTA during operation of the bridge. However, APR is still liable for any events that occur during construction.
1.3.1 Financing
While the San Jose Lagoon Bridge is touted as a privatization project, the government still plays a vital role not only in regulation, but also in financing the $126 million project. Before 1986, states were able to issue government-backed debt and loan the proceeds to private developers. However, the law permitting this type of financing was repealed as part of the 1986 Tax Reform Act, except in Puerto Rico. The Commonwealth of Puerto Rico is unlike states in that it is a separate tax jurisdiction and can issue tax-free government-backed revenue bonds for private projects. These bonds carry a significantly lower interest rate than bonds issued by corporations because they are tax-free and guaranteed by the PRHTA. The PRHTA issued $117 million worth of special facility revenue bonds in 1992 and lent the proceeds to APR. APR financed the remaining $9.4 million and agreed to a guaranteed maximum price of $83 million for constructing the bridge. This price is based on an overhead and profit fee equal to 14.42% of the aggregate construction costs. In order to make the bonds more palatable to investors, as part of the Concession Agreement, it is the PRHTA's responsibility to secure all rights-of-way and obtain the necessary permits to complete the project.
1.3.2 Termination Option
A unique provision in the Concession Agreement gives APR the right to terminate the contract if traffic levels do not meet certain criteria. If any of the following occur on a cumulative basis for six month periods, APR may be released from its obligation to
operate the toll road and transfer ownership of the bridge to the PRHTA:
* during the first 3 years of operation, traffic levels are less than 80% of forecast;
* during the fourth through sixth years, traffic levels are less than 85% of forecast;
* during the seventh and eight years, traffic levels are less than 90% of forecast; or
* during the ninth year until termination, traffic levels are less than 100% of forecast.
Furthermore, if the contract is terminated, the PRHTA will have to pay APR a rate of return of 12.5% on any capital contributed up to that point for the development, design, construction and operation of the bridge.
1.3.3 Traffic Studies
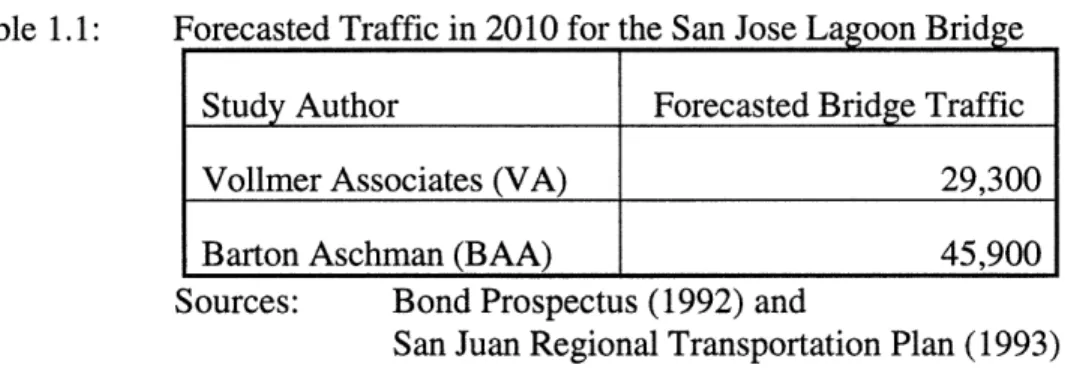
In order for APR to receive financing for the project, Vollmer Associates was hired to perform a traffic analysis to determine whether or not toll revenues would cover debt payments. In addition, as part of the San Juan Regional Transportation Plan study, Barton Aschman Associates performed a traffic study that included the San Jose Lagoon Bridge. Table 1.1 summarizes the results of both studies for the year 2010.
Table 1.1: Forecasted Traffic in 2010 for the San Jose Lagoon Bridge
Study Author Forecasted Bridge Traffic
Vollmer Associates (VA) 29,300
Barton Aschman (BAA) 45,900
Sources: Bond Prospectus (1992) and
San Juan Regional Transportation Plan (1993)
The two estimates differ significantly from one another due to the different methodologies used to derive their estimates. Vollmer Associates based their figure on travel time and distance savings while BAA used a complex trip generation model for the entire San Juan Region to achieve their estimate. Both studies took into account the toll in each direction for passenger cars and the availability of alternate free routes. However, for passenger cars, Vollmer Associates used a toll rate of $2.80 while BAA used a toll rate of only $1.50. Debt service is projected to be $18.24 million in 2010 dollars while projected revenues are expected to be $29.3 million using the Vollmer forecast and $25.1 million using the BAA forecast. Even with the more conservative estimate, traffic is estimated to be sufficient to cover debt payments and provide a profit for the private firm.
However, if traffic levels do not meet the criteria outlined under the termination option, a tremendous burden will be placed on the PRHTA to not only pay APR, but also keep up with debt service payments which range from a low of $7.4 million in early years to a high of $21.5 million in the year 2013 (Bond Prospectus [1992]). The PRHTA has many other projects to manage including the Tren Urbano rail project and must be prepared financially to deal with this prospect of termination. If a need for funds arises, then methods outlined in the next chapter could be used to raise revenues.
In addition, the bridge itself may be a source of revenues. The focus of the fourth chapter is determining the effects of alternative tolling schemes on the San Jose Lagoon Bridge on both traffic and revenues.
1.4 Thesis Objectives and Outline
Puerto Rico faces many challenges in the future regarding financing its transportation improvements. There are two main objectives of this research:
1) To assess various methods that can be used to finance Puerto Rico's transportation improvements.
2) To look at alternative tolling schemes for the San Jose Lagoon Bridge and their effects on both revenues and the users.
Chapter 2 examines several methods currently being used to raise revenues as well as other financing strategies. First, conventional methods are discussed and the applicability to Puerto Rico is addressed. Then, congestion pricing is discussed as a method of not only raising revenues, but managing congestion as well. The use of road pricing allows the development of privatization and the following section examines the various obstacles, advantages, and disadvantages of privatization. The final section summarizes the various financing policies discussed in the chapter.
Chapter 3 outlines the development of the model that will be used to determine the effects of different toll rates on the San Jose Lagoon Bridge. Various previous studies were used to develop the model. First, calculations from Vollmer Associates are presented and used to construct a basic demand model for the area. Then, data from Barton Aschman Associates are used to disaggregate demand into distinct market
segments with unique travel trip-times. The next section discusses the price sensitivities of these different market segments and how they react to changes in tolls.
Chapter 4 presents the results from the model. The effects of different scenarios on both revenue and users are discussed and summarized. First the objective of revenue maximization is examined. The second objective is to maximize use by the public using a rate of return constraint. Then, the possible use of congestion pricing is addressed. The fourth section examines price discrimination as a way of maximizing revenues and discusses possible implementation strategies. Conclusions and recommendations are then discussed in Chapter 5.
Chapter 2
The Economics and Politics of
Highway Projects
The significant capital investment required to build highways is always an issue of political debate when considering a new project. The methods used to raise revenues to pay for transportation improvements must be analyzed both from a financial and political perspective. These matters can be addressed by answering the questions; how much revenue will this measure raise and who will be affected? In addition, the effects of the new project on the environment and the economy are also key points that must be addressed before a project is approved.
This chapter first identifies various methods that can be used to raise revenues and their political implications. Then, the effects of congestion are discussed and the use of congestion pricing is examined as a possible solution. The third section discusses public/private partnerships as a way of leveraging public funds to finance transportation improvements. A comprehensive assessment of privatization efforts is discussed in this section including a summary of the relative advantages and disadvantages of privatization. Finally, the fourth section sums up the arguments for and against each method.
2.1 Financing Highway Projects
There are a variety of methods that governments can use to raise revenues, each having different effects. These methods may be used individually or in combination depending on how much revenue is needed and the possible effects of each policy. Some of the most common policies include:
* raising fuel taxes
* raising vehicle registration fees * raising parking fees
* tolling facilities
* public/private partnerships
A breakdown of current (1992) revenue sources gives a good indication of what policies the PRHTA might want to pursue in the event of a revenue short-fall. The sources of revenue are summarized in Table 2.1.
Table 2.1: Revenue Sources for the PRHTA
Revenue Source % of Total Receipts
Motor Fuel Taxes 35.62%
Motor-Vehicle and Carrier Taxes 15.73%
Toll Receipts 15.93%
Federal Funding 17.96%
Interagency Payments 0.50%
Miscellaneous Receipts 14.26%
2.1.1 Fuel Taxes
Raising fuel taxes is perhaps the easiest method to increase revenues for transportation purposes. No special facilities are needed to collect the revenues and the revenue stream is fairly constant from year to year. Gasoline taxes are also used widely as a source of revenue because the user is directly charged depending on how much fuel is consumed. However, raising fuel taxes is very controversial politically. Arguments against raising fuel taxes include the effect that it has on a region's economy (ITE [1989]). Fuel is one of the most important resources needed for industrialized areas and an increase in the fuel tax could have an adverse effect on competitiveness with other regions which may result in lost jobs. Legislation is usually required to adopt a gas tax increase and the debate surrounding the advantages and disadvantages may cause significant delay in implementation or defeat in legislation. For example, an issue in the 1992 election for President of the U.S. was the magnitude of raising the fuel tax in the future. Even a small proposed increase caused much political debate even though the U.S. has one of the lowest gas taxes in the world as shown in Table 2.2.
Table 2.2: Gas Taxes in Perspective
Country Tax per Gallon
Italy $3.56
France $2.80
Germany $2.59
Britain $2.21
Japan $1.63
United States (average) $0.34
A fuel tax increase may also be warranted just to keep the revenue stream constant because improvements in gasoline mileage may cause a decrease in revenues even with increased vehicle miles traveled (Felgner [1988]).
Gasoline taxes are the most important revenue source for the PRHTA. In 1992, revenues related to motor fuel taxes amounted to $147.6 million and made up 35.6% of its revenues excluding revenue from bond issues (Highway Statistics [1992]). Puerto Rico has not raised its gas tax rate since 1976. The rate of 16 cents per gallon charged by the Commonwealth is less than half the average rate charged by the mainland states (Parker [1992b]). However, to qualify this statement, it must be noted that Puerto Rico's per capita income is much lower than the states'. Gasoline usage in Puerto Rico is rising and in 1992 amounted to 961,755,000 gallons (see Figure 2.1).
Figure 2.1: Total Gasoline Usage in Puerto Rico
1,000,000 T (9I.I1[1 + 800,000
-2 700,000
4 600,000 c 500,000 = 400,000 t 300,000 200,000 100,000 n M ~CJ M 'W Lf M~ r- ~ O CO M CJ OO O C CO O O C O O CO O CO C_ CM C CO CO C M CO C CO CO CO Cy Ce yearSource: Highway Statistics [1992]
Gasoline use in Puerto Rico has been increasing steadily over the past decade with a slight decrease in usage in 1991. As noted earlier, fuel is one of the most important inputs for a growing economy and the effects of an increase in the fuel tax could possibly
4 4
*1-I
V
-L
-4--disrupt business. However, from a broader perspective, if a moderate increase is imposed and used to construct or repair transportation infrastructure, the Commonwealth may ultimately benefit from such an increase.
In order for gasoline tax increases to become politically acceptable, users must be aware of the transportation improvements that will be funded by such measures and the potential benefit they may ultimately have on the individual (ITE [1989]).
2.1.2 Vehicle Registration Fees
Vehicle registration fees can be collected based on either vehicle weight, vehicle class, or miles traveled. An advantage of using vehicle registration fees as a source of revenue is that it is a stable source of income, much like fuel taxes. However, fees do not generate revenues that are proportional to damage inflicted to the road and highway use unless the weight of the vehicle and the mileage driven are taken into consideration. Collecting this type of data can be labor intensive and may increase evasion. The structure of rate increases should be considered carefully, taking into account the goals of the government. For example, the structure of Indonesia's registration fee in 1985 turned out to actually be detrimental to their highway system (Kennedy School of Government [1986]).
The registration fee in Indonesia was based on vehicle price and class of vehicle. Higher rates were charged to passenger cars while lower rates were charged to pickups and trucks. This scheme was first instituted in hopes of promoting use of pickups and trucks in building the economy. However, by 1986, 50-100 small manufacturers were creating passenger vehicles by fitting light pickup chassis with passenger van bodies. Because these vans were based on a pickup chassis, they were classified for tax purposes as trucks and thereby escaped the heavier duties and taxes applied to passenger sedans.
The result was a high growth rate in trucks and buses which consequently increased infrastructure needs by causing more damage to pavements and increasing congestion.
Vehicle registrations have been increasing in Puerto Rico and in 1992, there were 1,595,328 vehicles registered. Table 2.3 breaks down these vehicles by class.
Table 2.3: Vehicle Registrations in Puerto Rico
Vehicle Type Number of vehicles registered
Automobiles 1,380,213
Trucks 212,028
Buses 3,087
Total 1,595,328
Source: Highway Statistics [1992]
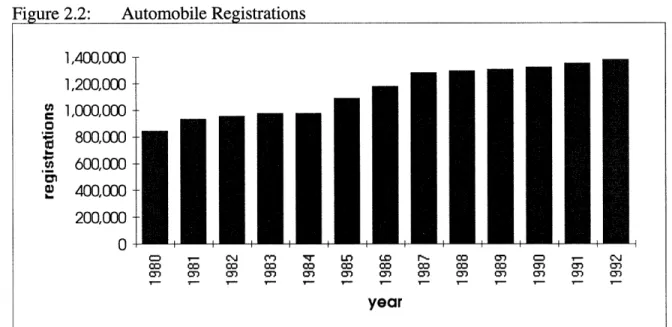
The PRHTA currently receives $15 per vehicle in annual registration fees generating approximately $24 million per year (Parker [1992b]). A $1 increase in vehicle registration fees would increase revenues by approximately $1.6 million assuming no decrease in number of registrations. Growth in the three different classes of vehicles is shown in Figures 2.2, 2.3 and 2.4.
The number of automobile registrations saw a sharp rise in the mid 1980's but has recently leveled off (see Figure 2.2). However, as shown earlier, the number of vehicle miles traveled has actually increased in recent years. This means that automobile use is increasing in terms of vehicle miles traveled per registered vehicle. Truck registrations have also experienced a similar pattern in registration growth as shown in Figure 2.3.
F
Source: Highway Statistics [1980-1992]
Figure 2.3: Truck Registrations
250,000 T 200,000 -4 C . 150,000 0,0 50,000 -0
0~~~~~~~
+
+I
-4
-cO CIJ M ' W r N C Co w C) C )o 2o" 0C C) ) C) C) M M C) yearSource: Highway Statistics [1980-1992]
The number of bus registrations, on the other hand, has experienced a sharp increase in recent years as shown in Figure 2.4.
+ 4 4 1,400,000 1,200,000 0 1,000,000 0
t 800,000
*I ii600,000
b 400,000 200,000 0 CD o "-r'- U) W r-- C 0 C'rJ Co co co co co C co co C co W c0 c) 0) 0) 0n 0) 0 cn 0) 0) 0) a) cn year A . I I -(-I -4Figure 2.4: Bus Registrations 4 CD - C"'J Co co o (2 r'- 'r- C5 CI m-± OD s] LO LO r- Co C CO C CO C CD CM CO CO '3 m ar 0 year 4 CD CJ M c M c d -C~m O)
Source: Highway Statistics [1980-1992]
There was a huge jump in bus registrations between 1988 and 1989. Bus and truck registrations should be treated separately from automobile registrations depending on the goals of the government. Trucks are used mainly for business applications while buses are a more efficient means of transporting people than automobiles.
2.1.3 Parking Taxes, Fees, Fines
Growth of the United States economy has resulted in a labor force expansion that has increased the number of workers and the number of work-trip commuters in metropolitan areas. In addition, the growth of the economy has increased the standard of living of individuals which has resulted in an increase in vehicle availability. With a higher standard of living and an increase in vehicle availability, a large portion of the work force has decided to live in suburban areas, away from the hustle and bustle of the big cities. Consequently, demand for parking spaces in central business districts has increased.
3,500 -3,000 ' 2,500 0 '~ 2,000 I-. 1,500 0, X 1,000 -500 0-/
With a limited supply available to accommodate demand, parking taxes could be imposed up to the point where demand equals supply, which would result in an increase in parking revenue. The advantages of regulating parking rates is not limited to the potential revenue gained. Regulating parking rates can also indirectly alter driver behavior and control much of the auto use during peak hours. People who have to travel into the city will have four choices:
* make the trip and pay the higher parking rate; * make the trip at a later time;
* make the trip using another mode (e.g. bus); or * not make the trip at all.
Higher income individuals are more likely to be able to afford the higher parking rate while lower income individuals are more likely to make the trip using another mode or not at all. Therein lies one of the major disadvantages of using parking rates to either raise revenues or control traffic. Equity concerns are not the only problem related to raising parking rates. Business may also be affected by less traffic in their area and these costs may outweigh the benefits of parking rate increases from a societal perspective. Those whose time is valuable are the first to attempt to buy their goods in less congested suburban centers, while those whose time is least valuable tend to shop in congested areas (Fixler [1987]). This means that business in congested areas would not be able to attract higher income individuals who may be more likely to buy products or acquire services.
The excess demand for parking spaces in San Juan during peak hours may serve as a possible revenue source for the PRHTA. A study completed by Barton Aschman Associates (BAA) in February 1992 found that only 58 % of this demand was being met by available parking spaces during peak hours (Econometrica [1992a]). This suggests that
parking in the area is currently underpriced and there is potential to raise prices to increase revenue.
The Department of Consumer Affairs is responsible for establishing parking rates in Puerto Rico. In order to increase revenue, parking rates could be set at higher levels during peak hours and lower levels during off-peak hours. In addition, all-day parking could be differentiated from short-term parking in order to offset any adverse effects parking regulation might have on local businesses. With more short-term parking available, shopping trips would not be as suppressed and businesses would not be as badly affected. By discouraging all-day parking, commuters would be forced to use public transit or carpool.
Peak period pricing would not only increase revenue, but would ensure optimal use of the facility by the public as well. However, proper regulation would be required to make sure private operators do not receive windfall profits from a parking rate increase.
As with toll rate increases, the effects of parking rate increases are difficult to determine. With the addition of the Tren Urbano rail system, demand may decrease for parking in the central business district or become more elastic and a rate increase may result in under-utilization of parking facilities. On the other hand, increased use of transit may spur more auto use as highways become less congested and demand for parking
spaces may remain the same.
2.1.4 Toll Roads
Tolling of roads is the most direct form of charging the user. Vehicles can be charged not only based on the costs that they impose on maintenance of the facility, but also the costs they impose on other vehicles by adding to congestion. A toll schedule can be set up so that vehicles are charged based on size, weight, number of axles, and distance traveled to recoup the costs of the damage that the vehicle inflicts on the road. Similarly,
a toll schedule that changes over the course of the day can be used in an effort to spread demand more evenly between peak and off-peak hours. Existing facilities would be used more efficiently and capital improvements could be delayed. A particularly interesting tolling scheme is the "HOV Buy-in" where a single occupancy vehicle may "buy into" an existing carpool lane. In addition, other innovative tolling schemes such as head-of-the-line privileges may be used to raise revenues or alter driver behavior.
2.1.4.1 Traditional Tolling
The use of toll financing enables governments to construct or repair facilities that otherwise would take longer to finance through conventional tax sources alone (Wuestefeld [1988]). Governments finance toll facilities by issuing bonds that use toll revenues to cover debt service. The large up-front capital cost of construction is effectively amortized over long periods of time and this type of financing makes construction of new facilities more manageable for the government. Users benefit by being able to use a facility sooner than if it was financed through taxes but would also have to pay a toll. Since bond issues are based on toll revenues, traffic flows are the key variable that determine whether or not a facility can be financed through tolls and consequently, makes traffic forecasting a critical issue.
The history of traffic levels on existing roads makes tolling of existing facilities a less risky proposition than tolling a new road. These traffic levels could be adjusted to reflect the elasticity of using the facility with respect to the new toll rate in order to forecast demand. However, implementation of tolls on existing facilities would be much more difficult politically than on a new facility because users would not be used to paying for something that they had received for free in the past. However, a Roper Organization poll found that only 12 % of the population oppose tolls in any form as long as they
perceive a benefit such as quicker, safer trips on a road that's quickly built and in better repair (Felgner [1988]).
Tolling is not without disadvantages, however. The drawbacks to tolling include the increased cost of constructing and operating a toll facility and the political obstacles that tolling faces. A 1983 study found that the cost of toll collection averaged about 18% of gross toll revenues compared to 1% of gross revenues for collection of motor-fuel taxes (Wuestefeld [1988]). However, with the use of Automatic Vehicle Identification (AVI), these costs may be reduced significantly in the future (Gomez-Ibanez [1992]). Users may perceive a toll as a form of double taxation since they already pay gas taxes (Feigner [1988]). In addition, tolling has distributional effects and opponents argue that it is unfair to poorer users. Literature on the distributional effects of road pricing shows that where there is a high rate of vehicle ownership it would be regressive because costs would fall most heavily upon lower-income drivers who would be forced to change from road to public transit (Borins [1988]). Tolls are more likely to be regressive if they replace a highly progressive tax or enable government to provide a program that benefits mainly the rich, and to be progressive in the opposite cases (Small [1983]). Though, with tolls, users are usually able to choose between the tolled route and an alternate free route which may, however, be more circuitous or congested (Felgner [1988]).
Toll rates in Puerto Rico were raised for the first time in almost 20 years of operation in 1991-92, and has increased revenues by about $18 million per year to approximately $60 million (Parker [1992b]). An analysis by Econometrica, a Puerto Rico economic consulting firm, showed that traffic volumes did not change significantly from previous levels before the toll increase, suggesting that demand for the toll roads is fairly inelastic (Econometrica [1992b]). The study further projects the additional revenues that can be achieved by raising rates further in 2002-2003. Should the PRHTA need additional revenues in the interim, an increase in toll rates should be considered. The elasticities calculated by Econometrica range from -0.013 to -0.280 with an average elasticity of
about -0.11. This means than a 10% increase in the toll rate would result in only a 1.1% decrease in traffic. Many toll facilities require that any revenues received by the toll road through tolls must be used exclusively for the toll road. If this is the case in Puerto Rico, then legislation must be passed to allow use of these revenues for other purposes if funds are needed to finance other transportation improvements.
2.1.4.2 HOV Buy-in
Tolling of facilities is desirable because it gives the government more control over traffic levels. For example, high-occupancy vehicle (HOV) lanes can be introduced as part of a toll road and be charged a lesser rate or no toll at all in order to encourage carpooling. An example of such a scheme is the San Francisco Bay Bridge. During the hours of 6 a.m. to 9 a.m. and 3 p.m. to 6 p.m., vehicles with three persons or more are allowed to use special HOV lanes at the toll plaza and avoid paying the $1.00 toll. During the morning peak hours, informal carpools have been set up at parking lots all over the East Bay where commuters can hitch a ride with other commuters headed toward San Francisco to the west for free because the time and toll saved at the toll plaza makes it worthwhile for the driver of the vehicle. The encouragement of higher vehicle occupancy rates is desirable but from an efficiency standpoint, the HOV lanes are being under utilized.
A possible solution to the inefficiencies associated with HOV lanes is to let single occupancy vehicles (SOV) or non-HOV vehicles pay an extra toll to use the HOV lane (Bernstein [1991]). A toll rate could be set just high enough so that the HOV lane does not become congested. This type of scheme would be most effective if a dedicated HOV lane existed for the length of the toll facility. For example, such a scheme may not be as effective on the San Francisco Bay Bridge, where time savings are limited to the toll plaza
and not on the bridge itself. Furthermore, electronic toll collection should be used to minimize queuing delays at toll plazas.
This "HOV buy-in" scheme is being developed for the State Route-91 (SR-91) median lanes in Orange County, California. This privately built road will help alleviate growing congestion on a 10 mile section of SR-91 by providing four additional lanes (two lanes in each direction) within the median. Initially, vehicles with two or more persons will be able to use the facility for free while SOVs will have to pay a toll. If such a scheme results in congestion on the new facility, vehicles with two persons (HOV-2s) will have to pay a toll as well. However, as part of the agreement between the government and the private developer, HOV-3s will always be able to use the facility for free. This project will use electronic toll collection and tolls will be varied during the day depending on the level of congestion on the road.
2.1.4.3 Other Tolling Schemes
In addition to the "HOV Buy-in" scheme, other tolling schemes could be used to either maximize revenue or alter driver behavior. For example, a "head-of-the-line" tolling scheme would allow drivers with monthly passes to use a special electronic toll collection lane at the toll plaza to pay their toll (Bernstein [1994]). These drivers would be charged more than other users for this privilege but ultimately may benefit through decreased travel
times.
Another possible tolling scheme related to "head-of-the-line" privileges is charging a different toll at each toll booth. For example, if there are three toll booths, booth #1 could charge $1, booth #2 could charge $2, and booth #3 could charge $3. This type of scheme creates an equilibrium where only those willing to pay a higher toll to decrease travel time will use booth #3. Those with medium value of time would use booth #2 and the rest would use booth #1.
In addition to these revenue raising schemes, driver behavior may be altered through tolling. Transportation planners have tried encouraging carpooling by providing measures such as dedicated HOV lanes and free use of toll facilities. However, a recent survey revealed that the average number of passengers per automobile in the U.S. dropped from 1.3 in 1980 to 1.1 in 1990 (PWF [1991]). A federal highway official, commenting on the failure of state and federal efforts to increase occupancy per vehicle, noted, "At least it can't get much worse."
One way of altering driver behavior would be to charge a toll that depends on the number of occupants in a vehicle. For example, if 4 or more people are in the vehicle, there would be no toll. If 3 people were in the vehicle, then the toll would be $2 and if 2 people were in the vehicle, the toll would be $4. Finally, if only one person were in the vehicle, then the toll would be $6. This type of scheme may be difficult to implement but may be feasible in the future with the use of surveillance cameras and electronic toll collection.
2.2 Congestion and Social Welfare
Congestion on freeways affects the quality of life for everyone. The added delays of a commute trip or the added cost that delays incur on shipping costs decreases the efficiency of the entire economy. In addition, the stress and frustration of spending nonproductive hours stuck in traffic takes an added toll. In a recent nationwide survey, 80 % of those polled said they considered traffic congestion a major problem in their cities (Drummond [1991]). This section first identifies the problem, then discusses possible solutions to congestion and their effects on social welfare.
2.2.1 The Congestion Problem
Congestion on freeways results in lost productivity for the American workforce. Americans lose more than 2 billion hours a year to traffic delays and, by the year 2005, that figure could increase to almost 7 billion hours if steps are not taken to mitigate the situation. This translates into a yearly cost of $34 billion according to one estimate (Drummond [1991]). These delays not only affect work trips, but trips related to distribution of goods as well. The American Association of State Highway and Transportation Officials estimates that truck delays alone add $7.6 billion a year to the cost of goods that Americans buy (Drummond [1991]).
A majority of these delays occur during peak hours. The percentage of peak hour travel on urban interstates that occurred under congested conditions reached 70 % in 1989, up from 41 % in 1975 (Sussman [1992]). This trend of increased congestion is expected to continue in the future. According to a study by the Federal Highway Administration, delays on urban freeways are expected to increase by a whopping 360% between 1985 and 2005 in central cities and by 433% in outlying areas (ITE [1989]).
2.2.2 Congestion Mitigation
Governments have tried using three fundamental ways of dealing with both an increased demand for, and a limited supply of transportation. The traditional approach to solving urban transportation problems in the face of increased demand is to increase the supply of transportation facilities. This includes constructing new highways as well as expanding old ones. The second option is to promote transit use. This policy has been relatively unsuccessful to date, but as conditions worsen, may become more effective in the future. The third option is transportation demand management. There are a number of methods that use highway demand management to decrease the number of vehicles on
the road but many are strongly opposed by the public and have a difficult time being approved for implementation. The following sections briefly describe some of the methods currently being used to deal with congestion.
2.2.2.1 Increasing Supply
Over the past 20 years or so, the number of new projects authorized for construction has been limited due to a number of factors. For example, between 1979 and 1989, the total number of miles of road in urban areas has increased only 9 % while the number of vehicle miles traveled has increased 38 % (Highway Statistics [1979 and
1989]).
The decrease in new construction can be attributed to the increase in cost associated with highway construction coupled with budgetary constraints of local governments. Using 1977 as the base year (i.e., 1977=100), construction costs have increased from 142.6 in 1979 to 184.2 in 1989 (Highway Statistics [1979 and 1989]). With the future of new road construction in question, transportation planners have promoted the use of transit as an alternative to driving.
2.2.2.2 Promoting Transit Use
Once commuters try using transit, they may find the cost of using transit favorable over using autos. For example, there was a noticeable gain in ridership on the Bay Area Rapid Transit (BART) system from the 1989 Loma Prieta earthquake which closed the Bay Bridge. During this period, when the bridge was closed for repairs, ridership jumped from 219,000 to 357,000 passengers a day (BART [1992]). Many of the riders chose to continue using BART service even after the bridge was reopened. This suggests that there
Before any actions are taken to promote use of transit, the reasons for the unpopularity of transit must be assessed. In order to make transit cost-efficient and serve more people, many stops must be made to pick-up and drop-off passengers. This constant acceleration and deceleration greatly affects travel times. For example, in 1985, the average worktrip travel time in New York City by transit took 46 minutes. However, the same trip took only 26 minutes by automobile (JAPA [1991]). There are, however, methods of decreasing travel times of transit in order to make transit travel times more competitive with those of the automobile. These methods include express bus service, use of dedicated bus lanes, and increasing frequency. In addition to making transit use more attractive, policies that make auto use less attractive should be used as well to maximize the effects.
2.2.2.3 Transportation Demand Management
With a limited amount of supply available to accommodate an ever increasing demand, transportation demand management techniques are used to optimize usage of existing facilities. Some strategies that hold promise and are currently in use in some cities include alternative work hours, ridesharing, growth management, and auto restricted zones. Alternative work hours and ridesharing are categorized as "market based" policies whereas mandates by the government to control congestion such as growth management and auto restricted zones are categorized as "command and control" policies (Searching for Solutions [1992]). For most facilities, the problem of limited supply becomes apparent only during peak hours and therefore this period should be the focus of any new policy.
Many employers now implement policies such as flex-time and compressed work weeks in order to spread demand more evenly during peak periods. Flex-time allows workers to choose a time that is most convenient for them to travel and thereby effectively creates an equilibrium where only those commuters willing to face congestion during the
peak time use the facility. Compressed work weeks effectively reduces the number of worktrips made, by having employees work more hours per day but fewer days per month. In addition to reducing the number of trips made, increasing the number of people per auto helps reduce congestion as well. Ride sharing is a policy used by governments to maximize the number of persons using a facility rather than maximizing the number of vehicles using a facility. Many freeways around the United States have HOV lanes that require vehicles to have a specified minimum number of persons in the vehicle to use the
lane. These HOV lanes usually have less traffic than other lanes and therefore can travel at higher speeds.
These "market based" policies of alternative work hours and ridesharing may be used in conjunction with "command and control" policies to reduce congestion further. Proponents of "market-based" strategies consider them to be more efficient ways of achieving clean air objectives, whereas proponents of uniform "command and control" standards consider this approach more politically acceptable and more equitable than "market based" strategies (Searching for Solutions [1992]).
Growth management is a form of "command and control" policy used by government to regulate development in regional areas. Before any new development can occur, studies must be done to assess the impact of such development on infrastructure. If the development is deemed to make existing conditions worse, then the project may be denied the necessary permits to proceed.
Another form of government regulation is auto-restricted zones. Land use policies could be geared to make it relatively easier to access facilities by transit than auto. For example, if parking availability is limited, then transit might be the only convenient means of access to a given destination.
A very successful program has been in place in Singapore since 1975. When this Area Licensing Scheme first went into effect, the number of private cars entering the
[1988]). This type of congestion pricing has been advocated for years and has gained a renewed interest due to rising congestion and developments in electronic toll collection (Bernstein and Muller [1993b]). In addition, integrating the use of new technology such as driver information systems with congestion pricing has further contributed to the renewed interest in congestion pricing (El Sanhouri and Bernstein [1994]).
2.2.2.4 Congestion Pricing
Congestion pricing is a way of allocating scarce resources (freeway capacity) in an efficient economic manner. By charging a toll, only those people who are willing to pay the price of the toll will use the facility. In this way, the toll could be set in such a manner as to maximize throughput and decrease congestion. In addition, air quality concerns can be addressed since vehicles in stop-and-go conditions produce several times more pollutants per mile than when they are traveling smoothly at cruising speeds (Poole [1988]). However, such user charges may be difficult to implement due to political opposition and equity concerns but may be easier to implement relative to increasing transit use.
Because people have shown a reluctance to use mass transit, a more successful approach may be to charge them for use of congested roads. Congestion pricing encourages changes in the following characteristics of travel behavior:
* departure times
* mode choice
* destination * route choice
* carpooling

![Figure 2.4: Bus Registrations 4 CD - C"'J Co co o (2 r'- 'r- C5 CI m-±OD s] LO LO r- Co CCO C CO C CD CM COCO '3 m ar 0 year 4 CD CJM c Mc d -C~m O)](https://thumb-eu.123doks.com/thumbv2/123doknet/13935361.451144/40.933.166.818.133.465/figure-bus-registrations-cd-cco-coco-year-cjm.webp)