ANALYSIS OF A HIGH-END MEMORY SUPPLY CHAIN - DRAM VENDORS TO FINAL ASSEMBLY
by
Mitchell Abbott Malone
B.S., Engineering Management, United States Military Academy, 1991 MBA, Saint Martin's College, 1997
Submitted to the Sloan School of Management and the Department of Civil and Environmental Engineering in Partial Fulfillment of the Requirements for the Degrees of
Master of Science in Management and
Master of Science in Civil and Environmental Engineering in conjunction with the
Leaders For Manufacturing Program at the
Massachusetts Institute of Technology June 2000
0 2000 Massachusetts Institute of Technology. All rights reserved.
Signature of Author
Sloan School of Management Department of Civil and Environmental Engineering May 18, 2000 Certified by
Professor Stephen C. Graves, Thesis Advisor Sloan School of Management Certified by
Peter J. Metz, Thesis Advisor
fxecutive Director, Center for eBusiness@MIT Accepted by
Daniele Veneziano, Chairman, Departmental Committee on Graduate Studies Department of Civil and Environmental Engineering Accepted by
Margaret Andrews, Executive Ilirector of the Master's Program
rN MIT Sloan School of Management
Reviewed by
Professor Joseph Sussman, Thesis Reader Department of Civil and Environmental Engineering
MASSACHUSETTS INSTITUTE OF TECHNOLOGY
ANALYSIS OF A HIGH-END MEMORY SUPPLY CHAIN - DRAM VENDORS TO FINAL ASSEMBLY
by
Mitchell Abbott Malone
Submitted to the Sloan School of Management and the Department of Civil and Environmental Engineering in Partial Fulfillment of the Requirements for the Degrees of
Master of Science in Management
and
Master of Science in Civil and Environmental Engineering
ABSTRACT
Compaq Computer Corporation's High Performance Systems Division (HPSD) manufactures servers for mid-range and high-end server markets. It has a complex supply chain that includes the use of supplier hubs, outsourced memory module manufacturers, and stacked memory devices (chips). For this memory module supply chain, Compaq faces two major planning challenges. First, it is very difficult to get an accurate forecast of memory requirements. Second, the cost of memory continues to decline, on the order of 1-4% per month, which results in a high inventory holding cost.
A set of standard software tools is developed to assist analysts with determining the
supply plan for memory from multiple suppliers. The purpose of these tools is to determine the minimum cost supply plan with an acceptable level of forecast risk. Two
separate tools individually address cost and forecast challenges. The Cost Tool can consider up to nine cost categories across the supply chain network upstream from the
factory. The tool is flexible, transparent, easily disseminated and easy to use. The Forecast Tool can track current supply activity and can forecast the next week's and next
quarter's supply plan. The tool consists of a main menu worksheet and another worksheet for each quarter of the year in Microsoft Excel. It can be used for any
commodity. It is flexible, easy to use and easily disseminated. Use of these tools should lead to more expeditious analyses of supply plans and forecasts while yielding estimates of the supply chain costs for a particular supply plan.
A conceptual model for decreasing costs by combining supply chain costs with a standard
purchasing price-parity point is presented. The purpose of this model is to provide purchasers another point of view based on total supply chain costs, including inventory write-offs due to decreasing memory prices and transportation costs.
Thesis Advisors:
Stephen C. Graves, Professor of Management
Acknowledgments
I wish to acknowledge the Leaders For Manufacturing (LFM) program for its support of
this work. LFM is a partnership between MIT and over a dozen American and international industrial companies. LFM's mission is to groom future manufacturing leaders through its Fellows program and advance the field of manufacturing through its research activities.
I wish to thank the Compaq Computer Corporation for being a gracious host during my
internship. This thesis is the end product of that experience. I am impressed with the caliber of Compaq's employees and have learned much from them. I met so many people whom I wish to acknowledge. I apologize to those whom I do not explicitly cite, and hope that my sincere gratitude for your help, guidance, and friendship during my stay at Compaq will suffice. Doug Kellogg, thank you for being a supportive supervisor. Paul Toomey, thank you for your assistance and for involving me in more than just the internship project. Paul Sturgis, thank you for sharing your time and wisdom with me. Dr. Frank Fallon, thank you for everything you did for me: for being patient with me, having confidence in me and for sharing your knowledge with me. It was ajoy working with all of you!
I wish to thank Steve Graves and Peter Metz, my thesis advisors, for their support and
patience throughout the internship and during the writing of this thesis. Thanks also to Joe Sussman for reading this thesis during his sabbatical leave from MIT.
I wish to thank my parents-in-law for their encouragement and support during this
challenging period. Thank you for your great care of Molly, for running her to her many after school events, and for giving her tons of love.
Finally, I wish to thank the two lovely ladies in my life. Kathleen, thank you for being a constant source of support and for keeping your good cheer despite the many hardships that come with being married to a student while you worked full-time supporting us. I also wish to thank my daughter Molly for your good spirit and love of life.
1 INTRODUCTION...9
1.1 PRO BLEM STA TEM EN T ... 9
1.2 DEFINITION OF KEY TERMS... 10
1.3 JUSTIFICATION FOR THIS INITIATIVE ... 11
1.4 BACKGROUND OF PROJECT SPONSOR... 12
1.5 T HESIS O V ERV IEW ... 13
2 BACKGROUND RESEARCH ... 15
2.1 THE 200-PIN MEMORY MODULE... 15
2.2 OVERVIEW OF COMPAQ'S HIGH-END SERVER SUPPLY CHAIN ... 17
2.3 HPSD's MEMORY MODULE SUPPLY CHAIN... 19
2.4 COMPUTER INDUSTRY'S MEMORY MARKET... 22
2.5 PROBLEMS AND CHALLENGES IN MEMORY SUPPLY CHAIN ... 26
3 COST MODEL...---...---... 30
3.1 C U STO M ER N EED S ... 30
3.2 DESCRIPTION OF THE COST TOOL ... 30
3.3 T OO L IM PLICA TION S ... 36
3.4 USING THE COST TOOL FOR ONE PART NUMBER ... 37
4 FORECAST TOOL SOLUTION TECHNIQUE ... 39
4.1 OVERVIEW OF CURRENT RESIDENT FORECAST TECHNIQUE... 39
4.2 C USTO M ER N EED S ... 40
4.3 CONCEPT OF THE FORECAST TOOL... 41
4.3.1 The Forecast Chart... ... ... 43
4.3.2 Next Quarter's Forecast Chart... 48
4.4 TOOL VERIFICATION TESTS... 50
5 A DIFFERENT CONCEPT FOR DRAM PROCUREMENT ... 51
5.1 INTRODUCTION TO STACKED VS. MONOLITHIC DRAM MARKET ... 51
5.2 PRICE TRADEOFF CONCEPT DESCRIPTION...52
6 CONCLUSIONS ...---..----... 61
6.1 T H E C O ST T O O L ... 6 1 6.1.1 Benefits of the Cost Tool... 61
6.1.2 Limitations of the Cost Tool... 61
6.1.3 Extensions of the Cost Tool... 61
6.1.4 Improvements of the Cost Tool... 61
6.2 T HE FO RECA ST T O OL ... 62
6.2.1 Benefits of the Forecast Tool... 62
6.2.2 Limitations of the Forecast Tool... 62
6.2.3 Extensions of the Forecast Tool... 63
6.2.4 Improvements of the Forecast Tool... 63
6.3 DRAM PROCUREMENT CONCEPT... 63
6.4 OVERALL CONCLUSION... ... 64
6.5 L EA RN IN G S ... ... 65
APPENDIX 1 ...---... 66
1.1 DETAILED EXPLANATION OF COST MODEL FUNCTIONS... 66
1.2 TOGGLES IN THE COST MODEL INPUT WORKSHEET... 70
1.3 EQUATIONS USED IN THE COST MODEL CALCULATION WORKSHEET ... 70
1.4 A WALK-THROUGH EXPLANATION OF THE COST MODEL ... 72
A PPEN D IX 2 ... 77
2.1 FORECAST TOOL D ETAILED EXPLANATION... 77
2.2 THE M OVING A VERAGE ... 80
2.3 HOLT'S FORECASTING TECHNIQUE... 81
2.4 FORECAST TOOL "W HAT IF" SCENARIOS... 82
FIGURE 1. REPRESENTATION OF A 200-PIN DIIMM ... 15
FIGURE 2. HIGH-LEVEL VIEW OF COMPAQ'S HIGH-END SERVER SUPPLY CHAIN... 17
FIGURE 3. HPSD 200-PIN MEMORY MODULE SUPPLY CHAIN ... 19
FIGURE 4. DRAM PRICE ENVIRONMENT, 1997-1999 ... 22
FIGURE 5. COMPANY SALES FORECAST ERROR PER DIMM -JUNE TO SEPTEMBER 1999 ... 28
FIGURE 6. SDRAM TIME IN THE SUPPLY CHAIN -SUPPLIER 1 ... 31
FIGURE 7. MEMORY REVALUATION CALCULATION ... 33
FIGURE 8. Q 399 SUPPLY CHAIN COSTS... 34
FIGURE 9. SINGLE DIMM COST MODEL ANALYSIS RESULTS ... 37
FIGURE 10. FORECAST CHART EXAMPLE ... 44
FIGURE 11. TREND LINE AT W EEK 2 ... 46
FIGURE 12. FORECAST CHART WITH LCM TREND LINE, WEEK 3 ... 47
FIGURE 13. NEXT QUARTER'S FORECAST CHART EXAMPLE... 49
FIGURE 14. PRICE-PARITY POINT FOR STACKED VS. MONOLITHIC DRAM... 52
FIGURE 15. DRAM LIFE CYCLES AND PRICE COMPARISONS... 53
FIGURE 16. CONCEPTUAL PRICE-PARITY POINT FOR STACKED VS. MONOLITHIC DRAM... 54
FIGURE 17. STACKED VS. MONOLITHIC COST COMPARISON NUMERICAL EXAMPLE...56
FIGURE 18. STACKED VS. MONOLITHIC, TIME PERIODS 15 TO 25... 57
FIGURE 19. COMPAQ'S PRICE-PARITY POINT SUPPLY CHAIN COSTS ... 58
FIGURE 20. PROPOSED "SWITCHING" POINT COSTS AND SAVINGS... 59
FIGURE 21. INFORMATION FLOW BETWEEN WORKSHEETS ... 65
FIGURE 22. TOGGLE SW ITCHES IN THE M ODEL ... 66
FIGURE 23. MACRO BUTTON ON INPUT WORKSHEET... 67
FIGURE 24. MACRO-DRIVEN OUTPUT FOR A DIMM's TIME IN THE SUPPLY CHAIN... 67
FIGURE 25. 512MB(S) DIMM ANALYSIS SHOWING EQUATIONS ... 75
FIGURE 26. D ATA IN PUT A REA ... 76
FIGURE 27. T HE LOAD C HART ... 78
FIGURE 28. FORECAST CHART BEFORE SCENARIO... 81
FIGURE 29. FORECAST CHART AFTER SCENARIO CHANGES... 82
FIGURE 30. A SPIKE IN DEMAND (LOAD), EARLY IN THE QUARTER ... 83
TABLE 1. SUM MARY OF TOGGLE SW ITCHES... 65
TABLE 2. COST EQUATIONS ASSOCIATED WITH CALCULATIONS FOR REVALUATION AND MEMORY COSTS IN TH E SU PPLY C HA IN ... 66 TABLE 3. A WALK-THROUGH EXPLANATION OF THE COST MODEL ... 68
1
Introduction
1.1 Problem Statement
Compaq Computer Corporation's High Performance Systems Division (HPSD) wants a clearer understanding of their server's complex memory supply chain. HPSD manufactures mid-range and high-end servers with one-third of their costs in memory. The memory supply chain is complex with five Dynamic Random Access Memory (DRAM) suppliers around the world. Compaq, like other computer manufacturers, has influenced its suppliers to use hubs near their manufacturing sites, but HPSD management does not fully understand the costs associated with the hubs. HPSD wants to know where costs are incurred in the supply chain or the time memory spends in each supplier's part of the supply chain. Complicating matters, the price of memory historically falls over time, which causes the company holding memory inventory to write down their inventory valuation to the market valuation. HPSD wants to be clearer about which
company records the loss if the memory is in the hub or when a price change is passed through the hub to HPSD. In addition, HPSD receives sales forecasts for memory that are consistently high. If HPSD produced to these forecasted levels, excess inventory costs would be extremely large. HPSD's Life Cycle Management (LCM) group has learned to adjust the sales forecast to determine memory supply plans. The process by which LCM develops supply plans is based on experience, load trends over time, and moving average calculations.
HPSD needs standard software tools that internal financial analysts and life cycle managers can
use to assist them with determining quarterly supply plans. The purpose of these tools is to determine the minimum cost supply plan while maintaining acceptable flexibility in the
forecasted supply plan to meet customer demand. The requirements for these tools are that they be flexible, easily disseminated, and easy to use. Use of these tools should lead to more
expeditious analyses of supply plans and forecasts while yielding estimates of the supply chain costs for a particular supply plan.
1.2 Definition of Key Terms
For brevity's sake, a bulletized list of words and definitions will serve as explanation of acronyms and specific phrases/words:
- AlphaServer: name of mid-range and enterprise servers at DEC and Compaq
- DEC: Digital Equipment Corporation
- DIMM: Dual In-line Memory Module, has nine or 18 memory DRAM or SDRAM on it
" DRAM: Dynamic Random Access Memory; a memory device; a semiconductor chip
- FAB: manufacturing fabrication facility, where silicon wafers are manufactured into processors and memory devices
- HPSD: High Performance Systems Division, a division of Compaq that makes AlphaServers
" Hub: Regionally located stock point where suppliers hold contracted amounts of materials
on a consignment basis until pulled by the customer (supplier owns stock until pulled by customer)
- JEDEC: Joint Electronic Device Engineering Council is the semiconductor engineering standardization body of the Electronic Industries Alliance (EIA).
" LCM: Life Cycle Management Group in HPSD
- Module: a name for a printed wire board with electronic components on it - like DRAM
" Price-Parity Point: an intersection between two price curves
= Printed Wire Board: a board that is made in layers with circuits running in between and through the layers
- SDRAM: Synchronous Dynamic Random Access Memory, a distinct type of DRAM
" Stacking/Stacked/Stack: process that stacks one SDRAM directly on top of another
SDRAM, effectively doubling the density of the memory capacity in the same footprint as a single SDRAM on a printed circuit board (PCB)
" Supply Chain: the set of business operations in which raw material and components are
transformed through conversion processes, storage, distribution, and delivery into a finished product for use by an end customer
1.3 Justification for this Initiative
The primary goal of this initiative is to assist product life cycle managers and financial analysts in determining and limiting the costs associated with memory supply plans. HPSD management chose to model the memory supply chain for two reasons. First, the memory supply chain environment was changing so quickly that management did not have a clear picture of all the pieces and costs associated with them, and any identification of cost reductions would increase profit. Second, memory was one-third of the cost for a complete server system, and HPSD was planning to eliminate internal memory module manufacturing by completely outsourcing its production. This would significantly impact their flexibility of acquiring adequate memory
supply because the external memory module manufacturers would be less willing than an
internal supplier to respond to an unexpected increase in HPSD demand. This would place more emphasis on accurate memory forecasts. Furthermore, one expects that a decrease in supply
flexibility would drive life cycle managers to increase forecasts, which they are already knowingly overforecasting, resulting in increased exposure (more inventory) to decreasing memory prices.
At Compaq, it is estimated that the industry trend for the price of DRAM decreases by approximately 40% per year. For instance, in May 1999, DRAM prices decreased 18%.1 Compaq consumes 10-15% of the world's memory output, so Compaq is vulnerable to DRAM price fluctuations. Normally a decline in the cost of raw material is good, but since the cost of memory is such a large part of the cost of the server its immediate effect can be bad. To stay
competitive, Compaq passes through decreases in memory prices to the customer. Even though Compaq has contract prices, it inevitably has millions of dollars of DRAM in inventory at any one time. Thus, if DRAM prices drop, Compaq has to write down the inventory valuation to the market valuation of the current inventory. For example, if Compaq has $20million worth of memory inventory and the price of memory decreases by 18%, then Compaq would have to write down its inventory valuation by $3.6million since their inventory lost that much value.
Inaccurate forecasts, typically overforecasts, add inventory to the supply chain. Decreasing this inventory exposure would mean significant savings (see Section 3, The Cost Model).
1.4 Background of Project Sponsor
Compaq Computer Corporation, headquartered in Houston, Texas, is one of the largest computer manufacturers in the world. It offers a complete line of computer products covering the entire price spectrum: from digital assistants and personal computers to large enterprise servers.
"Compaq derives most of its revenues from business customers but also has product offerings for the home user, government, and schools."2
The work associated with this project was conducted at Compaq's Maynard and Marlborough, Massachusetts facilities and was sponsored by the High Performance Systems Division (HPSD) which has life cycle management responsibility for Compaq's mid-range servers and enterprise servers. This group became part of Compaq after the 1998 acquisition of Digital Equipment Corporation (DEC) by Compaq.
1.5 Thesis Overview
Chapter two provides background on Compaq's memory supply chain, describes the problems and challenges they face, and provides information regarding the computer industry's memory market. Chapter three describes the conceptual model that underlies the Cost Tool, which captures the supply chain costs, as well as the time memory spends in the supply chain. Chapter four describes the conceptual framework that underlies the Forecast Tool. Chapter five describes a concept for determining the cost tradeoff point for purchasing stacked or monolithic DRAM. The sixth chapter concludes this document by providing general conclusions and learnings.
The appendices are a rich source of detailed information about the tools. Appendix 1 provides details about the cost tool. Appendix 2 provides details about the forecast tool.
This thesis is written from the point of view that Compaq's suppliers' costs are in effect Compaq's costs too. That is, if a supplier is forced to incur additional supply chain costs, then these costs will be passed on to Compaq in terms of a higher price for the memory devices. For
instance, requiring suppliers to hold memory in consignment (suppliers own material until customers pull material) at hubs forces them to integrate the cost of falling Dynamic Random Access Memory (DRAM) prices into their cost structures. This increased cost structure, caused
by writing down memory inventory valuations to market valuations, will affect the DRAM price,
thus not giving Compaq the full benefit of cost reductions resulting from continuous improvement efforts and higher yields from new technology implementations.
2
Background Research
2.1 The 200-pin Memory Module
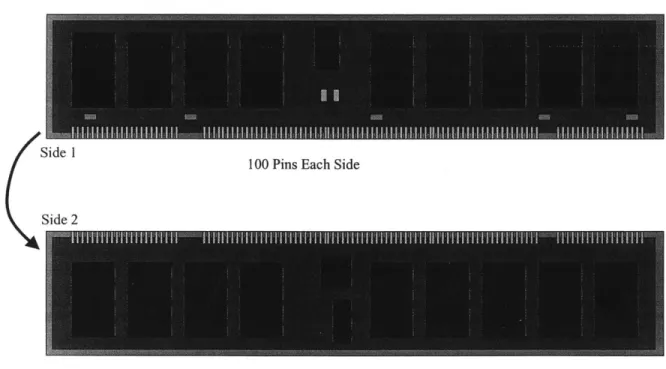
The product in this study of Compaq's memory supply chain is HPSD's 200-pin Dual In-line Memory Module (DIMM). These DIMMs have a unique design in that they have 200 pins versus industry standard 168-pin DIMMs. The DIMM's primary components include Synchronous Dynamic Random Access Memory (SDRAM), printed wire board, transistors, resistors and a clock. Figure 1 shows a graphical representation of a 200-pin DIMM.
Figure 1. Representation of a 200-pin DIMM
Side 1
100 Pins Each Side
Side 2
The two large rectangles in Figure 1 above show the two sides of the 200-pin DIMM. The SDRAM are represented by the nine large dark, rectangles on each side of the DIMM. SDRAMs are memory devices, or semiconductor chips. The printed wire board is the largest rectangle in Figure 1. The SDRAM are physically "placed" onto the printed wire boards to make a memory
module. The medium and small sized rectangles in Figure 1 are clocks, transistors, resistors, etc. Most 200-pin DIMMs have nine SDRAM on each side for a total of 18 per DIMM. For
increased memory density, Compaq stacks one SDRAM exactly on top of another SDRAM, yielding double the memory density in the same physical area, or "footprint," on the board. A "stacked" DIMM has double the number of SDRAM, or 36 per board. DIMMs are manually inserted onto the server's main board in the designated slots which are located "physically" as close as possible to the processor (the goal is to have as much memory density as close to the processor as possible). The pins provide the electrical connection between the DIMM and its slot on the main board.
With the acquisition of DEC, Compaq not only gained its coveted worldwide services organization, but it also assumed control of HPSD's AlphaServer product lines. At the time,
HPSD manufactured most memory modules internally. DEC had been developing a 200-pin
DIMM for the new server products that it was going to introduce in 1998. No other company was using the DEC designed DIMM, but there were hopes at DEC of making it the new industry standard. It claimed higher performance than the standard 168-pin DIMM, allowing the 64-bit Alpha chip to perform at its maximum capacity. But, from Compaq's point of view, DEC had complicated the memory supply chain in the name of "technical elegance." Compaq required that HPSD start to treat memory like a commodity, and coordinate with its suppliers to
manufacture memory modules externally.
With this initiative, HPSD looked to Compaq's five largest SDRAM suppliers for interest in developing manufacturing expertise in 200-pin DIMM production. A few early adopters were
found, one of which used a contract manufacturer to manufacture DIMMs. In mid-1999, HPSD put into action a plan to completely outsource the 200-pin DIMM business, which was one-third
of the cost of the AlphaServer platforms using 200-pin DIMMs, by the end of the year. This plan involved the use of five large SDRAM vendors around the world. These are the most cost
effective producers and have the most aggressive FAB processes (aggressively increasing yields). Compaq is the initial user of the latest technology, and the Alpha chip's high performance always demands the latest, highest capacity memory devices for its customers.
2.2 Overview of Compaq's High-End Server Supply Chain
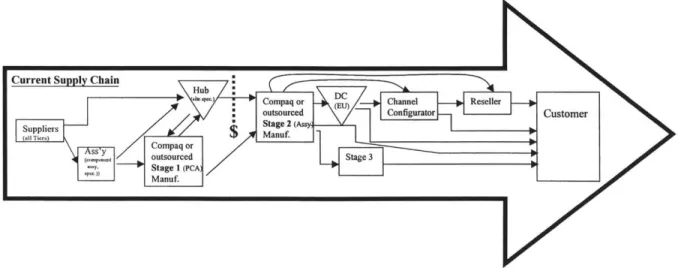
The Compaq Computer Corporation has an immense supply chain spanning the globe. It is a typical supply chain that starts with companies mining silicon and other substances from the ground and proceeds through the end customer who buys and uses the computers and servers Compaq manufactures. Figure 2 shows a high level view of Compaq's high-end server supply chain.
The "Suppliers" include all tiers. "Ass'y," short for assembly, are sites that manufacture or assemble parts such as printed circuit boards, power supplies, computer enclosures, computer frames, disk drives, cables, and peripheral devices. The "Hub" is a supply center where
suppliers set up a consignment-based system (suppliers own material until the customer pulls the material) where Compaq pulls material. At the point of pull, Compaq accepts the material into its cost structure. Until that point, the supplier is holding the inventory in its cost structure. Contractual obligations between Compaq and suppliers ensure adequate amounts of parts and materials in the hub. "Stage 1" consists of the sites where Compaq manufactures PCAs, or printed circuit assemblies. HPSD is the primary user of these facilities where it manufactures custom and standard low-end and high-end memory modules for its mid-range and high-end servers. In 1999, Compaq started outsourcing the production of its 200-pin DIMMs with a goal of outsourcing all of them by the end of the year.3 "Stage 2" consists of the assembly plants where Compaq manufactures computers and servers. The HPSD Stage 2 assembly plants are responsible for assembling, testing and shipping server computers. HPSD also has a facility where server orders are customized for special uses, "Stage 3" in Figure 2. The rest of the diagram details the many ways computers are distributed to "Distribution Centers," "Channel Configurators," and "Resellers." HPSD's servers are primarily built-to-order where some are shipped directly to customers while others spend a minimum amount of time at "Channel Configurators" and "Resellers." Typical HPSD final customers are stock market entities, research laboratories, banks, automobile companies, and aircraft companies.
2.3 HPSD's Memory Module Supply Chain
This study involves an analysis of HPSD's global 200-pin DIMM supply chain from the SDRAM suppliers to the factories. The primary components of the supply chain include five SDRAM suppliers in five countries; a SDRAM stacking operation in Texas; module
manufacturing sites in Scotland, Germany, East Asia, and California; and final assembly sites located in Singapore, Massachusetts, and Scotland. Figure 3 shows the supply chain diagram that is the basis for this discussion.
Figure 3. HPSD 200-Pin Memory Module Supply Chain
DIMM Production SDRAM Suppliers (Build to stock) 2 3 4 5 '
Final Assembly or Hub
Contract
2
Contract
The five SDRAM suppliers are on Compaq's prescribed supplier list and were contracted through HPSD procurement. The SDRAM suppliers are companies aggressively pushing the
technological limits to increase the memory capability of each chip. As mentioned earlier, to enhance the memory capability in its servers, HPSD utilizes a stacking method where one SDRAM chip is stacked directly on top of another SDRAM chip, effectively doubling the memory capability while preserving the standard placement space required by the chip on the module. Currently, approximately 20-30% of HPSD's SDRAM volume is stacked. But, as shown in Figure 3 above, all stacked SDRAM funnel through one facility in Texas. Stacking adds significant time and complexity to the supply chain. For example, Figure 3 shows that SDRAM from Supplier 4 can take four different paths toward being placed onto a DIMM. The following bullet points explain the complexities involved with Supplier 4's SDRAM supply chain flow:
" Supplier 4's top path flows SDRAM from Supplier 4 directly to HPSD's internal
DIMM production facility. Compaq owns the SDRAM as soon as it arrives. HPSD places the SDRAM onto memory boards to produce 200-pin DIMMs.
- Supplier 4's second path from the top flows SDRAM from Supplier 4 to the stacking
facility. This path is detailed as "Drop Ship" because Compaq has bought the
SDRAM from Supplier 4, but has asked it to ship the SDRAM directly to the stacking facility. Compaq owns the material as soon as it arrives at the stacking facility. The stacking facility produces the stacked SDRAM and then ships them to HPSD's internal DIMM production facility where they are used to manufacture stacked 200-pin DIMMs.
" Supplier 4's third path flows SDRAM directly to the stacking facility, but it is still
owned by Supplier 4. The stacking facility in Texas produces the stacked SDRAM and then ships it back to Supplier 4 in Asia. Supplier 4 places the stacked SDRAM onto memory boards to produce stacked 200-pin DIMMs. Then Supplier 4 ships the stacked DIMMs to the appropriate supplier hub.
- Supplier 4's fourth and bottom path flows SDRAM to its own DIMM production
facility. It produces the 200-pin DIMMs and then ships them to the appropriate supplier hub.
HPSD had three internal module production facilities that decreased to two during this project,
production outsourcing was a major strategy, and by the end of this project, production of all 200-pin DIMMs was outsourced. These outsource manufacturers were a combination of actual SDRAM suppliers and contract manufacturers. In Figure 3 above, the SDRAM suppliers are
labeled with numbers 1 through 5. If the DRAM supplier also produced DIMMs for Compaq,
then the DIMM production site carries the same supplier number. Otherwise, the DIMM production site is labeled "Contract." The dash-lined triangles labeled "1 WH" represent Supplier l's warehouse in California. Note in Figure 3 that if HPSD wants stacked DIMMs produced with Supplier 1 SDRAM, it always contracts the DIMM production to supplier 1. For a stacked DIMM using Supplier 1 SDRAM, the material flow is as follows:
Supplier 1 ships SDRAM from Asia to its California warehouse. Then it ships the SDRAM from the warehouse to the stacking facility in Texas. The stacking facility produces the stacked SDRAM and then
ships them back to the CA warehouse. Then Supplier 1 ships the stacked SDRAM to its contract DIMM manufacturer in CA who produces the stacked 200-pin DIMMs and returns them to the CA warehouse. Supplier 1 ships the stacked 200-pin DIMMs from the CA warehouse to the appropriate supplier hub.
The triangles on the right in Figure 3 are the supplier hubs. They are located near HPSD's server manufacturing facilities worldwide. The final assembly plant and hub labeled "NIO" are shaded because operations there will cease in 2000. The hubs labeled "FRO" and MIO" are italicized because they are located near manufacturing sites that will start producing servers in 2000.
Compaq's corporate "memory" commodity manager determines the suppliers from whom the company, as a whole, will purchase SDRAM. HPSD's LCM group manages the supply planning
for SDRAM and 200-pin DIMM manufacturing. LCM manages the 200-pin DIMM supply chain from SDRAM suppliers through delivery to the customer.
2.4 Computer Industry's Memory Market
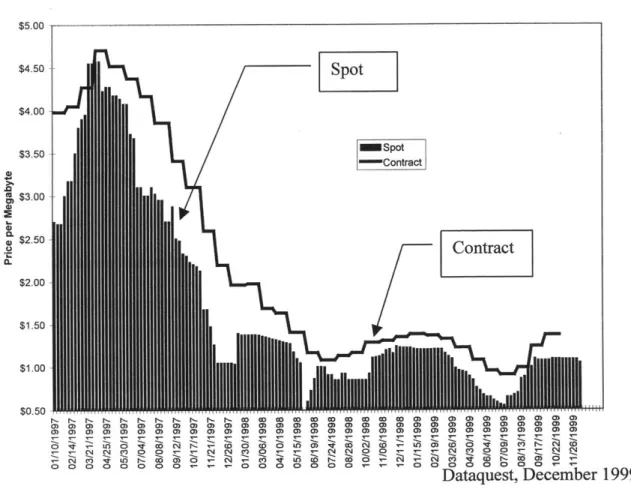
As Professor Charles Fine puts it in his book, Clockspeed, every advantage is only temporary.4 This mantra was played out in full force in the memory market during the term of this project, June -December 1999. The price of SDRAM had fallen at a rate of 40% per year for the last three years. The sharp decline in SDRAM prices in May 1999 made it very expensive for companies to have memory in inventory that month. Then, the summer months brought several problems to light in the market and the prices rose to earlier levels.5 Figure 4 shows spot market and contract prices for SDRAM.
Figure 4. Industry DRAM Price Environment, 1997-1999
$5.00 $4.50 $4.00 $3.50 $3.00 a) $2.50 $2.00 $1.50 $1.00 $0.50 11 1 r- ~ 1- r r'- r- I,- 1- t1- I- W Wn Go 0 W) W) Go n a) ) a D 0) a 0)D a) a a a) 4 ) C) a a3 a) M) a) a -) ) a -) ) ) a ) a ) ) a a ) a 4a 0 a a I 0 a an 0 -n -) 0 0 a 0 a 0)I 0 a 0 a~ N Dataquest, December 1999
4 Fine, Charles H. ClockSpeed: Winning Industry Control in the Age of Temporary Advantage, Reading, MA:
Perseus Books, 1998.
Figure 4 shows the average SDRAM price volatility caused by supply and demand changes in the memory market for 1997-1999. The fourth calendar quarter usually sees very high seasonal demand for computers. This demand translates into high demand for memory in the same period causing the price of memory to stabilize and even rise in an allocated market (where SDRAM suppliers allocate certain percentages of production yield to each SDRAM buyer in high demand periods). In 1999 above, the mid-year increase in price was initiated by news of decreased supply in the SDRAM market and then fueled by an earthquake in Taiwan, affecting six percent of the world's SDRAM output (measured in megabytes).6 The drive for cost reductions at Compaq's HPSD necessitated the hub strategy to keep the inventory of memory off its books because of its volatility in price. The hub strategy has developed industry wide and is not a unique Compaq supply strategy. This strategy pushes inventory costs back up the supply chain to the suppliers who in turn factor them into their cost structures and pass the costs back to the customers.
In the summer of 1999 many industry forces came together practically at the same time and caused chaos in the 64megabit SDRAM market. First, there was a tightening of supply for the 64megabit SDRAM as manufacturers shifted their product mix to the higher margin 128megabit SDRAM - resulting in lower 64megabit supply. Second, several producers were shifting
production to the next-generation 0.18-micron manufacturing processes and such a shift always results in lower yields at the start and thereby resulting in lower 64megabit supply. Third, the
sub-$1000 PCs suddenly moved from 32 megabytes to 64 megabytes of main memory
resulting in higher 64megabit demand.7 These dynamics sent the SDRAM spot market reeling and tripled the price for 64megabit SDRAM in eight weeks by the first week of September.
Compaq fared better since it negotiates contract prices, but they still increased substantially. With SDRAM prices on the rise, Compaq reversed its hub strategy in September by immediately pulling memory from the hubs as soon as the supplier shipped it there. Thus, Compaq did not allow the hub strategy, which was in place to help protect Compaq from falling memory prices, to reciprocate and benefit the SDRAM supplier in an opposite market environment. The world SDRAM market was further exacerbated by an earthquake in Taiwan on September 21. It shut down power to major manufacturing facilities for several days. Speculation of a supply shortage caused the SDRAM price to rise another 50 percent in late September.8
This memory price volatility significantly impacts HPSD's memory supply chain. When prices are increasing, Compaq wants to reverse its hub strategy by pulling memory and memory modules as soon as the material arrives at the hub. The specifics of Compaq's contract pricing with memory suppliers were not available for this study, but the hub contract stipulates that contract price changes are reflected immediately on material within the hub. SDRAM suppliers are required to keep a contracted amount of material in the hub at all times - for this study it was estimated to be two weeks supply. When memory prices increase and Compaq pulls everything from the hub as soon as it arrives, the supply chain is stressed to keep the minimum two weeks supply in the hub. The suppliers know what is happening. Compaq is taking ownership of the memory as fast as it can to minimize raw material costs. In this case where memory prices are
7 Electronic Buyers News, "Buying Spree Rolls DRAM Spot Market," September 15, 1999.
rising, Compaq is no longer having to write down its inventory valuation, but it is in danger of spending much more than it had planned to purchase memory. From the suppliers' point of view, Compaq's reversed hub strategy provides them no real "collaborative" incentive to
expedite SDRAM to the hub because based on their experience they know the increased demand signals are overstated. Additionally, the suppliers do have an incentive to produce as much SDRAM as quickly as possible to take advantage of the increasing prices in the spot markets. With the memory prices fluctuating up and down, severe overstated demand signals are delivered through the supply chain as both suppliers and buyers try to take advantage of the situation. The end result is no collaboration in a very expensive supply chain.
During HPSD's outsourcing overtures for the 200-pin DIMM, the SDRAM prices hit rock bottom in the summer of 1999. The severe decrease in SDRAM price over the last three years has been driven by too much supply, too little demand, and technology improvements. Over the past two decades, the cyclical nature of DRAM prices has influenced companies to give up or change their approach toward DRAMs. NEC Corporation is the latest to give up as an
independent supplier - they are merging with Hitachi Ltd., which is equally stressed by the falling market, to form the new NEC Hitachi Memory Inc.9 Constant improvements in DRAM manufacturing techniques have enabled suppliers to keep driving down prices in a competitive environment. This is the ideal environment in which large computer manufacturers enjoy the
SDRAM price revaluation (changing memory price) protection built into the hub strategy. As mentioned earlier, if the SDRAM or DIMMs are in the hub and the contracted price decreases, then the hub's supply immediately reflects that decrease. Since the supplier owns the material in the hub, the supplier has to write down its inventory valuation to the decreased market valuation.
This enables Compaq and other computer manufacturers to push those inventory revaluation expenses and inventory carrying costs up the supply chain to the SDRAM supplier.
Compaq consumes 10-15% of the world's memory output. HPSD's AlphaServer product line accounts for 5-10% of Compaq's DRAM business. There are several SDRAM suppliers in the world with the largest three being Samsung Electronics Co. Ltd., Micron Technology Inc., and Hyundai MicroElectronics Co. Ltd.'0 Compaq uses a multi-source strategy while procuring
85-90% of its memory demand from the five largest DRAM suppliers in the world. The large
computer manufacturers have hubs (collection point for supplier-owned material) near their manufacturing sites where suppliers ship and hold inventory in consignment. The suppliers pay the freight (0.2% of unit cost for memory) to the hub from their fabrication facilities, or FABs, which have physical locations dictated by economies of scale in manufacturing since shipping cost is not a concern.
2.5 Problems and Challenges in Memory Supply Chain
A major driver for Compaq's outsourcing of DIMM production is inventory cost. Figure 3 in
Section 2.3 shows the point with a "$---" at which Compaq acquires the DIMM onto its books. It is the point at which Compaq pulls the DIMM from the hub. That is only true if the DIMM production were outsourced because the suppliers ship to the hub and keep a pre-arranged stock of modules in that location. If HPSD produced the DIMM internally with stacked SDRAM, then Compaq owned the SDRAM at the point of shipment from the SDRAM supplier. In the case of
9 "Only the Giants"
1 Electronic Buyers News, "Only Giants Can Tame DRAM Monster," December 8, 1999. " Conversation with Jackie Gross, Compaq DRAM Procurement Manager, June 28, 1999.
producing DIMMs with unstacked, or monolithic, SDRAM, Compaq draws the SDRAM from the hub. By utilizing the hub and keeping the SDRAM off of its inventory books, Compaq avoids the severe decreases in the price of DRAM, as shown earlier in Section 2.4, Figure 4.
Compaq's supply planning for 200-pin DIMMs is managed by HPSD. For HPSD, the hub strategy for memory was accelerated when Compaq bought DEC. The new hub strategy coupled with the requirement to outsource all DIMM manufacturing caused many challenges and
questions about the memory supply chain.
" Where were the costs within the supply chain?
= What was the cost of the hub?
= How much time does memory spend in the supply chain for each supplier?
" Who owns the memory at what point in the supply chain?
- What is the effect of decreasing memory prices, or revaluation, on the costs in the supply chain?
- How can we capture the supply chain costs? How can we minimize them?
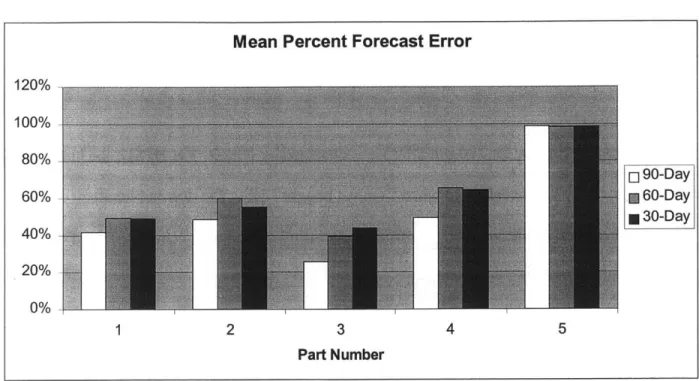
In addition to the complex supply chain, each month HPSD is tasked to adjust the sales forecast for 200-pin DIMMs. The sales forecast is consistently high. Without researching why the sales forecasts are always high, Figure 5 below shows mean forecast percent error data to justify the need for HPSD to adjust it.
Figure 5. Company Sales Forecast Error per DIMM - June to September 1999
Mean Percent Forecast Error
120% . 100% 80/% -80 90-Day 60% l 60-Day * 30-Day 40% 20% 0% 1 2 3 4 5 Part Number
The data in Figure 5 covers a four-month period from June to September 1999. The 90-Day forecast is a sales forecast received by HPSD at the beginning of a month for the third month. For example, in the first week of June, HPSD receives a 90-Day sales forecast for August, a 60-Day sales forecast for July, and a 30-60-Day sales forecast for June. HPSD's challenge is to adjust the sales forecast without causing a missed shipment due to a DIMM shortage. The cost of a missed shipment is the server system lost sale for the quarter, e.g. the sale may be lost forever or its shipment may be delayed until the next quarter. The cost of having too much inventory is much smaller due to the memory profit margin, but how can HPSD forecast and track their supply plans better to minimize costs whenever possible?
These challenges are significant since HPSD is trying to develop and stabilize a completely outsourced 200-pin DIMM supply chain. HPSD needs to know which suppliers have what costs at what point in the supply chain. It needs to know how much time memory spends in the supply
chain, because, as stated earlier, Compaq pays for the costs in its supply chain even if those costs are pushed upstream to the supplier. HPSD needs to know the cost of its supply chain so it can make every attempt to minimize the costs while still maintaining enough flexibility to never risk missing a server shipment to a customer.
3 Cost Model
3.1 Customer Needs
HPSD's Life Cycle Management (LCM) group manages the supply plan for the 200-pin DIMM and other memory modules. HPSD takes inputs from sales forecasts and on-the-job experience and creates a supply plan each quarter for 200-pin DIMMs. They also update the supply plan, if necessary, during the quarter. The supply plan, which is actually HPSD's demand signal to
suppliers, is divided among the suppliers based on their reported capacity and their history of meeting commitments. Through the lens with which this project was approached, HPSD
understands that all costs in the supply chain are passed on to Compaq. Therefore, LCM's needs are to: (1) Identify the time and cost of the steps in the supply chain for each supplier; (2)
Determine the revaluation cost associated with the time memory spends in the supply chain.
3.2 Description of the Cost Tool
The purpose of this Cost Tool is to identify the time and costs in HPSD's memory supply chain in order to provide decision support to help LCM determine which SDRAM suppliers minimize the overall memory supply chain cost.
The tool models the memory supply chain network shown in Figure 3, Section 2.3. The supply chain in Figure 3 consists of five SDRAM suppliers, one stacking plant, six DIMM
manufacturing plants, and five final assembly plants. The DIMM manufacturing plants in the network are internal and external facilities. The stacking operation is performed at an
The tool is divided into three areas: Input, Calculations, and Output. In the Input area, it allows the user to input data regarding time and cost. The time elements consist of the amount of time memory spends at each point in the supply chain network and the amount of time required to
flow, or ship, from point to point in the network. The cost elements include the standard cost of
the SDRAM, the cost of other raw materials used to produce a DIMM, the cost of the hub, the cost of transportation, the cost to stack SDRAM, and the cost to manufacture DIMMs.
The Calculations area uses the time and cost data from the Input area to calculate two major cost items. First, it calculates the memory price revaluation per quarter. Second, it calculates the supply chain costs for the quarter.
The calculation for memory price revaluation per quarter uses the time an SDRAM spends in the supply chain and the SDRAM raw material cost. First, using supply chain data for time from the Input area, the tool calculates the number of days SDRAM spends in the supply chain for each of the five suppliers. Figure 6 below shows an example of the time SDRAM spends in the supply chain for Supplier 1.
Figure 6. SDRAM Time in the Supply Chain - Supplier 1
Pd. Trans. WH Trans. Idle bProcss Trans. JWH iTrans. lReceive Process Trans. 1WH ITrans. Receive- OS
-Ulm days
orma cenano . 1 . . . . . 1 . . . . days
Best Case Scenano 2.5 0.5 1 1 I 1 0.5 . 1 U.b b U.5 1. I 0.2 Z4.( days
ors ase . . I I . 1 . . . days
ors - o . . . . . 1 .days
For each supplier, the tool draws time data into the shaded line called "Time in SC" at the top of Figure 6. The tool adds each number in the row and shows the results in the "Total" column. The tool repeats this process for each supplier using supplier specific data from the Input area.
By comparing the time SDRAM spends in each supplier's portion of the supply chain, LCM can
determine which supplier will have the least exposure to revaluation costs (decreases in SDRAM prices). Any change to the Input data will be immediately reflected in these supplier
calculations. Assumptions and estimates were made for supplier DIMM manufacturing
throughput time since none of the suppliers would divulge this information. Estimates were also made for the amount of time memory spent in Supplier l's warehouse and on some of the
transportation routes between facilities. Also in Figure 6 above, there are four scenario time estimates - the four bottom rows. These scenarios estimate "Normal," "Best Case," "Worst Case," and "Worst Case-No SDRAM." This provides a sensitivity analysis of the time SDRAM could spend in the supply chain. The scenario "Worst Case-No SDRAM" estimates the extra time involved if a supplier does not have SDRAM in stock. The second piece of the memory price revaluation per quarter is the cost of the SDRAM. This cost is part of the Input data and is part number specific, meaning that DIMM part numbers could have different SDRAM and different SDRAM costs.
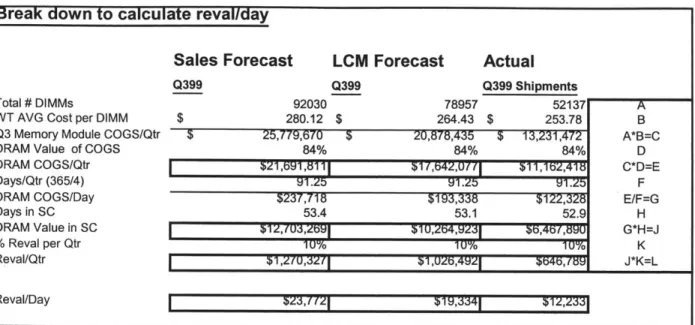
Revaluation calculations are performed for each of three cases: (1) The sales forecast acquired through the company sales forecasting system; (2) The LCM group's forecast that adjusts the sales forecast into a more accurate forecast; (3) The actual DIMM shipments for the quarter. Figure 7 shows the memory revaluation calculated for the three cases.
Figure 7. Memory Revaluation Calculation
Break down to calculate reval/day
Sales Forecast Q399
Total # DIMMs
WT AVG Cost per DIMM Q3 Memory Module COGS/Qtr
DRAM Value of COGS DRAM COGS/Qtr Days/Qtr (365/4) DRAM COGS/Day Days in SC DRAM Value in SC % Reval per Qtr Reval/Qtr Reval/Day LCM Forecast Q399 Actual Q399 Shipments 92030 78957 52137 A $ 280.12 $ 264.43 $ 253.78 B 5 25,779,670 $ 20,878,435 $ 13,231,472 A*B=C 84% 84% 84% D 521,691,83111 $17f,642,0// I 5 11, 162,418U C*D=E 91.25 91.2 91.25 F $237,718 $193,338 $122,328 E/FG 53.4 53.1 52.9 H $12 3,2,64,923l b,46/,89 G*H=J I10 10% 10% K 51,2/0,;32(l /j1,026,4921 5646, /89 1 J*K=L 523,f~z / /2$19,3341 $12,233|
The "WT AVG Cost per DIMM" is the weighted average cost per DIMM. This is based on volumes of DIMM part numbers multiplied by the appropriate DIMM costs then divided by the total number of DIMMs. The "WT AVG Cost per DIMM" changes with the forecast because the mix of DIMMs changes in each forecast or actual shipment. More specifically, the "Sales Forecast" above had a mix of DIMMs that included more of the higher cost DIMMs. With higher cost DIMMs, the average weighted cost is higher. The DRAM value percentage of DIMM costs, "DRAM Value of COGS," in the supply chain is calculated by the volumes of DIMM part numbers multiplied only by the cost of DRAM within that particular DIMM, then
divided by the total number of DIMMs. The "Days in SC" is the weighted average number of days a DIMM would spend in the supply chain given the sales forecast mix and parameter set in the Input area. The days a DIMM could spend in the supply chain range from 19-65.2 days with
its SDRAM spending 47-93.2 days in the supply chain. The "Reval/Qtr" is the revaluation cost incurred due to the price of memory decreasing over the quarter. These revaluation numbers answer a need for LCM. LCM can directly compare their forecast's revaluation cost per quarter
to the sales forecast and calculate how much supply chain revaluation cost they saved by
adjusting the sales forecast. LCM can also see how many revaluation cost dollars they left in the supply chain by comparing the LCM Forecast revaluation to the revaluation cost on the actual shipments for the quarter. LCM can use these side-by-side revaluation numbers to determine how effective their LCM Forecast is at trying to minimize the revaluation cost dollars left in the supply chain. A summary of the revaluation numbers in Figure 7 above shows that LCM saved approximately $245,000 for the quarter, but left approximately $380,000 in the supply chain. To increase the former amount and decrease the latter amount, LCM has to improve their forecasts
-a t-ask -attempted in Ch-apter 4.
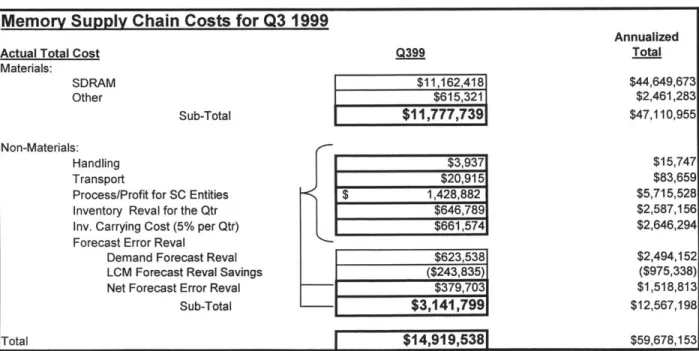
The final part of the Cost Tool calculates and details the supply chain costs for a specific segment of the 200-pin DIMM for the quarter. Figure 8 shows the supply chain costs for the third quarter of 1999.
Figure 8. Q399 Supply Chain Costs
Memory Supply Chain Costs for Q3 1999
Annualized
Actual Total Cost Q399 Total
Materials: SDRAM $11,162,418 $44,649,673 Other $615,321 $2,461,283 Sub-Total $11,777,739 $47,110,955 Non-Materials: Handling $3,937 $15,747 Transport $20,915 $83,659
Process/Profit for SC Entities $ 1,428,882 $5,715,528
Inventory Reval for the Qtr $646,789 $2,587,156
Inv. Carrying Cost (5% per Qtr) $661,574 $2,646,294
Forecast Error Reval
Demand Forecast Reval $623,538 $2,494,152
LCM Forecast Reval Savings ($243,835) ($975,338)
Net Forecast Error Reval $379,703 $1,518,813
Sub-Total $3,141,7 $12,567,198
The supply chain cost total consists of "Material" costs and "Non-Material" costs for the "actual DIMM shipments" in
Q3
1999. The "Material" costs are the costs of the SDRAM and other raw material that is used in producing the DIMMs for the quarter. The SDRAM cost for suppliers isassumed to be 84 percent of the cost Compaq actually pays for the SDRAM. This percentage was determined by assuming that DIMM suppliers paid the same amount for DIMM raw materials, other than SDRAM, as HPSD paid and that the suppliers made an arbitrary profit margin on the SDRAM. From an HPSD and LCM perspective, these costs can only be affected
by the corporate memory commodity manager. The Non-Material costs include the topics listed
in Figure 8 above. The "Handling" costs are calculated by determining the handling costs for each DIMM by supplier and multiplying that cost by the number of DIMMs acquired from each supplier. The "Transport" costs are calculated in the same manner as the "Handling" costs. The "Process/Profit for SC Entities" is the contracted standard cost per DIMM minus the DIMM's raw material costs multiplied by the number of DIMMs for the quarter. "Inventory Reval for the Qtr" is the revaluation per quarter calculated for the actual shipments (from Figure 7). The "Inv. Carrying Cost (5% per Qtr)" is the Material sub-total cost multiplied by five percent. The
"Forecast Error Reval" is the memory price revaluation that was present in the supply chain even though LCM adjusted the sales forecast. The "Net Forecast Error Reval" is the sum of "Demand Forecast Reval" and "LCM Forecast Reval Savings." "Demand Forecast Reval" is the sales forecast revaluation (from Figure 7). "LCM Forecast Reval Savings" is the amount of revaluation saved by LCM's adjusting the sales forecast (from Figure 7, Sales minus LCM). This "Savings" is depicted as a negative number to show that LCM took this amount of revaluation out of the supply chain by adjusting the sales forecast. The "Net Forecast Error Reval" shows the amount of revaluation that is left in the supply chain that could be decreased
with a better forecast. The Non-Material Sub-Total is the sum of all the Non-Material categories and uses the "Net Forecast Error Revaluation" number as the "Forecast Error Reval" number. The annualized numbers at the right in Figure 8 is the third quarter's numbers multiplied by four.
Table 3 in Appendix 1, section 1.4 details the equations used to produce the calculations in Figure 7 and Figure 8 above.
3.3 Tool Implications
The supply chain costs depicted in Figure 8 above provide HSPD and LCM with information that they can use to determine how to save money. HSPD can affect some of the Non-Material costs by working with the suppliers to improve supply chain throughput time. An improvement
in this area will cause the SDRAM to spend less time in the supply chain and reduce revaluation costs. At the same time, LCM can improve its forecast adjusting efforts to increase the
revaluation savings and decrease supply chain costs.
A learning from the analysis is that, on an annualized basis, LCM saved Compaq nearly
$1million in revaluation costs and there is another $1.5million in the supply chain waiting to be claimed. On the other hand, the analysis shows that the corporate sales forecast causes nearly $2.5million in excess revaluation cost on an annualized basis. Another learning is that the actual inventory revaluation cost was over four percent of the total supply chain cost. This is a function of the SDRAM cost and the time it spends in the supply chain.
3.4 Using the Cost Tool for One Part Number
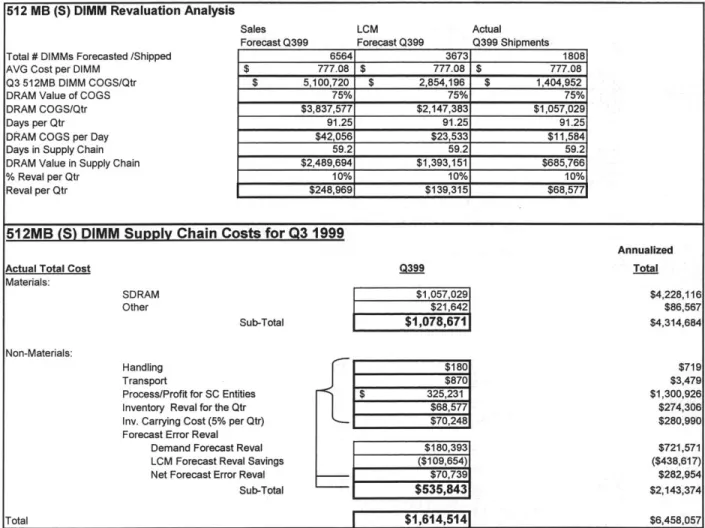
An additional model execution was performed for just one part number. Figure 9 shows the results of the single DIMM analysis.
Figure 9. Single DIMM Cost Model Analysis Results
[512 MB (S) DIMM Revaluation Analysis
Total # DIMMs Forecasted /Shipped
AVG Cost per DIMM
Q3 512MB DIMM COGS/Qtr DRAM Value of COGS DRAM COGS/Qtr
Days per Qtr DRAM COGS per Day Days in Supply Chain
DRAM Value in Supply Chain % Reval per Qtr Reval per Qtr Sales Forecast Q399 LCM Forecast Q399 Actual Q399 Shipments 6564 3673 1808 $ 777.08 $ 777.08 $ 777.08 $ 5,100,720 $ 2,854,196 $ 1,404,952 75% 75% 75% $3,837,577 $2,147,383 $1,057,029 91.25 91.25 91.25 $42,056 $23,533 $11,584 59.2 59.2 59.2 $2,489,694 $1,393,151 $685,766 10% 10% 10% $248,969 $139,315 $68,577
512MB (S) DIMM Supply Chain Costs for Q3 1999
Actual Total Cost
Materials: SDRAM Other Sub-Total Non-Materials: Handling Transport
Process/Profit for SC Entities Inventory Reval for the Qtr
Inv. Carrying Cost (5% per Qtr) Forecast Error Reval
Demand Forecast Reval LCM Forecast Reval Savings Net Forecast Error Reval
Sub-Total Total Q399 $1,057,029 $21,642 $1,078,6711 $180 $870 $ 325,231 $68,577 $70,2481 Annualized Total $4,228,116 $86,567 $4,314,684 $719 $3,47G $1,300,926 $274,306 $280,99C $721,571 ($438,617) $282,954 $2,143,374 $6,458,057 I $1,614,5141
A comparison of LCM Forecast Reval Savings between Figure 8 (all DIMM volume) and Figure 9 (single DIMM part number) shows that nearly 45% of the revaluation saved by the LCM group's forecast is claimed by one part number. This single DIMM part number contributes only approximately 7% of the total DIMM volume. It is the highest cost DIMM, thus highly
susceptible to revaluation costs. The significance of this single DIMM analysis is that LCM could track revaluation costs per DIMM part number in order to allocate resources toward the
part numbers that have the most revaluation costs. For example, higher cost DIMMs should spend the least amount of time in the supply chain that is possible. As the suppliers prove their reliability in delivering quality 200-pin DIMMs on time, LCM could migrate higher cost DIMMs toward suppliers that are working to decrease their supply chain throughput time. This part number analysis can help with those decisions. Table 3 in Appendix 1 section 1.4 provides a walk-through of the cost model. Table 4 in Appendix 1, Section 1.5, details each step for the single DIMM analysis in the Cost Model.
4 Forecast Tool Solution Technique
4.1 Overview of Current Resident Forecast Technique
Compaq's sales force is separated into geographies, or GEOs. The GEOs submit forecasts by product family for their territories through a system called Explorer, a planning system that is part of the company's SAP system. Compaq generally operates on a weekly forecast change
basis, but the AlphaServer product line operates on monthly changes. After the forecast is submitted into the Explorer system, each month the AlphaServer plants receive a DNUB, or a Desired Net Unit Billed report. The DNUB provides forecast data for all assemblies, including memory modules. The plants input the DNUB into Reflex, an 12 simulation tool, to determine if they have enough inventory or open purchase orders to meet the demand for assemblies and all components down to the lowest level for the forecast time horizon.1 2 If the plants' open
purchase orders have enough flexibility to handle an increase in forecast, then they communicate the increased forecast to their suppliers. If their open purchase orders can not cover the
increased forecast, then the issue is raised to higher management and worked out with the suppliers at higher levels.1 3 This process is used for all components and assemblies, including memory modules, but memory modules are given special attention. The plants look to the LCM Group for further guidance on memory module forecasts.
While the plants are receiving the DNUBs, the LCM Group is receiving them also. The memory and graphics demand/supply manager's team analyzes the DNUB for memory and compares the changes to what their internal forecast had indicated. The internal forecast is a combination of
1 An open purchase order is a plant-specific purchase order with a supplier that has an agreed upon flexibility range
for volume up and down due to unexpected changes, usually originated quarterly with each quarter's supply plan. " Conversation with Joe Loura, the AlphaServer Demand/Supply Manager for the LCM Group, July 29, 1999.
two procedures. First, the group positions a trend line through the recent actual shipment data to acquire the expected minimum supply plan for the quarter. Second, the group uses on-the-job experience, internal information sources, and intuition to modify or adjust the supply plan to an acceptable level where the group will be sure "not" to underforecast. The cost of
underforecasting memory is lost revenue or delayed revenue (lost revenue for the quarter). The LCM group adjusts the sales forecast DNJB because the sales forecast is habitually very high, as shown in Figure 5, Section 2.5. By adjusting the DNUB, the LCM memory group controls the
global inventory for memory in an effort to minimize costs. LCM uses a moving average for demand data in the current quarter to forecast the supply plan for the rest of the quarter and the following quarter. A 30 % buffer is added to the moving average forecast to account for growth and desired end-of-quarter inventory.
The cost of a missed shipment is the amount of the server system sales price. The cost of having too much inventory is much smaller due to the memory profit margin, but how can HPSD
forecast and track their supply plans better to minimize costs whenever possible?
4.2 Customer Needs
HPSD's Life Cycle Management (LCM) group manages the supply plan for the 200-pin DIMM and other memory modules. It takes inputs from sales forecast, or DNUB, and on-the-job
experience and creates a supply plan each quarter for 200-pin DIMMs. It also updates the supply plan, if necessary, during the quarter. Therefore, LCM's needs are: (1) A mathematical method to determine the supply plan for a quarter given historical data from the previous quarter; (2) Once a supply plan is established, a way of tracking demand weekly and alerting LCM if the
supply plan could be in danger; (3) A model that uses graphical chart report formats familiar to the LCM.
4.3 Concept of the Forecast Tool
The Forecast Tool performs three primary functions to meet LCM's needs. First, the tool applies a mathematical approach to the "load" (demand) data points in a current quarter to forecast the demand in the following quarter. Secondly, the tool tracks the "plan" (supply plan) versus the "load" versus the forecast to provide a weekly visual tracking mechanism to inform LCM if the
supply plan is too high, on target, or in danger of being exceeded. Thirdly, the tool provides presentation quality graphical charts that replicate charts already in use at LCM.
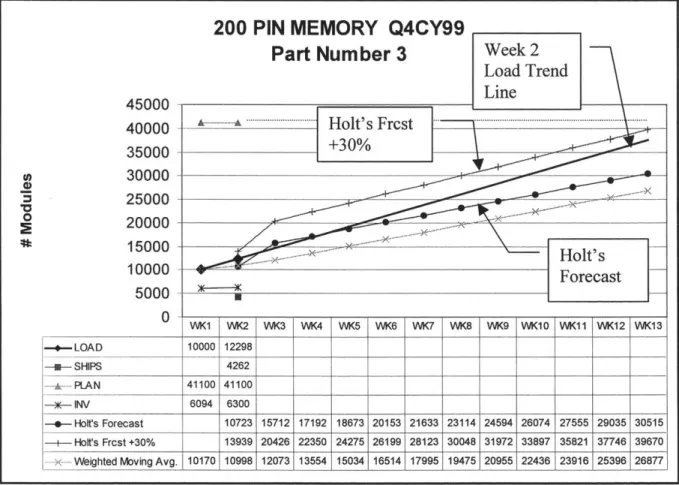
Each week LCM gathers data about the 200-pin DIMM customer demand, factory shipments, and inventory levels through internal Compaq systems. The tool allows LCM to input this data into the tool each week by DIMM part number. Once the tool is updated for the week, it uses multiple techniques to forecast demand for the following week, for the remainder of the current quarter and for the following quarter. These techniques consist of a weighted moving average, detailed in Appendix 2, Section 2.2, and Holt's forecasting model for trended data, detailed in Appendix 2, Section 2.3. A quick summary of the underlying logic follows:
The Weighted Moving Average used in the current quarter Forecast Chart is a 12-period weighted moving average to forecast the following week's demand. The current demand point has a weight of 3 (or is multiplied by 3). The most recent demand point has a weight of 2. The other 10 demand points have weights of 1. This allowed LCM to place a more importance on the two most recent demand points without minimizing the effect of the other 10 demand points. For example, if LCM is inputting data for week seven of the current quarter to forecast Week 8, the weighted moving average will use all seven demand points from the current quarter and reach back to the previous quarter's archived data to use the previous quarter's last five