Publisher’s version / Version de l'éditeur:
Energy and Buildings, 41, 8, pp. 897-905, 2009-08-01
READ THESE TERMS AND CONDITIONS CAREFULLY BEFORE USING THIS WEBSITE.
https://nrc-publications.canada.ca/eng/copyright
Vous avez des questions? Nous pouvons vous aider. Pour communiquer directement avec un auteur, consultez la
première page de la revue dans laquelle son article a été publié afin de trouver ses coordonnées. Si vous n’arrivez pas à les repérer, communiquez avec nous à [email protected].
Questions? Contact the NRC Publications Archive team at
[email protected]. If you wish to email the authors directly, please see the first page of the publication for their contact information.
NRC Publications Archive
Archives des publications du CNRC
This publication could be one of several versions: author’s original, accepted manuscript or the publisher’s version. / La version de cette publication peut être l’une des suivantes : la version prépublication de l’auteur, la version acceptée du manuscrit ou la version de l’éditeur.
For the publisher’s version, please access the DOI link below./ Pour consulter la version de l’éditeur, utilisez le lien DOI ci-dessous.
https://doi.org/10.1016/j.enbuild.2009.03.014
Access and use of this website and the material on it are subject to the Terms and Conditions set forth at
Do LEED-certified buildings save energy? Yes, but...
Newsham, G. R.; Mancini, S.; Birt, B.
https://publications-cnrc.canada.ca/fra/droits
L’accès à ce site Web et l’utilisation de son contenu sont assujettis aux conditions présentées dans le site LISEZ CES CONDITIONS ATTENTIVEMENT AVANT D’UTILISER CE SITE WEB.
NRC Publications Record / Notice d'Archives des publications de CNRC: https://nrc-publications.canada.ca/eng/view/object/?id=367e8a94-0f06-49e1-ab61-f76a968063df https://publications-cnrc.canada.ca/fra/voir/objet/?id=367e8a94-0f06-49e1-ab61-f76a968063df
http://irc.nrc-cnrc.gc.ca
Do LEED-c e r t ifie d buildings save e ne rgy? Ye s,
but ...
N R C C - 5 1 1 4 2
N e w s h a m , G . R . ; M a n c i n i , S . ; B i r t , B .
A u g u s t 2 0 0 9
A version of this document is published in / Une version de ce document se trouve dans:
Energy and Buildings, 41, (8), pp. 897-905, DOI: 10.1016/j.enbuild.2009.03.014
The material in this document is covered by the provisions of the Copyright Act, by Canadian laws, policies, regulations and international agreements. Such provisions serve to identify the information source and, in specific instances, to prohibit reproduction of materials without written permission. For more information visit http://laws.justice.gc.ca/en/showtdm/cs/C-42
Les renseignements dans ce document sont protégés par la Loi sur le droit d'auteur, par les lois, les politiques et les règlements du Canada et des accords internationaux. Ces dispositions permettent d'identifier la source de l'information et, dans certains cas, d'interdire la copie de documents sans permission écrite. Pour obtenir de plus amples renseignements : http://lois.justice.gc.ca/fr/showtdm/cs/C-42
Do LEED-certified buildings save energy? Yes, but …
Guy R. Newsham, Sandra Mancini, Benjamin J. Birt
National Research Council Canada – Institute for Research in Construction
Abstract
We conducted a re-analysis of data supplied by the New Buildings Institute and the US Green Buildings Council on measured energy use data from 100 LEED certified commercial and institutional buildings. These data were compared to the energy use of the general US commercial building stock. We also examined energy use by LEED certification level, and by energy-related credits achieved in the certification process. On average, LEED buildings used 18-39% less energy per floor area than their conventional counterparts. However, 28-35% of LEED buildings used more energy than their conventional counterparts. Further, the measured energy performance of LEED buildings had little correlation with certification level of the building, or the number of energy credits achieved by the building at design time. Therefore, at a societal level, green buildings can
contribute substantial energy savings, but further work needs to be done to define green building rating schemes to ensure more consistent success at the individual building level. Note, these findings should be considered as
preliminary, and the analyses should be repeated when longer data histories from a larger sample of green buildings are available.
Introduction
Green building rating systems
As the global population increases the need for buildings also escalates. In developed countries, buildings account for 20-40% of total energy use [Pérez-Lombard et al., 2008, Natural Resources Canada, 2005]. And in countries with growing economies the average annual growth rate in energy use is 3.2%, compared to an average of 1.1% for developed nations [Pérez-Lombard et al. 2008]. Besides the depletion of non-renewable energy sources, this energy use contributes greenhouse gases to the atmosphere, with consequent detrimental effects [IPCC, 2007]. To reduce the environmental footprint left by buildings, new buildings need to use less energy in both their construction and operation than previous buildings of similar size and shape, while still providing a satisfactory indoor environment for their occupants.
Numerous countries/regions have developed green building programs aimed at promoting more sustainable buildings. One such program in North America is LEED (Leadership in Energy and Environmental Design), administered by the US and Canada Green Building Councils (USGBC, CaGBC). The LEED green building rating system encourages an integrated design approach, with a points scheme that allots credits for building design features deemed to improve
sustainability, which includes reductions in energy use and improvements in indoor environment quality.
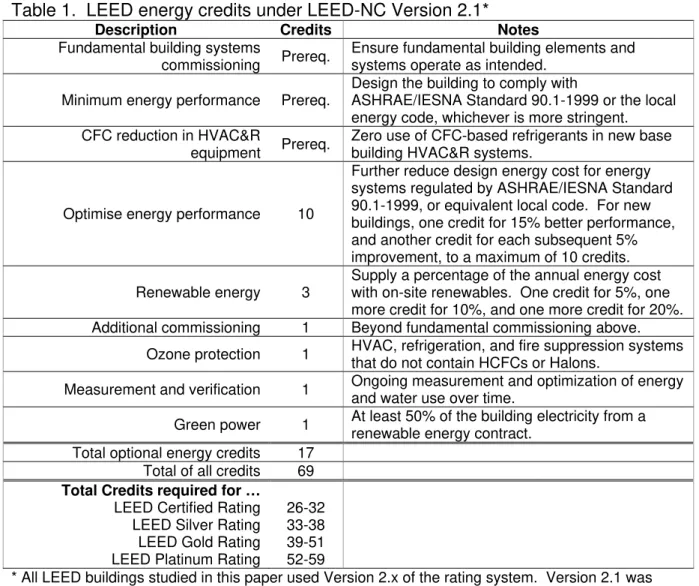
The focus of this paper in on energy use. Table 1 shows the optional energy credits available under LEED for New Construction (LEED-NC, [USGBC, 2002]), as well as energy performance prerequisites. The table also shows the total credits available, and the number of credits required for the various levels of certification. Note that, of particular interest to this paper, energy performance credits are based on predicted (simulated) performance at the time of building design, and not on actual energy performance after the building is built and occupied.
Table 1. LEED energy credits under LEED-NC Version 2.1*
Description Credits Notes
Fundamental building systems
commissioning Prereq.
Ensure fundamental building elements and systems operate as intended.
Minimum energy performance Prereq.
Design the building to comply with
ASHRAE/IESNA Standard 90.1-1999 or the local energy code, whichever is more stringent. CFC reduction in HVAC&R
equipment Prereq.
Zero use of CFC-based refrigerants in new base building HVAC&R systems.
Optimise energy performance 10
Further reduce design energy cost for energy systems regulated by ASHRAE/IESNA Standard 90.1-1999, or equivalent local code. For new buildings, one credit for 15% better performance, and another credit for each subsequent 5% improvement, to a maximum of 10 credits. Renewable energy 3
Supply a percentage of the annual energy cost with on-site renewables. One credit for 5%, one more credit for 10%, and one more credit for 20%. Additional commissioning 1 Beyond fundamental commissioning above.
Ozone protection 1 HVAC, refrigeration, and fire suppression systems that do not contain HCFCs or Halons.
Measurement and verification 1 Ongoing measurement and optimization of energy and water use over time.
Green power 1 At least 50% of the building electricity from a renewable energy contract.
Total optional energy credits 17 Total of all credits 69
Total Credits required for …
LEED Certified Rating 26-32 LEED Silver Rating 33-38 LEED Gold Rating 39-51 LEED Platinum Rating 52-59
* All LEED buildings studied in this paper used Version 2.x of the rating system. Version 2.1 was the version used by the vast majority. Version 2.0 differs only slightly in terms of energy credits. Version 2.2 requires a baseline energy performance referenced to ASHRAE 90.1-2004, but was not used by the LEED buildings studied in this paper. All 2.x versions are available at USGBC [2002].
Many buildings designed under LEED-NC have now been occupied, and it is reasonable to ask: are these buildings living up to expectations? To answer this
question post occupancy evaluations (POEs) need to be undertaken to measure the buildings’ performance. POE can also help diagnose operational problems, which may allow the building to reach a higher level of performance.
Unfortunately POEs of buildings are rarely conducted, and if they are, rarely published. In the next section we review the published work on post-occupancy performance of green buildings in terms of energy use.
Post-occupancy evaluation of energy performance
Torcellini et al. [2004] conducted an overview of six sustainable buildings in the USA. Extensive monitoring of energy flows, including lighting loads, HVAC loads and plug loads, for a minimum of one year was undertaken. The data was
logged every 15 minutes and used to calibrate energy simulation models. Analysis showed that all buildings performed worse than predicted, but all managed a substantial saving (either energy cost or energy use) compared to a comparable code-compliant building. The authors suggested that deviation from the predicted savings was due to higher than expected occupant loads and systems not performing together as designed. Further, hours of operation and building space temperatures varied from the initial design. They concluded that the designers were optimistic about the behaviour of the occupants and their acceptance of systems.
Eleven buildings in the Cascadia Region, USA were assessed by Turner [2006]. The author compared the actual utility usage to three different metrics: design energy use, energy use compared to code-compliant baseline, and the average energy use of the commercial building stock. All buildings performed better than their baseline, six of the buildings performed better than their design energy use, and all but two performed better than the average commercial building stock. The authors noted that actual operational variables may have differed from those assumed in the baseline models, and that operational optimization was still underway in some buildings.
Diamond et al. [2006] investigated 21 LEED certified (LEED-NC Version 2.0/2.1) buildings. Actual energy use was determined from utility billing data. The
modelled energy data for the as-designed and baseline building was obtained from the LEED certification documentation submitted to the USGBC. On
average, for the 18 buildings that had both simulated whole building design and actual energy use data, energy use was 1% lower than modelling predictions (which were 27% below baseline). However, there was large variability (standard deviation, s.d. 46%), and some performed better than predicted while others performed worse. Further the number of LEED energy credits obtained in the certification did not correlate with the actual energy use per floor area. The authors recommended that a comprehensive collection and publication of modelled vs. actual energy use data was needed, allowing for a closing of the gap between design simulation and as-built performance.
Fowler & Rauch [2008] analysed multi-dimensional performance data for 12 US federal government commercial buildings, all of these buildings had been
designed with energy efficiency goals, and some were LEED certified. All buildings had measured energy use below their modelled baselines, and energy use per floor area was 25-30% lower, on average, than the US commercial building stock. Although not detailed, the authors suggest a statistically significant relationship between energy credits achieved for the eight LEED certified buildings and Energy Star score, a measure derived from actual energy use. However, the authors do caution against deriving firm conclusions from such a small sample size from a single owner/operator.
Baylon & Storm [2008] examined the characteristics of LEED commercial
buildings in the US Pacific Northwest, and compared them to regional non-LEED buildings. The mean energy use per floor area for the 12 LEED buildings was 10% lower than the 39 similar non-LEED buildings in the same region. This relatively small improvement was attributed to the relatively high prevailing energy standards for all buildings in the region. Again, the authors note the uncertainty of conclusions based on such a small and varied dataset.
The New Buildings Institute study
Perhaps the largest study to date was undertaken by the New Buildings Institute (NBI), under contract to the USGBC [Turner & Frankel, 2008]. This study
provided the raw data for the analyses is this paper, and therefore we describe it in some detail in this section. The study looked at 121 LEED buildings (LEED-NC Version 2.x certified up to and including 2006), which provided one full year of measured post-occupancy energy usage data. Total energy use intensity (EUI, kBtu/ft2/yr)* was derived by summing the purchased energy from all fuel types. Most of the analysis excluded the buildings with unusually high energy activity types and specific process loads such as laboratories, data centers and supermarkets, and focussed on the 100 remaining buildings (termed “medium energy use”). EUI was compared to initial baseline and design models in LEED submittals (available for 71 of the buildings), and to data for the national building stock in the same or similar building activity types from the 5000+ buildings in the 2003 Commercial Building Energy Consumption Survey (CBECS) database [EIA, 2003]. Model values were adjusted to include plug loads equal to 25% of the total baseline energy use, which is the default value currently used by LEED in modelling energy use.
The study reported that the median EUI of the LEED buildings was 32% lower than the mean EUI in the CBECS database. For office buildings, the most common and easily-comparable activity type, the median EUI of the LEED buildings was 33% lower than the mean EUI in the CBECS database. The median EUI by certification level suggested a trend in the expected direction: the
*
This is not an SI unit, but is used throughout this paper to facilitate comparison back to the original NBI report. The SI conversion factor is 1 kBtu/ft2/yr = 11.356 MJ/m2/yr)
EUI of Certified buildings was higher than that of Silver buildings, which was higher than that of Gold/Platinum buildings (Gold and Platinum levels were
combined because the study included only two Platinum buildings). Similarly, the median EUI by number of energy performance credits obtained (grouped into four levels <2, 2-4, 5-7, 8-10) suggested a trend in the expected direction: the higher the number of credits the lower the EUI. However, the authors noted that there was a large amount of scatter across the building stock within each of the metrics.
Although building simulation experts are wary to suggest that modelled energy use equates to actual energy use, modelling results do create expectations among those who procure buildings. In fact, the average ratio between
measured and designed EUI was remarkably close to unity, at 0.92, suggesting that modelled results over populations of buildings might represent a reasonable estimate of actual energy performance. However, the ratio for individual projects ranged from less than 0.25 to >2.75, suggesting that experts’ caveats for
individual buildings are well-founded, and that energy modelling can be a poor predictor of project-specific energy performance. The median predicted energy saving (relative to the code baseline) for the LEED buildings was 25%, whereas the median measured saving was is 28%. However, again the range for
individual buildings was wide, with one-in-five buildings using more energy than their baseline.
One important limitation of the analyses performed by Turner & Frankel [2008] is that no statistical tests were performed on the data. Rather, they were content in drawing conclusions based on trends in average values, and calling for more research work in the future to further investigate these trends. However, the large amount of scatter (variability) in the data noted by Turner & Frankel
increases the risk that average trends might be spurious. Another limitation was that the comparisons to CBECS data were somewhat crude: the median EUI of all LEED buildings was compared to the mean EUI of all CBECS buildings, by activity type, thus confounding two different metrics of central tendency. Little specific account was made of differences in the two datasets related to climate zone, building size, or building age. Turner & Frankel did present descriptive data for these variables for each of the datasets, and did comment on differences in their distributions, generally concluding that the differences should not greatly affect the outcomes.
We obtained the dataset used by Turner & Frankel with the goal of adding greater statistical rigour to their original analysis. Turner & Frankel did a
remarkable job in assembling the base dataset, and we were keen to make the most of this achievement by providing supplemental analysis. Such analysis forms part of a larger project we are conducting on post-occupancy evaluation of green buildings.
Methods & Procedures
Comparison of LEED buildings to CBECS data
The original report compared the median EUI for the LEED buildings to the mean EUI in the CBECS database, this was done over all buildings, and also broken down by each activity type. To add more rigour to this comparison we conducted a series of T-tests in which we sought to pair each LEED building with a single matched building from the CBECS dataset. The CBECS matched building was chosen to be as similar as possible to the LEED building in terms of activity type, size, age, and climate zone. Multiple T-tests were conducted that involved differing numbers of buildings, depending on how strict the matching criteria were.
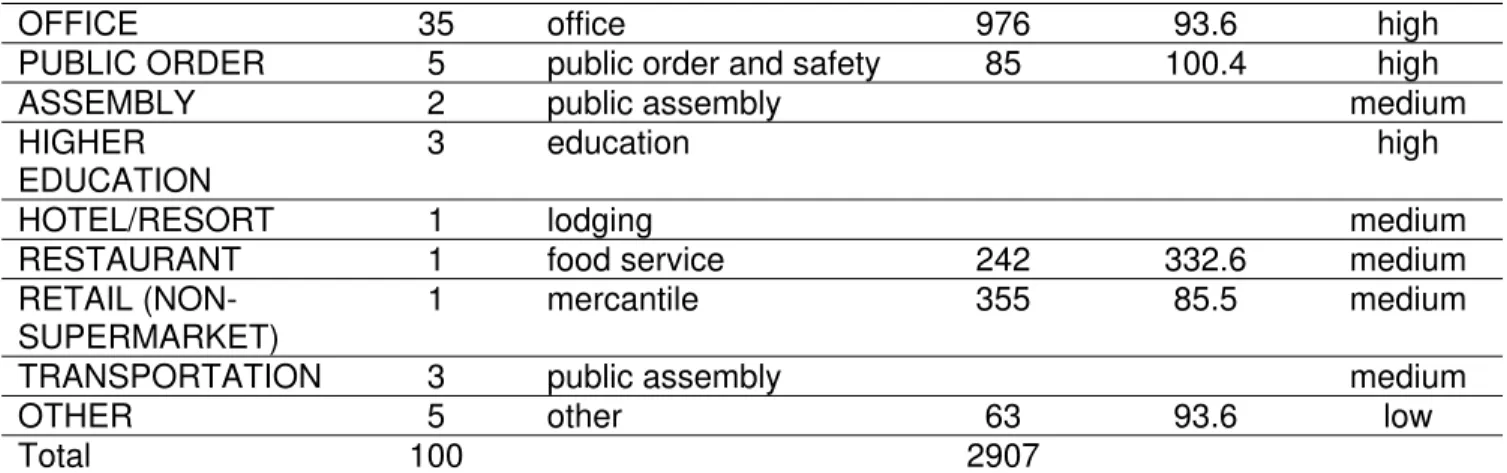
Equivalency of activity types was not straightforward. For LEED activity types, Turner & Frankel [2008] used activity information from owners, which often differed from or clarified the activity type recorded in the LEED submittal. CBECS used a different activity nomenclature than that of LEED. For LEED activity types with four or more buildings we followed Turner & Frankel’s assignment to the equivalent CBECS category. However, Turner & Frankel also created a category called “Remaining Types”, this included buildings for which the activity type was not adequately specified, but it also included LEED activity types for which there were three or fewer buildings, which they judged to be too few to form a meaningful average in their analysis based on averages. We treated these latter activity types separately, and assigned the equivalent CBECS type that seemed most appropriate. Table 2 shows this assignment, the number of buildings in each activity type, and the CBECS mean EUI for each activity type. This assignment was an immediate source of noise in the data. For example, “lodging” in the CBECS database is used primarily for commercial lodging; e.g. motels, but was considered by Turner & Frankel to be the closest match to the primarily residential LEED type “multi-unit res”. To account for issues such as these, we created a “Certainty category” to express our opinion of how good the activity type assignment was; the three levels of certainty in activity type comparisons are shown in Table 2. We conducted T-tests for three levels of inclusion based on this certainty variable: high only, high+medium, and
high+medium+low.
Table 2. Building activity type assignment, the number of buildings in each activity type, and the CBECS mean EUI for each activity type.
LEED activity type Number of LEED buildings Equivalent CBECS activity type Number of CBECS buildings Mean CBECS EUI (kBtu/ft2/yr) Certainty category
INTERP CENTER 9 public assembly 278 97.9 medium
K-12 ED 7 education 648 85.3 high
LIBRARY 4 public assembly medium
MULTI-UNIT RES 6 lodging 260 94.2 medium
OFFICE 35 office 976 93.6 high
PUBLIC ORDER 5 public order and safety 85 100.4 high
ASSEMBLY 2 public assembly medium
HIGHER EDUCATION
3 education high
HOTEL/RESORT 1 lodging medium
RESTAURANT 1 food service 242 332.6 medium
RETAIL (NON-SUPERMARKET)
1 mercantile 355 85.5 medium
TRANSPORTATION 3 public assembly medium
OTHER 5 other 63 93.6 low
Total 100 2907
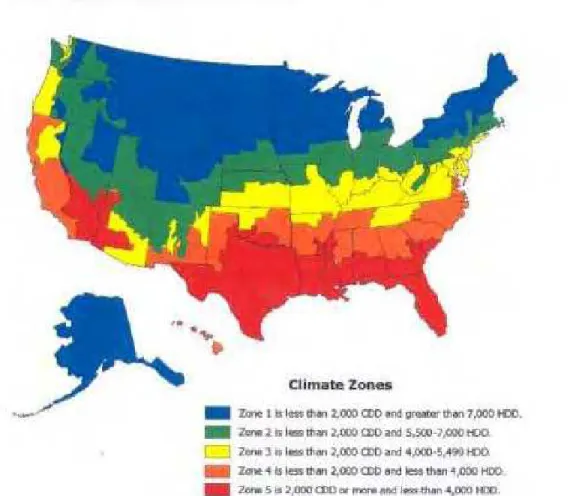
We also used both conservative and liberal matching criteria for the climate zones and building age. This was complicated by the different geographic delineation of climate zones and nomenclature used by LEED and CBECS. Figure 1 shows the climate zone maps, and Table 3 shows the conservative and liberal matching criteria definitions. For building age, the conservative criteria included CBECS buildings from the 2000-2003 category only as possible matches; the liberal criteria also allowed CBECS buildings from the 1990-1999 as possible matches.
Figure 1. LEED (upper) and CBECS (lower) climate zone definitions. Base temperature for Heating Degree Days (HDD) and Cooling Degree Days (CDD) was 65F.
Table 3. Matching criteria for climate zones.
LEED zone Matching CBECS zone
Conservative Liberal 1 5 5 2 5 5 3 5 or 4 5 or 4 or 3 4 3 4 or 3 or 2 5 2 3 or 2 or 1 6 1 2 or 1 7 1 2 or 1
The matching process proceeded as follows. For each LEED building the entire CBECS database was scanned for possible matches. First, the activity types had to be equivalent, as defined in Table 2. Then, the climate zones and age had to be close matches, ‘how close is close enough’ being defined by whether the match was conservative or liberal. Of the possible matching buildings identified, the one closest in terms of floor area, considered in 5% difference
‘bins’, was chosen. A maximum size difference of 50% was allowed. If more than one matching building occupied the same 5% size bin then priority was given to the closest match on the following variables in this order: year of occupation, climate zone, and building size. If this still did not discriminate between potential matches, the first match was chosen. Not all LEED buildings had CBECS matches, depending on the strictness of the matching criteria in each T-test. We further sub-divided the analysis according to whether we allowed a given CBECS building to be matched with more than one LEED building if it was the best match in each case (non-unique), or if a CBECS
building could only have one match (unique). In the case of unique matching, if a particular CBECS building was the best match for more than LEED building, there was some subjectivity in deciding which LEED building would be assigned to it. All analyses were conducted for all medium energy use buildings, and for office buildings only.
We provide one example of the efficacy of the matching process, involving all medium energy use buildings. The analysis involving high+medium+low activity type certainty, liberal matching criteria, and non-unique matches yielded 98 matches of a possible 100. Table 4 shows the distribution of LEED buildings and matched CBECS buildings by climate zone and age, and descriptive statistics for floor area. Given that the climate zone definitions differ, the distributions on this variable can only be approximately compared, and are quite similar. The CBECS buildings are inevitably older, but recall that the analyses involving conservative matching criteria will only use CBECS matches constructed in 2000 and later (and an even tighter climate zone match). The floor area statistics compare very well. Overall, this example illustrates that the matching process is successful in ensuring that as fair a comparison as possible between LEED and CBECS buildings occurs.
Table 4. Example distribution of buildings in LEED and matched CBECS
buildings by climate zone and age, and descriptive statistics for floor area. This example is for the analysis involving high+medium+low activity type certainty, liberal matching criteria, and non-unique matches.
LEED climate zone N CBECS climate zone N
1 2 6 5 13 3 12 4 30 4 36 3 20 5 37 2 23 6 6 1 12 7 1
LEED year occupied N CBECS year of
construction N
1990-1999 55
2000 1 2000-2003 43
2003 17 2004 23 2005 25 2006 1
Year missing 16
LEED floor area, ft2,
mean (s.d.) 112,800 (153,600)
CBECS floor area,
ft2, mean (s.d.) 104,900 (139,300)
For medium energy use buildings we conducted 12 T-tests, for all combinations of activity type inclusion, conservative/liberal matching criteria, and
non-unique/unique CBECS matches. For office buildings we conducted another 4 T-tests, for all combinations of conservative/liberal matching criteria, and non-unique/unique CBECS matches. For each T-test we took the difference between each LEED building’s EUI and their matched CBECS building’s EUI; this set of EUI differences was then tested to see if it was significantly different from zero. We conducted tests for all medium energy use buildings, and for office buildings only.
Energy performance of LEED buildings by certification level
Turner & Frankel’s original report graphed median EUI by LEED certification level and concluded there was a trend in the expected direction. We tested this effect more formally. Prior to this we conducted chi-squared tests on the distribution of building activity type, climate zone, and age, by certification level, and an
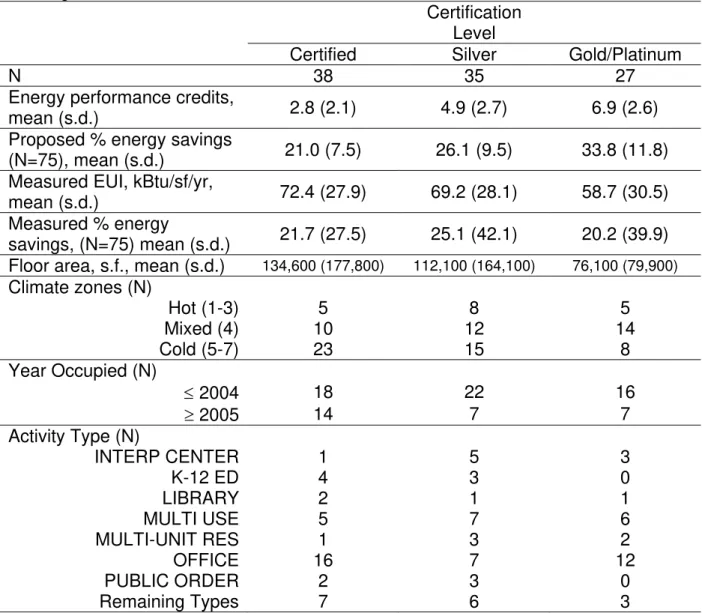
analysis of variance (ANOVA) on the distribution of building size by certification level. These analyses were done for all medium energy use buildings, and for office buildings only. None of these tests was statistically significant, suggesting little risk of bias in the main analysis due to these variables (i.e. LEED Certified buildings as a group are not significantly more often office buildings, in colder climates, or older, than LEED Silver buildings, and so on). Descriptive data for each of these variables, by certification level, is shown in Table 5 for all medium energy use buildings.
We tested the EUI and measured % energy saved compared to modelled baseline by LEED certification level effects by conducting ANOVAs across all certification levels, and specific contrasts to compare adjacent certification levels (i.e. Certified vs. Silver, and Silver vs. Gold/Platinum). One might expect that a higher certification level would generally be attained with a concomitantly higher number of energy performance credits. Indeed, we did observe a statistically significant difference in energy performance credits achieved by certification level, in the expected direction, for all medium energy use buildings (F2,97= 22.2,
p<0.001, variance explained, η2
= 0.31), meaning that 31% of the variance in energy performance credits obtained is explained by knowing the certification level. There was also a statistically significant relationship between these
variables for offices only (F2,32= 18.3, p<0.001, η2= 0.54). This was accompanied
by a statistically significant difference in proposed % energy savings (relative to baseline) by certification level, in the expected direction, for all medium energy
use buildings (F2,72= 10.2, p<0.001, η2= 0.22), and for offices only (F2,25= 14.0,
p<0.001, η2
= 0.53).
Table 5. Descriptive data by LEED certification level, for all medium energy use buildings.
Certification Level
Certified Silver Gold/Platinum
N 38 35 27
Energy performance credits,
mean (s.d.) 2.8 (2.1) 4.9 (2.7) 6.9 (2.6)
Proposed % energy savings
(N=75), mean (s.d.) 21.0 (7.5) 26.1 (9.5) 33.8 (11.8)
Measured EUI, kBtu/sf/yr,
mean (s.d.) 72.4 (27.9) 69.2 (28.1) 58.7 (30.5)
Measured % energy
savings, (N=75) mean (s.d.) 21.7 (27.5) 25.1 (42.1) 20.2 (39.9)
Floor area, s.f., mean (s.d.) 134,600 (177,800) 112,100 (164,100) 76,100 (79,900)
Climate zones (N) Hot (1-3) 5 8 5 Mixed (4) 10 12 14 Cold (5-7) 23 15 8 Year Occupied (N) ≤ 2004 18 22 16 ≥ 2005 14 7 7 Activity Type (N) INTERP CENTER 1 5 3 K-12 ED 4 3 0 LIBRARY 2 1 1 MULTI USE 5 7 6 MULTI-UNIT RES 1 3 2 OFFICE 16 7 12 PUBLIC ORDER 2 3 0 Remaining Types 7 6 3
Of course, certification level is achieved for more than just energy performance, hence the next stage in the analysis.
Energy performance of LEED buildings vs. energy credits received
Turner & Frankel’s original report graphed median energy performance by multi-credit bins and concluded there was a trend in the expected direction. We conducted regression analysis to test this effect more formally. In this case we did not bin data by energy credits, rather we considered all energy credit values
modelled baseline. Analyses were conducted for all medium energy use buildings, and for office buildings only.
Energy performance of LEED buildings vs. additional commissioning and measurement & verification credits
Turner & Frankel’s original report investigated these credits, because they might be expected to affect actual energy use. The report looked at median trends, and found no convincing evidence of an effect of attaining these credits on EUI. We tested the effect of each of these credits on EUI by conducting an ANOVA in which the attainment (or not) of each credit was a separate dichotomous
independent variable. Analyses were conducted for all medium energy use buildings, and for office buildings only.
Results
Comparison of LEED buildings to CBECS data
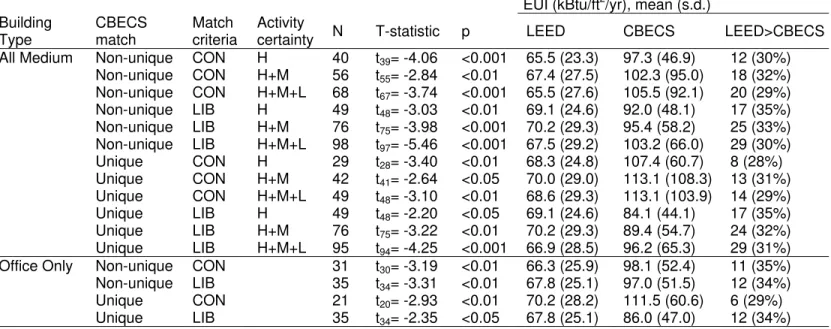
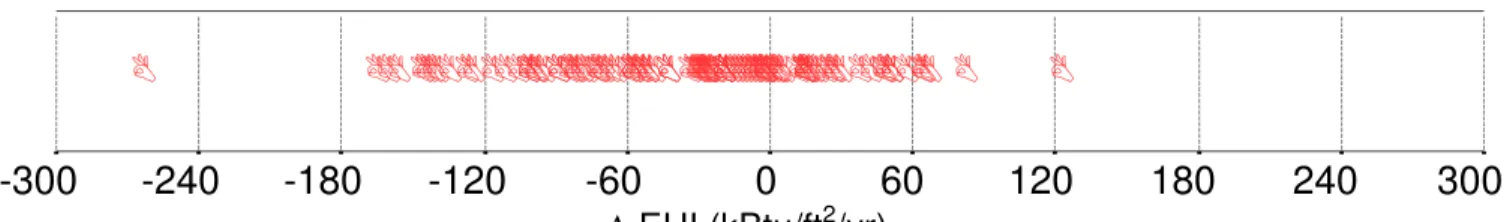
The results of the multiple one-sample T-tests in which LEED buildings were matched with single CBECS buildings are shown in Table 6. For one example analysis, the analysis involving high+medium+low activity type certainty, liberal matching criteria, and non-unique matches (the same example shown in Table 4), Figure 2 shows the LEED to CBECS comparison graphically.
Table 6. Results of the one-sample T-tests, for all medium energy use buildings, and for office buildings only. LEED>CBECS column indicates how many LEED buildings had an EUI greater than their matched CBECS building.
EUI (kBtu/ft2/yr), mean (s.d.)
Building Type CBECS match Match criteria Activity
certainty N T-statistic p LEED CBECS LEED>CBECS All Medium Non-unique CON H 40 t39= -4.06 <0.001 65.5 (23.3) 97.3 (46.9) 12 (30%)
Non-unique CON H+M 56 t55= -2.84 <0.01 67.4 (27.5) 102.3 (95.0) 18 (32%) Non-unique CON H+M+L 68 t67= -3.74 <0.001 65.5 (27.6) 105.5 (92.1) 20 (29%) Non-unique LIB H 49 t48= -3.03 <0.01 69.1 (24.6) 92.0 (48.1) 17 (35%) Non-unique LIB H+M 76 t75= -3.98 <0.001 70.2 (29.3) 95.4 (58.2) 25 (33%) Non-unique LIB H+M+L 98 t97= -5.46 <0.001 67.5 (29.2) 103.2 (66.0) 29 (30%) Unique CON H 29 t28= -3.40 <0.01 68.3 (24.8) 107.4 (60.7) 8 (28%) Unique CON H+M 42 t41= -2.64 <0.05 70.0 (29.0) 113.1 (108.3) 13 (31%) Unique CON H+M+L 49 t48= -3.10 <0.01 68.6 (29.3) 113.1 (103.9) 14 (29%) Unique LIB H 49 t48= -2.20 <0.05 69.1 (24.6) 84.1 (44.1) 17 (35%) Unique LIB H+M 76 t75= -3.22 <0.01 70.2 (29.3) 89.4 (54.7) 24 (32%) Unique LIB H+M+L 95 t94= -4.25 <0.001 66.9 (28.5) 96.2 (65.3) 29 (31%)
Office Only Non-unique CON 31 t30= -3.19 <0.01 66.3 (25.9) 98.1 (52.4) 11 (35%)
Non-unique LIB 35 t34= -3.31 <0.01 67.8 (25.1) 97.0 (51.5) 12 (34%)
Unique CON 21 t20= -2.93 <0.01 70.2 (28.2) 111.5 (60.6) 6 (29%)
Δ EUI (kBtu/ft2
/yr)
Figure 2. Example comparison of the difference in EUI between LEED and matched CBECS buildings. This example is for the analysis involving high+medium+low activity type
certainty, liberal matching criteria, and non-unique matches. Each symbol represents one building pair, a positive value indicates that the LEED building used more energy per floor area than its CBECS counterpart. Mean Δ EUI = -35.8 kBtu/ft2
/yr (s.d. = 64.9, N = 98) % % % % %%%%% %%% %%% % % % % % % %% % % %%% %% % % %%%%% %%% %% %%%%%% %%%%%%%%%% %%%%%%%%%%% %% %%% %% %%%%%%%%%%%% %%%%%% % % % % -300 -240 -180 -120 -60 0 60 120 180 240 300
Energy performance of LEED buildings by certification level
None of the main effect ANOVAs or contrasts for EUI or measured % energy saved were statistically significant, neither for all medium energy use buildings nor office buildings. For conciseness, the detailed outputs of non-significant statistical tests are not presented for this analysis, or the others below.
Energy performance of LEED buildings vs. energy credits received
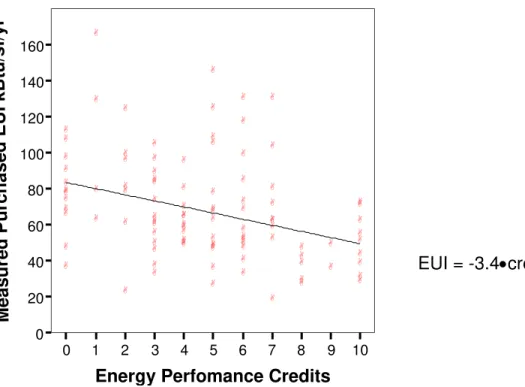
The only statistically significant regression was for EUI for all medium energy buildings (F1,98= 12.8, p≤0.001, variance explained, radj2= 0.11). This effect is
shown graphically in Figure 3. The regressions for EUI for offices only, and for measured % savings relative to modelled baseline for all buildings were not statistically significant.
EUI = -3.4•credits + 83.3
Figure 3. Measured EUI vs. energy credits achieved, for all medium energy use LEED certified buildings in the sample. Individual building values, and best-fit regression line (and equation), are shown.
0 1 2 3 4 5 6 7 8 9 10
Energy Perfomance Credits
0 20 40 60 80 100 120 140 160 M e a s u re d P u rc h a s e d E U I k B tu /s f/ y r $ $ $ $ $ $ $ $ $ $ $ $ $ $ $ $ $ $ $ $ $ $ $ $ $ $ $ $ $ $ $ $ $ $ $ $ $ $ $ $ $ $ $ $ $ $ $ $ $ $ $ $ $ $ $ $ $ $ $ $ $ $ $ $ $ $ $ $ $ $ $ $ $ $ $ $ $ $ $ $ $ $ $ $ $ $ $ $ $ $ $ $ $ $ $ $ $ $ $ $
Energy performance of LEED buildings vs. additional commissioning and measurement & verification credits
We found no effect of the attainment of either or both credits on EUI, neither for all medium energy use buildings nor office buildings.
Discussion
As shown in Table 6, the T-tests, no matter the basis for comparison,
consistently show that LEED buildings use statistically significantly less energy per floor area than CBECS buildings. The results for all medium energy use buildings and for offices only are similar, average savings are in the range 18-39%, depending on the parameters of the comparison. There appears to be a tendency for the savings to be higher for comparisons that are more conservative in terms of matching for age and climate. Savings also tend to be higher for comparisons involving more medium energy use activity types, though the
certainty in matching activity types between the LEED and CBECS database was lower. Unfortunately, we do not have the data to test these tendencies
statistically.
However, despite average savings, 28-35% of LEED buildings used more energy per floor area than their individually-matched CBECS building. Further, there was no statistically significant relationship between LEED certification level and
energy use intensity, or % energy saved vs. baseline. In other words, LEED Silver buildings did not exhibit better energy performance than LEED Certified buildings, and LEED Gold/Platinum buildings did not exhibit better energy performance than LEED Silver buildings. This runs counter to the popular
assumption, and although we found that “higher” certification level was positively correlated with number of energy credits received, certification level does depend on many other credit categories. There were, for example, Certified buildings that received more energy credits than Gold/Platinum buildings.
However, the evidence for a relationship between energy credits achieved (regardless of certification level) and energy outcomes of interest was small. There was a relationship in the expected direction for EUI for all medium energy buildings, but not for office buildings only, and there was no relationship for either building set for measured % savings relative to modelled baseline. There are two points of interest for the regression that was significant. First, radj2= 0.11, this
might seem like a weak relationship, and Figure 3 certainly displays a large
amount of scatter around the regression line. However, to put this in perspective, the relationship between air temperature and reported thermal comfort is similar in size [Schiller et al., 1989]. Clearly, there are many factors beyond air
temperature that affect perceived thermal comfort, and there are many factors that affect actual energy use beyond those that led to achieving LEED energy credits. Second, the equation of the regression line suggests that, as a best estimate, a LEED building receiving zero energy credits used 83.3 kBtu/ft2/yr. This is at ~14% lower than the CBECS mean. This might reflect the mandatory requirement for LEED buildings to at least meet ASHRAE 90.1, a requirement that did not exist for all non-LEED buildings.
The weak relationship between energy performance and energy credits achieved extended to commissioning, and measurement & verification credits. These credits might be expected to have a relationship to energy performance, but we found no such relationship in practice.
What does all this mean? Overall, LEED buildings are saving substantial amounts of energy compared to conventional buildings. This is clearly good news for society: a general program of building green can be expected to reduce energy use per floor area by upwards of 20%. However, despite these average savings, 28-35% of LEED buildings are actually using more energy than their conventional counterparts. While this might not be a problem for society, it is clearly a problem for the owner/operators of these individual buildings, who are not realising the energy performance that they (presumably) expected. Further, the energy-related credits that people are striving for seem to have little relation to measured energy performance. So, on average, the process of thinking and building green saves energy, but the specific measures for which energy credits are awarded do not necessarily meet their intent. These factors might raise questions for the credibility of green building rating systems, which could jeopardise the overall societal benefits.
In addition, there are reasons why green buildings can be expected to command higher real estate values, including their predicted lower energy use and other operating costs, expectations of higher organizational productivity for tenants, and image [Fuerst & McAllister, 2008]. Analysis of commercial real estate financial data provides some support for this hypothesis. Fuerst & McAllister [2008] conducted a regression analysis of more than 3000 US commercial buildings (80% offices), of which more than 500 were designated green (Energy Star [EPA, 2008] or LEED certified). They controlled for confounding factors such as vacancy rate, building age, size, and location, and found a statistically significant, positive effect of green buildings on rental rates and sales
transactions. The significant effects remained when Energy Star and LEED buildings were entered into the regression model separately. The regression model coefficients suggested that LEED buildings commanded a 9.2% higher rent, and a 31% higher sale price. Other recent and similar analyses [Eichholtz et al., 2008; Miller et al., 2008] drawing on the same large database as Fuerst & McAllister, also find a statistically significant positive effects for Energy Star buildings, but only non-significant positive trends for LEED buildings. These analyses are hampered by the relatively small number of LEED buildings in the sample, compared to the large variability between buildings. The relevance to this paper is that part of the allure of LEED buildings contributing to higher real estate values is the assumed better energy performance, if this assumption proves false for a given building, it is likely that the real estate benefits will diminish.
It is important to recognise that these conclusions are drawn from a dataset with many limitations. First, the LEED building data comes from early years of
operation, perhaps the first year, during which “teething problems” or unusual start-up operations will inevitably occur. Second, we have a relatively small sample size, particularly when looking at office buildings only, or in the more conservative comparisons to the CBECS database. The CBECS comparisons are further complicated by differences in building/climate/performance
descriptors. Sample size is a particular concern when there is large variability in the data, as there inevitably is in building energy data. Building-to-building comparisons, as well as comparisons between buildings and their own baselines and modelled performance, can be clouded by a host of on-the-ground design and operational issues. The studies referred to in the Introduction suggest the following key (but by no means inclusive) factors:
- The occupancy hours differ from those in the initial design assumptions - The final as-built building differs from the initial design
- Experimental technologies do not perform as predicted - Plug loads are different than assumed
- The building has not been commissioned properly, and a knowledge transfer gap exists between the design team and end users
Further, Fuerst & McAllister [2008] note that LEED-certified buildings have a higher proportion owner-operators, and particularly public-sector ownership than
commercial buildings generally, and thus may also have systematic feature differences compared to the general population of buildings. Follow up work on the energy performance of green buildings should gather more data on all of these issues, as potential explanations of unexpected performance.
The original NBI analysis has been criticized by some, in particular for comparing LEED median EUI values to CBECS means, and for comparing relatively new LEED buildings to CBECS buildings from all vintages [Malin, 2008]. Our analysis addressed the first issue, and partially-addressed the second. In our analysis phases we did not rely on comparison of averages of any sort to determine if there was an effect, we compared individual building values in sample population statistical tests of significance. If a test was significant, we always compared sample means as a measure of the size of the effect. In our T-tests of matched buildings, we did not allow matches from the CBECS database from years earlier than 1990 (liberal match) or 2000 (conservative match). All tests featuring
conservative matches were statistically significant, with differences in means between the matched LEED and CBECS buildings similar or larger in size to the more liberal tests. Nevertheless, even the CBECS sample after 2000 is, on average, a couple of years older than the LEED sample. It remains possible that newer non-LEED buildings will have better energy performance than the current CBECS sample, due to general improvements in building design and operation. Critics also noted that the average LEED building was much larger than the average CBECS building. We addressed this concern in out T-tests of matched buildings by requiring that matched buildings not differ in floor area by more than 50%; as a result, the difference between the mean floor area in each of the matched building sets was no greater than 10%, and these differences were only statistically significant for the liberal tests. One criticism that we do not have the data to address is that of self-selection in the LEED sample. Building
owners/operators participated voluntarily (of 552 LEED certified buildings that could have been in the sample, data for only 121 was provided), and it is
possible that that those who thought they exhibited better performance would be more likely to participate. Therefore, we recommend that these findings should be considered as preliminary, and the analyses should be repeated when longer data histories from a larger representative sample of green buildings are
available.
Despite these concerns, this is the best data we have so far with which to explore if green buildings are delivering on energy savings. The answer appears to be “Yes, but …”, which is likely no surprise to green building advocates. There are some things in green building performance that need to be improved, but there is enough encouraging news to suggest improvements are worth pursuing. In this context, research work such as this is simply a necessary part of evolving the green building process from "good to better". The results suggest that the energy credit scheme needs to be refined so that it delivers more reliable
performance at the individual building level. One direction for investigation is the definition of an appropriate baseline for a given building, at present there is little
correlation between measured energy savings vs. this baseline and the energy credits received, which are based on predicted savings vs. this baseline.
These results do highlight the importance of investigating the post-occupancy performance of buildings. There is clearly no meaningful way to refine green building rating schemes so that they become more reliable without measured performance data. This work focussed on energy performance, but a similar post-occupancy evaluation process should be followed for other aspects of green building performance, such as indoor environment quality and water use. In the longer-term, if and when post-occupancy evaluation becomes routine, it may be wise for green building certification to require not only sustainable design intent, but also demonstrated sustainable performance after the building is built and operating.
Conclusions
Analysis of measured energy use data from 100 LEED certified buildings yielded the following key findings:
• On average, LEED buildings use 18-39% less energy per floor area than their conventional counterparts.
• However, 28-35% of LEED buildings use more energy than their conventional counterparts.
• Further, the measured energy performance of LEED buildings has little correlation with certification level of the building, or the number of energy credits achieved by the building at design time.
Therefore, at a societal level, green buildings can contribute substantial energy savings, but further work needs to be done to define green building rating schemes to ensure more consistent success at the individual building level.
Acknowledgements
We are deeply indebted to Cathy Turner (New Buildings Institute) and Brendan Owens (US Green Buildings Council) for graciously making the data available for analysis. We are also grateful to Cathy Turner and Harvey Sachs (ACEEE) for their review of an initial draft of this paper. We also thank Jennifer Veitch, Iain Macdonald (both NRC-IRC), and Christoph Reinhart (formerly NRC-IRC, now Harvard University) for their suggestions. This work was supported in part by the Program of Energy Research and Development, administered by Natural
Resources Canada.
References
Baylon, D.; Storm, P. (2008). Comparison of commercial LEED buildings and non-LEED buildings within the 2002-2004 Pacific Northwest commercial building stock. ACEEE Summer Study on Energy Efficiency of Buildings: 4/1 to 4/12.
Diamond, R. et al. (2006). Evaluating the energy performance of the first generation of LEED-certified commercial buildings. ACEEE Summer Study on Energy Efficiency in Buildings: 3/41-3/52.
Eichholtz, P.; Kok, N.; Quigley, J.M. (2008). Doing Well By Doing Good? Green Office Buildings. Retrieved 2008-10-10, from
http://elsa.berkeley.edu/users/quigley/papers.html
EPA, US Environmental Protection Agency. (2008). Retrieved 2008-10-10, from
http://www.energystar.gov/index.cfm?c=new_bldg_design.new_bldg_design
Fowler, K.M.; Rauch, E.M. (2008). Assessing Green Building Performance: A Post Occupancy Evaluation of 12 GSA Buildings. Pacific Northwest National Laboratory Report number PNNL-17393.
Fuerst, F.; McAllister, P.M. (2008). Does it Pay to Be Green? Connecting Economic and Environmental Performance in Commercial Real Estate Markets. Retrieved 2008-10-10, from http://ssrn.com/abstract=1140409
EIA, Energy Information Administration. (2003). Retrieved 2008-09-18, from
http://www.eia.doe.gov/emeu/cbecs/
IPCC, Intergovernmental Panel on Climate Change. (2007). Fourth Assessment Report: Climate Change. Retrieved 2008-09-18, from
http://www.ipcc.ch/ipccreports/assessments-reports.htm.
Malin, N. (2008). Lies, Damn Lies, and... (Another Look at LEED Energy Efficiency). Retrieved 2008-09-18 from
http://www.buildinggreen.com/live/index.cfm/2008/9/2/Lies-Damn-Lies-and-Are-LEED-Buildings-iLessi-Efficient-Than-Regular-Buildings
Miller, N.; Spivey, J.; Florance, A. (2008). Does Green Pay Off? Retrieved 2008-10-10, from
http://www.sandiego.edu/business/documents/July142008DoesGreenPayOff-Ed.pdf
Natural Resources Canada. (2005). National Energy Use Database. Retrieved 2008-09-18, from
http://www.oee.nrcan.gc.ca/corporate/statistics/neud/dpa/data_e/databases.cfm? attr=0.
Pérez-Lombard, L., et al. (2008). A review on buildings energy consumption information. Energy and Buildings 40, 3: 394-398.
Schiller, G.; Arens, E.; Bauman, F.; Benton, C.; Fountain, M.; Doherty, T. (1988). A field study of thermal environments and comfort in office buildings. ASHRAE Final Report No. 462-RP.
Torcellini, P. A. et al. (2004). Lessons learned from the field evaluation of six high-performance buildings. ACEEE Summer Study on Energy Efficiency of Buildings: 3-325 to 3-337.
Turner, C. (2006). LEED building performance in the Cascadia Region: A post occupancy evaluation report. Retrieved 2008-09-18, from
https://www.usgbc.org/chapters/cascadia/docs/pdf/POE_REPORT_2006.pdf
Turner, C. and M. Frankel (2008). Energy performance of LEED for new construction buildings. New Buildings Institute. Retrieved 2008-09-18, from
http://www.newbuildings.org/downloads/Energy_Performance_of_LEED-NC_Buildings-Final_3-4-08b.pdf
USGBC. (2002). LEED-NC Version 2.1. Retrieved 2008-09-18, from