Publisher’s version / Version de l'éditeur:
Acta Pharmacologica Sinica, 36, 4, pp. 463-472, 2015-03-23
READ THESE TERMS AND CONDITIONS CAREFULLY BEFORE USING THIS WEBSITE. https://nrc-publications.canada.ca/eng/copyright
Vous avez des questions? Nous pouvons vous aider. Pour communiquer directement avec un auteur, consultez la première page de la revue dans laquelle son article a été publié afin de trouver ses coordonnées. Si vous n’arrivez pas à les repérer, communiquez avec nous à PublicationsArchive-ArchivesPublications@nrc-cnrc.gc.ca.
Questions? Contact the NRC Publications Archive team at
PublicationsArchive-ArchivesPublications@nrc-cnrc.gc.ca. If you wish to email the authors directly, please see the first page of the publication for their contact information.
This publication could be one of several versions: author’s original, accepted manuscript or the publisher’s version. / La version de cette publication peut être l’une des suivantes : la version prépublication de l’auteur, la version acceptée du manuscrit ou la version de l’éditeur.
For the publisher’s version, please access the DOI link below./ Pour consulter la version de l’éditeur, utilisez le lien DOI ci-dessous.
https://doi.org/10.1038/aps.2014.158
Access and use of this website and the material on it are subject to the Terms and Conditions set forth at
Collateral circulation formation determines the characteristic profiles of
contrast-enhanced MRI in the infarcted myocardium of pigs
Wang, Jian; Xiang, Bo; Lin, Hung-yu; Liu, Hong-yu; Freed, Darren; Arora,
Rakesh C.; Tian, Gang-hong
https://publications-cnrc.canada.ca/fra/droits
L’accès à ce site Web et l’utilisation de son contenu sont assujettis aux conditions présentées dans le site LISEZ CES CONDITIONS ATTENTIVEMENT AVANT D’UTILISER CE SITE WEB.
NRC Publications Record / Notice d'Archives des publications de CNRC:
https://nrc-publications.canada.ca/eng/view/object/?id=b5bc6352-61b9-48f9-b739-3620b62332a3
https://publications-cnrc.canada.ca/fra/voir/objet/?id=b5bc6352-61b9-48f9-b739-3620b62332a3
Acta Pharmacologica Sinica (2015) 36: 463–472
© 2015 CPS and SIMM All rights reserved 1671-4083/15 $32.00 www.nature.com/aps
npg
Collateral circulation formation determines the
characteristic proiles of contrast-enhanced MRI in
the infarcted myocardium of pigs
Jian WANG
1, 2, 3,*, Bo XIANG
2, 3, Hung-yu LIN
2, Hong-yu LIU
4, Darren FREED
2, 3, 5, Rakesh C ARORA
2, 3, 5, Gang-hong TIAN
2, 31Department of Vascular Surgery, Union Hospital, Tongji Medical College, Huazhong University of Science and Technology, Wuhan
430022, China; 2National Research Council, Winnipeg, Manitoba, Canada R3B 1Y6; 3Department of Physiology, Faculty of Medicine,
University of Manitoba, Winnipeg, Manitoba, Canada R3E 3P5; 4Department of Cardiovascular Surgery, the First Afiliated Hospital,
Harbin Medical University, Harbin 150001, China; 5Cardiac Science Program, Institute of Cardiovascular Science, St Boniface General
Hospital, Winnipeg, Manitoba, Canada R2H 2A6
Aim: To investigate the relationship between the collateral circulation and contrast-enhanced MR signal change for myocardial infarction (MI) in pigs.
Methods: Pigs underwent permanent ligation of two diagonal branches of the left anterior descending artery. First-pass perfusion (FPP) MRI (for detecting myocardial perfusion abnormalities) and delayed enhancement (DE) MRI (for estimating myocardial infarction) using Gd-DTPA were performed at 2 h, 7 d and 4 weeks after the coronary occlusion. Myocardial blood low (MBF) was evaluated using nonradioactive red-colored microspheres. Histological examination was performed to characterize the infarcts.
Results: Acute MI performed at 2 h afterwards was characterized by hypoenhancement in both FPP- and DE-MRI, with small and almost unchanged FPP-signal intensity (SI) and DE-SI due to negligible MBF. Subacute MI detected 7 d afterwards showed small but signiicantly increaseing FPP-SI, and was visible as a sluggish hyperenhancement in DE-MRI with considerably higher DE-SI compared to the normal myocardium; the MBF approached the half-normal value. Chronic MI detected at 4 weeks afterwards showed increasing FPP-SI comparable to the normal myocardium, and a rapid hyperenhancement in DE-MRI with even higher DE-SI; the MBF was close to the normal value. The MBF was correlated with FPP-SI (r=+0.94, P<0.01) and with the peak DE-SI (r=+0.92, P<0.01) at the three MI stages. Remodeled vessels were observed at intra-infarction and peri-infarction zones during the subacute and chronic periods. Conclusion: Progressive collateral recovery determines the characteristic proiles of contrast-enhanced MRI in acute, subacute and chronic myocardial infarction in pigs. The FPP- and DE-MRI signal proiles not only depend on the loss of tissue viability and enlarged interstitial space, but also on establishing a collateral circulation.
Keywords: myocardial infarction; myocardial reperfusion; contrast media; magnetic resonance imaging; gadolinium DTPA; coronary circulation; pigs; time factors
Acta Pharmacologica Sinica (2015) 36: 463–472; doi: 10.1038/aps.2014.158; published online 23 Mar 2015
Original Article
Introduction
Severe interruption of the blood supply leads to cardio
myocyte necrosis that is characterized by disruption of the myocyte cell membrane. The loss of the myocyte membrane integrity allows the extracellular contrast agent to penetrate into the intracellular compartment, generating an enlarged partition coefficient of gadoliniumdiethylenetriaminepen
taacetic acid (GdDTPA)[1, 2]
. Consequently, the acutely infarcted myocardium appears as a hyperintense, bright
region on delayed gadoliniumenhanced MR imaging. With the progression of infarction remodeling, the necrotic myocardium eventually evolves into collagenous scar tissue. The pathological features of the chronic scar infarction consist of discrete collagen meshwork and loss of cellularity, leading to an enlarged interstitial space between collagen ibers. The enlarged interstitial compartment is accessible to extracellular contrast agents; therefore, chronic myocardial infarction is also associated with an increased local distribution of contrast agents[3–5]
. Accordingly, chronic scar infarction is observed as
hyperenhancement with delayed enhancement MRI[6, 7]
. Contrast materialenhanced MR imaging depends not only on the cell membrane integrity and loss of cellularity
*To whom correspondence should be addressed. E-mail jianwang1030@126.com
but also on the patency of the vasculature that supports the infarcted myocardium as well as on the regional myocardial blood low. An acute reperfused myocardial infarction can be identified as a central black hypoenhanced core surrounded by a bright hyperenhanced rim on delayed enhancement MRI[8, 9]
. An altered MR contrast enhancement pattern in the acute reperfused myocardial infarction is primarily due to the regional difference in the microvascular blood flow between the core and rim[8, 9]
. The hypoenhanced core on MRI is characterized by the profoundly reduced myocardial blood flow and reflects the widespread microvascular obstruction from erythrocyte stasis and neutrophil accumulation during the reperfusion period[10]
. The hyperenhanced rim on MRI is mostly attributed to the restoration of reperfused blood low, which allows contrast agents to enter into the intracellular
space of dead cardiomyocytes[10]
. Moreover, the regional myocardial blood low has a critical impact on the wash-in and washout patterns of contrast agents. Kim et al demonstrated that the prolonged washout kinetics of the contrast agent is the main mechanism for the delayed hyperenhancement in acute reperfused infarction[11]
.
Myocardial ischemia and infarction stimulate the devel opment of a coronary collateral circulation, leading to a progressive increase in the myocardial blood flow that supplies the infarcted myocardium. The jeopardized myocardium in acute, subacute, and chronic infarctions does not differ significantly in terms of the loss of tissue viability and enlarged interstitial space; nonetheless, these are widely different in the histological structure and collateral circulation[12, 13]
. We hypothesized that the difference in the collateral circulation among the three phases of myocardial infarctions could be responsible for the alteration in the cardiac MRI profiles during the firstpass and steady state of the contrast agent. The present study was designed to determine the potential relationship between the regional collateral blood low and contrast-induced MR signal changes for three differ ent stages of myocardial infarctions.
Materials and methods
This study was carried out in strict accordance with the rec ommendations in the Guide for the Care and Use of Labora tory Animals of National Research Council of Canada and Huazhong University of Science and Technology. The proto col was approved by the Committee on the Ethics of Animal Experiments of National Research Council of Canada and Huazhong University of Science and Technology.
A pig model of myocardial infarction
The pig heart is similar to the human heart in its size,
anatomy, metabolism, and collateral circulation[14, 15]
. As a result, domestic pigs were chosen as the animal model for this study.
After the induction of anesthesia, eighteen domestic pigs, weighing 20–25 kg, were intubated and ventilated with gas anesthesia consisting of 1%–2% isoflurane in a mixture of oxygen and nitrous oxide. Using a sterile technique, a lateral
thoracotomy was performed at the fourth left intercostal space to expose the heart. The pericardium was opened. The first and second diagonal branches of the left anterior descending coronary artery were permanently ligated at their origins. Complete occlusion of the vessels was conirmed by visualization of the regional myocardial cyanosis. The animals in the acute (n=6), subacute (n=6) and chronic (n=6) infarction groups were imaged in an MR scanner at approximately 2 h, 7 d, and 4 weeks after the coronary ligation procedure, respectively.
Magnetic resonance imaging
MR imaging was performed in a 3.0T MR imaging unit (Mag netom Vision; Siemens Medical System, Erlangen, Germany) equipped with a fiveelement cardiac phasedarray coil. Stable anesthesia was maintained during the entire course of the experiment; the blood pressure and pulse rate were also monitored. Electrocardiographic signals were used to trigger MRI data acquisitions over multiple heart beats. Because all pigs underwent mechanical ventilation during the examina tion, a breathhold state could easily be achieved by stopping mechanical ventilation during image acquisition.
Firstpass perfusion MR imaging was used to detect myo cardial perfusion abnormalities. A dose of 0.2 mmol per kilo gram of body weight of GdDTPA (Magnevist; Bayer Schering Pharma AG, Berlin, Germany) was administered intrave nously at a rate of 3 mL/s with a power injector (Spectris Solaris; Medrad, Warrendale, PA, USA). Immediately after injection, one image per R–R interval was acquired for the next 60 heartbeats at the apical, midventricular and basal sections along the short axis of the heart using a multislice saturation recovery TurboFLASH sequence. The imaging parameters were as follows: repetition time, 2.4 ms; echo time, 2.17 ms; temporal resolution, 150.97 ms; slice thickness, 5 mm; ield of
view, 360×270 mm2
; and acquisition matrix, 128×96.
Delayed enhancement MR imaging was used to estimate myocardial infarction. At 8 min after injection, delayed enhancement MR imaging was performed in three shortaxis left ventricular sections at the apical, midventricular and basal
levels by an inversionrecovery prepared T1weighted gradient
echo sequence. MR images were obtained at 4min intervals for a total of 36 min. The imaging parameters were as follows: lip angle, 20º; echo time, 1.56 ms; repetition time, 564 ms; slice
thickness, 5 mm; ield of view, 225×270 mm2
; and acquisition matrix, 192×256. The inversion time varied from 200 to 300 ms according to the myocardium nulling. A recent study empha sized the importance of adjusting the inversion time after the administration of contrast agents, because the concentration of
gadolinium decreased continuously after injection[16, 17]
. Measurement of the myocardial blood low
At end of the MRI sessions, approximately 5×10⁶
–8×10⁶
nonradioactive redcolored microspheres (15±1.9 µm diameters, suspended in 2 mL of saline solution) were injected into the left atrium. Arterial reference samples were simultaneously withdrawn from the ascending aorta
465 www.chinaphar.com
Wang J et al
Acta Pharmacologica Sinica
npg
at a constant rate of 5 mL/min for 3 min, starting 1 min before injection of the microspheres. The pig hearts were then removed from the animals under fulldepth anesthesia. The hearts were sectioned along the cardiac short axis. Myocardial samples were collected from the left ventricular wall in a pieshape. The blood samples collected from the aorta and myocardial samples were digested. The numbers of microspheres in the samples were counted using a spectrophotometer at a wavelength of 536 nm. Blood low was then calculated based on the microsphere count in the tissue and blood samples as well as the speed of blood collection. Histological examination
Postmortem tissue samples from the infarct and periinfarct regions were examined by histopathology. The samples were fixed in 10% formalin, embedded in paraffin, and sectioned with 8-μm thickness. Sections were stained with hematoxylin and eosin. Masson’s trichrome stain was used to define the scarred myocardium.
MR image analysis
MRI data analysis was performed using freely available soft ware (Segment, Version 1.8R0438, http://segment.heiberg. se) with consensus between two experienced observers who were blinded to all experimental data. The images were ana lyzed at the end of the study to avoid issues, such as learning bias. The area of myocardial infarction was defined as the myocardium with signal intensity lower or higher than 2 stan dard deviations above the mean signal intensity of the remote
normal myocardium[18]
. A region of interest (ROI) was placed in the hypoenhanced or hyperenhanced areas, if present; left ventricular cavity and remote areas opposite of the infarct ter ritory. The contrast ratio was calculated as the signal intensity in the infarction area divided by that in the remote area before contrast injection. The changes in the signal intensity of the delayed enhancement were plotted against time. The cross sectional areas of the infarcted myocardium were measured at the papillary muscle level in the shortaxis views of delayed enhancement MRI.
The locations of these regions (the hypoenhanced region, hyperenhanced region, and remote normal myocardium and left ventricular cavity) were then transferred to the irst-pass perfusion images. Care was taken to define the regions of interest several pixels from epicardial and endocardial sur faces to avoid partial volume effects. Myocardial firstpass time intensity curves were then generated within these regions for the passage of the contrast agent. The time intensity curves were normalized by expression of all signal intensity of the irst-pass enhancement as a percentage of the fully relaxed intensity.
Statistical analysis
All numerical results were presented as the mean±standard deviation. Statistical analysis was performed using Statistica (Statsoft Inc, Tulsa, OK). Differences in the signal intensity between the normal and infarcted myocardium at speciic time
points were analyzed by the Bonferroni t test. The changes over time in the signal intensity obtained from the infarcted myocardium were compared with the patterns obtained from the normal myocardium by repeated measures analysis of variance (ANOVA). The differences in the myocardial blood flow and infarct size were determined with a paired t test. Moreover, the correlation between the myocardial blood low and contrastenhanced signal intensity or infarct size was determined by linear regression analysis. A Pvalue <0.05 indicates statistical signiicance.
Results
Acute myocardial infarction
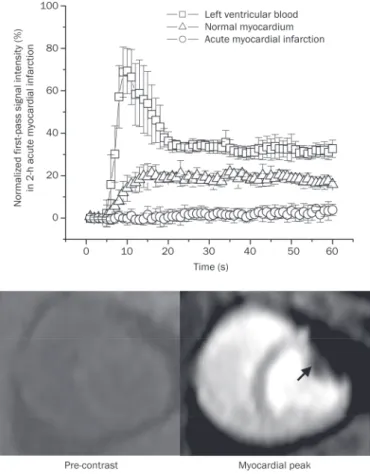
Two hours after permanent coronary occlusion, a bolus injection of GdDTPA resulted in a substantial signal increase in both the left ventricular blood and normal myocardium (upper panel, Figure 1). Nonetheless, the signal intensity of the acutely infarcted myocardium did not change signiicantly during the irst pass of the contrast agent (from 0.17%±0.91% to 2.2%±0.9% of the precontrast baseline level) (upper panel, Figure 1). Therefore, firstpass perfusion MRI identified
Figure 1. Time intensity curves and representative images of first-pass perfusion MRI in acute myocardial infarction. The irst-first-pass signal intensity in acutely infarcted myocardium did not change significantly, whereas the remote myocardium had a substantial signal elevation during the irst pass of the contrast agent (upper panel). Therefore, irst-pass perfusion MRI identified the acute myocardial infarction as a region of perfusion defect with hypoenhancement (arrowheads, lower panel).
acute myocardial infarction as a perfusion defect area with hypoenhancement (arrowheads, lower panel, Figure 1).
Likewise, the acutely infarcted myocardium did not have significantly increased signal intensity during the period of delayed enhancement. The delayed enhancement signal intensities in the acutely infarcted myocardium varied only from 35.9%±27.0% to 38.1%±23.2% of the initial baseline value for different post-contrast time points and were signii cantly lower than those observed in the normal myocardium, which varied from 473.5%±36.6% to 156.1%±29.4% of the initial baseline value (upper panel, Figure 2). Accordingly, the acutely infarcted myocardium was identiied as a region of hypoenhancement relative to the normal myocardium on delayed enhancement MRI (lower panel, Figure 2). As expected, no meaningful blood low was found in the acutely
infarcted myocardium (0.06±0.01 mL·min1·g1
) (Figure 3A).
Subacute myocardial infarction
Seven days after permanent coronary occlusion, the subacutely infarcted myocardium showed a relatively small but signiicant increase in signal intensity during the irst pass of the contrast agent (upper panel, Figure 4). The peak irst-pass signal intensity in subacutely infarcted myocardium reached 11.9%±2.4% of the precontrast baseline value and was signiicantly higher than that observed in the acutely infarcted
myocardium (2.2%±0.9%); nonetheless, it was still signiicantly lower than that in the normal myocardium (24.8%±3.6%) (upper panel, Figure 4).
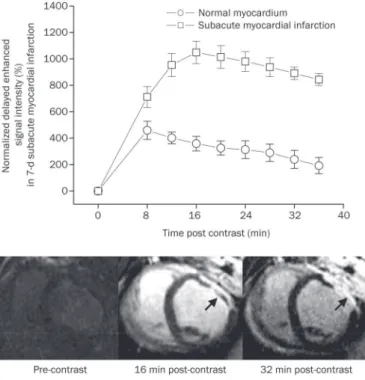
The delayed enhancement signal intensity in the sub acutely infarcted myocardium varied from 1048.3%±84.5% to 701.4%±79.9% of the initial baseline value for different post contrast time points and was considerably higher than that in the normal myocardium, which varied from 459.2%±68.6% to 192.4%±61.8% of the initial baseline value (upper panel, Figure 5). Therefore, the subacutely infarcted myocardium was observed as a hyperenhanced zone on delayed enhance ment MRI (arrowheads, lower panel, Figure 5). Moreover, the infarcted epicardium had an earlier hyperenhancement than the infarcted endocardium. The infarcted epicardium acquired the hyperenhancement at 16 min postcontrast; while trans mural delayed hyperenhancement was ultimately observed at 32 min postcontrast. The subacutely infarcted myocardium also showed a certain degree of regional myocardial blood
low (0.46±0.15 mL·min1·g1
), which was considerably higher than that in the acutely infarcted myocardium (0.06±0.01 mL·min1·g1
) (Figure 3A). Chronic myocardial infarction
Four weeks after permanent coronary occlusion, a bolus injection of GdDTPA resulted in a rapid and uniform signal increase in both the chronic infarction and normal myocar dium during the irst pass of the contrast agent (upper panel, Figure 6). The irst-pass signal intensity in the chronic infarc tion and normal myocardium increased from 5.6%±1.3% to 25.2%±3.4% and from 6.2%±1.5% to 28.3%±3.8% relative to the baseline value, respectively (upper panel, Figure 6). Therefore, the firstpass perfusion MRI may be unable to distinguish between the chronic infarction and normal myocardium (lower panel, Figure 6).
The delayed enhancement signal intensity in the chronically infarcted myocardium varied from 1455.8%±83.5% to 997.2%±83.3% of the initial baseline value for different post contrast time points and was considerably higher than that in the normal myocardium, which varied from 447.9%±51.5% to 199.1%±65.5% of the initial baseline value (upper panel, Figure 7). Thus, the chronically infarcted myocardium was identi fied as the bright region of hyperenhancement on delayed enhancement MRI (arrowheads, lower panel, Figure 7). Trans mural delayed hyperenhancement was rapidly achieved at 16 min post-contrast. The regional myocardial blood low in
the chronically infarcted myocardium (0.91±0.10 mL·min1·g1
) was markedly higher than that in the subacutely infarcted
myocardium (0.46±0.15 mL·min1·g1
) and not significantly different from that in the normal myocardium (1.05±0.11 mL·min1·g1
) (upper and left panel, Figure 3).
Correlation between the myocardial blood flows and contrast-induced MR signal changes
The regional myocardial blood lows were 0.06±0.01, 0.46±0.15,
and 0.91±0.10 mL·min1·g1
in the acutely, subacutely and chronically infarcted myocardium, respectively (upper and
Figure 2. Time intensity curves and representative images of delayed enhancement MRI in acute myocardial infarction. The delayed enhance-ment signal intensity in acutely infarcted myocardium remained almost unchanged (upper panel). Therefore, the acute myocardial infarction appeared hypoenhanced relative to the normal myocardium on delayed enhancement MRI (arrowheads, lower panel).
467 www.chinaphar.com
Wang J et al
Acta Pharmacologica Sinica
npg
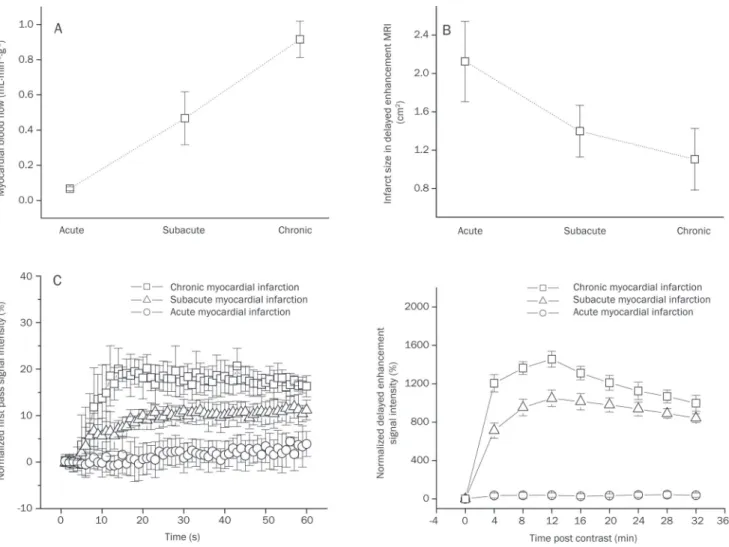
left panel, Figure 3). The crosssectional areas of the infarcted
myocardium were 2.12±0.42, 1.39±0.27, and 1.11±0.32 cm2
in acute, subacute and chronic infarction, respectively (upper and right panel, Figure 3), and the area covered by the infarcted myocardium showed a trend of decreasing with the progressive collateral circulation recovery during post infarction remodeling. Interestingly, the peak irst-pass signal intensities in the infarcted regions also increased gradually from 2.2%±0.9% of the precontrast baseline value for acute infarction, to 11.1%±2.4% for subacute infarction, and ulti mately to 20.1%±2.9% for chronic infarction (lower and left panel, Figure 3). Moreover, the peak signal intensities of delayed enhancement in the infarcted regions were signifi cantly and progressively elevated from 38.1%±23.2% of the initial baseline value for acute infarction, to 1048.3%±84.4% for subacute infarction, and eventually to 1455.8%±83.5% for chronic infarction (lower and right panel, Figure 3).
More importantly, the myocardial blood flows in the infarcted myocardium were positively correlated with the
peak signal intensities during the firstpass (r=0.94, P<0.01) (top panel, Figure 8) and delayed enhancement (r=0.92,
P<0.01) (middle panel, Figure 8). The results of this study also
showed a strong negative correlation between the regional myocardial blood flows and crosssectional areas of the infarcted myocardium (r=0.82, P<0.01) (bottom panel, Figure 8).
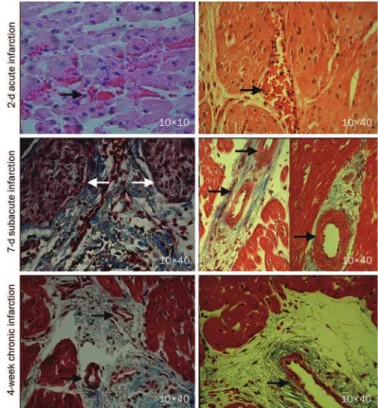
Histological characteristics of the infarcted myocardium
Inflammatory cell infiltration and intramyocardial hemor rhage, suggesting microvascular damage, were observed in the acute myocardial infarctions (black arrowheads, top panel, Figure 9). In the subacute myocardial infarctions, the myo cytes were replaced by granulation tissue (white arrowheads) and early collagen protein content; large thickwalled blood vessels were apparent at the periinfarction zone with small areas of interstitial ibrosis (black arrowheads, middle panel, Figure 9). The chronic myocardial infarctions contain dense collagen with numerous intact microvessels (black arrow
Figure 3. The myocardial blood flow, infarct size, first-pass perfusion and delayed enhancement signal intensity in acute, subacute, and chronic infarctions. The regional myocardial blood lows in the infarcted areas were progressively recovered with the evolution of the myocardial infarction (A). The infarct size tended to decrease with the development of post-infarction remodeling (B). Interestingly, there were gradual increases in the peak signal intensities for both irst-pass perfusion and delayed enhancement (C).
heads, bottom panel, Figure 9). The remodeled vessels in heal ing infarctions were likely responsible for the reestablishment of tissue perfusion that supports contrast transportation.
Discussion
The firstpass signal intensity could be plotted as a func tion of time to characterize the transmit kinetics of contrast material. The analysis of time intensity curves and irst-pass images could reflect regional variations in the myocardial blood low [19, 20]
. The extent of a signal increase as a function of the input function correlates well with the microsphere
blood low measurement[21]
. A delayed enhancement image, on the other hand, highlights the infarcted myocardium with the increased distribution volume or coefficient of contrast agents[1, 2]. The distribution coeficient of contrast agents in the
injured myocardium depends on the cell membrane integrity and the volume of interstitial space[3–5]
. Pathological processes sequentially undergo extensive cardiomyocyte necrosis, granulation tissue formation and collagenous scar remodeling at three different stages of healing infarctions, which are asso ciated with the loss of tissue viability and enlarged interstitial tissue that is suitable for the contrast accumulation. There
fore, collateral recovery is another critical factor affecting the contrast materialenhanced MR patterns at the three different stages of healing infarctions after permanent coronary occlu sion.
Lack of collateral flow and the hypoenhancement of first-pass perfusion and delayed enhancement MRIs in acute myocardial infarction
The acutely infarcted myocardium did not show an increase in signal intensity on either firstpass perfusion or delayed enhancement MRIs in spite the presence of irreversibly injured myocardium. The hypoenhancement in the acute myocardial infarction was mainly due to the lack of meaningful myo cardial blood flow for delivering contrast agents to the infarcted region. The histological indings included inlamma tory cell iniltration and intramyocardial hemorrhage, which were indicative of microvascular damage. The “no reflow” phenomenon in acute occlusive myocardial infarction was also demonstrated with the colored microsphere technique. Lee et
al have demonstrated that myocardial ischemia caused by the
occlusion of a cat coronary artery is hypoenhanced relative to
the normal myocardium[22]
. Wang et al demonstrated that the nonreperfused occlusive infarct exhibits a irst-pass perfusion defect without any delayed hyperenhancement at 4 h after
coronary occlusion[23]
. Thus, the disappearance of delayed
Figure 4. Time intensity curves and representative images of the irst-pass perfusion MRI in subacute myocardial infarction. The first-irst-pass signal intensity in subacute infarction had a degree of elevation that was still lower than that in the normal myocardium. Therefore, the subacute myocardial infarction was identiied as a region of hypoenhancement on irst-pass perfusion MRI (arrowheads, lower panel).
Figure 5. Time intensity curves and representative images of delayed enhancement MRI in subacute myocardial infarction. The delayed enhancement signal intensity in the subacute infarction was signiicantly higher than that in the normal myocardium (upper panel). The infarcted epicardium displayed an earlier hyperenhancement than the infarcted endocardium. The infarcted epicardium acquired hyperenhancement at 16 min post-contrast, while transmural hyperenhancement was ultimately observed at 32 min post-contrast (arrowheads, lower panel).
469 www.chinaphar.com
Wang J et al
Acta Pharmacologica Sinica
npg
hyperenhancement is not necessarily an indication of viable myocardium. The signal changes of irst-pass perfusion and delayed enhancement do not depend on the loss of myocardial viability; instead, they depend on the regional myocardial blood low in an acute occlusive myocardial infarction.
The partially restored collateral low and sluggish hyper enhance ment in subacute myocardial infarction
In 7d subacute myocardial infarction, a bolus injection of contrast agents resulted in a relatively small but significant elevation on firstpass signal intensity in the infarcted myo cardium even though the magnitude of the signal increase in the infarcted myocardium was less pronounced than in the normal myocardium. The subacute myocardial infarction had
some collateral circulation (0.46±0.15 mL·min1·g1
), reach ing approximately half of the myocardial blood flow in the normal myocardium. Large, thickwall vessels were present at the periinfarct zone in subacutely infarcted myocardium. Partially restored myocardial blood flow through newly developed collateral vessel has facilitated delivery of contrast agents into the subacutely infarcted myocardium, resulting in some delayed hyperenhancement. The hyperenhancement
was faster in infarcted epicardium than in infarcted endo cardium. The infarcted epicardium acquired the delayed hyperenhancement at 16 min postcontrast, while transmu ral hyperenhancement was ultimately achieved at 32 min postcontrast. The discrepancy in the delayed enhancement between these two infarcted regions might be attributed to the heterogeneous collateral circulation. It has been demon strated that coronary collateral vessels within the epicardium can anastomose with both extracardiac vessels originat ing outside of the heart and intracardiac coronary vessels
branching from the other coronary artery[24, 25]
. Conversely, the endocardial collateral circulation relies primarily on the
intracoronary anastomosis[24, 25]
. Therefore, the subacute myocardial infarction is identified as a region of sluggish hyperenhancement on delayed enhancement MRI.
Nearly normal collateral low and the rapid hyperenhancement in chronic myocardial infarction
In 4week chronic myocardial infarction, a bolus injection of GdDTPA resulted in a similar signal increase in both infarcted and normal myocardium. Our previous study also demon strated that the bolus of extracellular or intravascular contrast
agents caused a rapid and dramatic decline in the irst-pass T2*
signal intensity in both the scarred and normal myocardium[26]
. These indings strongly indicate that the occurrence and devel opment of collateral circulation results in a substantial res
Figure 6. Time intensity curves and representative images of irst-pass perfusion MRI in chronic myocardial infarction. The first-pass signal intensity in chronic infarction was not significantly different from that in normal myocardium (upper panel). Therefore, first-pass perfusion MRI could not distinguish between chronic infarction and the normal myocardium (lower panel).
Figure 7. Time intensity curves and representative images of delayed enhancement MRI in chronic myocardial infarction. Delayed enhancement signal intensity in chronic infarction was signiicantly higher than that in the normal myocardium (upper panel). Therefore, the chronic infarction was rapidly hyperenhanced at 16 min after contrast injection (arrowheads, lower panel).
toration of regional myocardial blood low in chronic infarc tion. Masson’s trichrome staining showed that the scar tissue consisted of dense collagen, massive residual capillaries, and dilated vessels. Microsphere measurements also showed that regional myocardial blood low in chronically infarcted myo cardium was comparable to that in the normal myocardium. Massive contrast agents could be rapidly delivered into the chronically infarcted myocardium through numerous, uni formly distributed vessels. Microvessels within the scar
infarction allow extracellular contrast agents to penetrate into the interstitial compartment, and the discrete collagen iber meshwork and loss of cellularity enlarged the interstitial space that is accessible to extracellular contrast agents[27]
. As a result, a rapid homogeneous hyperenhancement was appar ent in chronic myocardial infarction on delayed enhancement MRI. Many investigators have also observed that chronic scar infarction is associated with hyperenhancement after contrast injection[6, 7]
. The hyperenhancement is closely related to the elevated concentration and increased distribution volume of gadolinium contrast within a chronic scar infarction relative
to the normal myocardium[3–5]
. Previous studies have shown that the pig hearts develop a significant collateral network with a substantial increase in collateral low after 3 to 4 weeks
of progressive coronary artery occlusion[15, 24]
. An animal study that was similar to ours reported that the collateral low supporting the infarction scar increases dramatically at 4
weeks after permanent coronary artery occlusion[28]
.
Conclusion
In this study, 2h acute, 7d subacute, and 4week chronic myocardial infarctions were selected as representative phases
Figure 8. Correlations between the myocardial blood lows and peak MR signal intensities or infarct sizes. The regional myocardial blood lows, infarct sizes and MR signal intensities were obtained in the three stages of myocardial infarctions. A strong correlation between the regional blood low and peak signal intensity was noted in the infarcted myocardium for both irst-pass perfusion MRI (r=0.94, P<0.01) (top panel) and delayed enhancement MRI (r=0.92, P<0.01) (middle panel). Moreover, regional myocardial blood lows were negatively correlated with the infarct areas of the pig hearts (r=-0.82, P<0.01) (bottom panel).
Figure 9. Histopathology of the acute, subacute, and chronic myocardial infarctions. The acute myocardial infarction exhibited inlammatory cell infiltration and intramyocardial hemorrhage (arrowheads, top panel). The subacute myocardial infarction contained early collagen protein and granulation tissue (white arrowheads, middle panel). Large, thick-walled blood vessels were detected in the peri-infarct regions of the subacutely infarcted myocardium (black arrowheads, middle panel). Remodeled vessels with varying sizes were frequently observed in the case of chronic scar infarction (black arrowheads, bottom panel).
471 www.chinaphar.com
Wang J et al
Acta Pharmacologica Sinica
npg
of infarction healing. The nonreperfused occlusive myocardial infarction sequentially underwent three distinctive stages of regional myocardial blood flow, starting from a lack of collateral flow for acute infarction, followed by partially restored collateral flow for subacute infarction and, finally, nearnormal collateral flow for chronic infarction. Accord ingly, delayed enhancement MRI revealed hypoenhancement, sluggish hyperenhancement and rapid hyperenhancement in acute, subacute, and chronic myocardial infarctions, respectively. We conclude that the contrast agentenhanced MRI signal intensity depends not only on the loss of tissue viability and enlarged interstitial space, it also depends on the establishment of a collateral circulation.
Acknowledgements
We would like to acknowledge the funding support pro vided by the National Natural Science Foundation of China (No 81200105), the China Postdoctoral Science Foundation (No 20100470050), the Canadian Institute of Health Research (CIHR), and the National Research Council of Canada (NRC).
Author contribution
All authors participated in the design and execution of the experiments, the analysis and interpretation of the data, and the drafting and critical evaluation of the manuscript. All authors have read and approved the submitted manuscript.
References
1 Klein C, Schmal TR, Nekolla SG, Schnackenburg B, Fleck E, Nagel E. Mechanism of late gadolinium enhancement in patients with acute myocardial infarction. J Cardiovasc Magn Reson 2007; 9: 653–8. 2 Pereira RS, Prato FS, Wisenberg G, Sykes J. The determination of
myocardial viability using Gd-DTPA in a canine model of acute myo-cardial ischemia and reperfusion. Magn Reson Med 1996; 36: 684– 93.
3 Pereira RS, Prato FS, Lekx KS, Sykes J, Wisenberg G. Contrast-enhanced MRI for the assessment of myocardial viability after per-manent coronary artery occlusion. Magn Reson Med 2000; 44: 309–16.
4 Rehwald WG, Fieno DS, Chen EL, Kim RJ, Judd RM. Myocardial magnetic resonance imaging contrast agent concentrations after reversible and irreversible ischemic injury. Circulation 2002; 105: 224–9.
5 Klein C, Nekolla SG, Balbach T, Schnackenburg B, Nagel E, Fleck E, et
al. The inluence of myocardial blood low and volume of distribution on late Gd-DTPA kinetics in ischemic heart failure. J Magn Reson Imaging 2004; 20: 588–93.
6 Kirschner R, Toth L, Varga-Szemes A, Simor T, Suranyi P, Kiss P, et
al. Differentiation of acute and four-week old myocardial infarct with
Gd(ABE-DTTA)-enhanced CMR. J Cardiovasc Magn Reson 2010; 12: 22.
7 Abdel-Aty H, Zagrosek A, Schulz-Menger J, Taylor AJ, Messroghli D, Kumar A, et al. Delayed enhancement and T2-weighted cardio-vascular magnetic resonance imaging differentiate acute from chronic myo cardial infarction. Circulation 2004; 109: 2411–6.
8 Judd RM, Lugo-Olivieri CH, Arai M, Kondo T, Croisille P, Lima JA, et
al. Physiological basis of myocardial contrast enhancement in fast
magnetic resonance images of 2-day-old reperfused canine infarcts.
Circulation 1995; 92: 1902–10.
9 Rochitte CE, Lima JA, Bluemke DA, Reeder SB, McVeigh ER, Furuta T,
et al. Magnitude and time course of microvascular obstruction and
tissue injury after acute myocardial infarction. Circulation 1998; 98: 1006–14.
10 Bremerich J, Wendland MF, Arheden H, Wyttenbach R, Gao DW, Huberty JP, et al. Microvascular injury in reperfused infarcted myo-cardium: noninvasive assessment with contrast-enhanced echoplanar magnetic resonance imaging. J Am Coll Cardiol 1998; 32: 787–93. 11 Kim RJ, Chen EL, Lima JA, Judd RM. Myocardial Gd-DTPA kinetics
determine MRI contrast enhancement and reflect the extent and severity of myocardial injury after acute reperfused infarction. Circula-tion 1996; 94: 3318–26.
12 Yang Y, Graham JJ, Connelly K, Foltz WD, Dick AJ, Wright GA. MRI manifestations of persistent microvascular obstruction and acute left ventricular remodeling in an experimental reperfused myocardial infarction. Quant Imaging Med Surg 2012; 2: 12–20.
13 Mather AN, Fairbairn TA, Artis NJ, Greenwood JP, Plein S. Timing of cardiovascular MR imaging after acute myocardial infarction: effect on estimates of infarct characteristics and prediction of late ventricular remodeling. Radiology 2011; 261: 116–26.
14 Hearse DJ. Species variation in the coronary collateral circulation during regional myocardial ischaemia: a critical determinant of the rate of evolution and extent of myocardial infarction. Cardiovasc Res 2000; 45: 213–9.
15 Roth DM, Maruoka Y, Rogers J, White FC, Longhurst JC, Bloor CM. Develop ment of coronary collateral circulation in left circumflex ameroid-occluded swine myocardium. Am J Physiol 1987; 253: H1279–88.
16 Simonetti OP, Kim RJ, Fieno DS, Hillenbrand HB, Wu E, Bundy JM,
et al. An improved MR imaging technique for the visualization of
myocardial infarction. Radiology 2001; 218: 215–23.
17 Lund GK, Stork A, Saeed M, Bansmann MP, Gerken JH, Müller V, et al. Acute myocardial infarction: evaluation with irst-pass enhancement and delayed enhancement MR imaging compared with 201Tl SPECT imaging. Radiology 2004; 232: 49–57.
18 Gerber BL, Garot J, Bluemke DA, Wu KC, Lima JA. Accuracy of contrast-enhanced magnetic resonance imaging in predicting improve ment of regional myocardial function in patients after acute myo cardial infarction. Circulation 2002; 106: 1083–9.
19 Wilke N, Simm C, Zhang J, Ellermann J, Ya X, Merkle H, et al. Contrast-enhanced first pass myocardial perfusion imaging: correlation between myocardial blood low in dogs at rest and during hyperemia. Magn Reson Med 1993; 29: 485–97.
20 Su MY, Yang KC, Wu CC, Wu YW, Yu HY, Tseng RY, et al. First-pass myocardial perfusion cardiovascular magnetic resonance at 3 Tesla. J Cardiovasc Magn Reson 2007; 9: 633–44.
21 Wilke N, Jerosch-Herold M, Wang Y, Huang Y, Christensen BV, Stillman AE, et al. Myocardial perfusion reserve: assessment with multisection, quantitative, first-pass MR imaging. Radiology 1997; 204: 373–84.
22 Lee SS, Goo HW, Park SB, Lim CH, Gong G, Seo JB, et al. MR imaging of reperfused myocardial infarction: comparison of necrosis-speciic and intravascular contrast agents in a cat model. Radiology 2003; 226: 739–47
23 Wang Y, Sun W, Cao G, Meng L, Song L, Du X. Delayed hyper enhance-ment patterns in occlusive and reperfused myocardial infarcts during different healing stages. J Magn Reson Imaging 2006; 24: 851–7. 24 Görge G, Schmidt T, Ito BR, Pantely GA, Schaper W. Microvascular
and collateral adaptation in swine hearts following progressive coronary artery stenosis. Basic Res Cardiol 1989; 84: 524–35.
25 Bloor CM, Liebow AA. Coronary collateral circulation. Am J Cardiol 1965; 16: 238–52.
26 Wang J, Liu HY, Lv H, Xiang B, Gruwel M, Tomanek B, et al. Identification of chronic myocardial infarction with extracellular or intra vascular contrast agents in magnetic resonance imaging. Acta Pharma col Sin 2008; 29: 65–73.
27 Wang J, Xiang B, Lin HY, Liu H, Freed D, Arora RC, et al. Pathological
mechanism for delayed hyperenhancement of chronic scarred myo-cardium in contrast agent enhanced magnetic resonance imaging. PLoS One 2014; 9: e96463.
28 White FC, Carroll SM, Magnet A, Bloor CM. Coronary collateral development in swine after coronary artery occlusion. Circ Res 1992; 71: 1490–500.