HAL Id: hal-00668101
https://hal.archives-ouvertes.fr/hal-00668101
Submitted on 6 Jun 2015
HAL is a multi-disciplinary open access
archive for the deposit and dissemination of
sci-entific research documents, whether they are
pub-lished or not. The documents may come from
teaching and research institutions in France or
abroad, or from public or private research centers.
L’archive ouverte pluridisciplinaire HAL, est
destinée au dépôt et à la diffusion de documents
scientifiques de niveau recherche, publiés ou non,
émanant des établissements d’enseignement et de
recherche français ou étrangers, des laboratoires
publics ou privés.
transported to the Arctic: observations from the
POLARCAT-France spring campaign
Boris Quennehen, Alfons Schwarzenboeck, A. Matsuki, J. F. Burkhart, A.
Stohl, Gérard Ancellet, Kathy S. Law
To cite this version:
Boris Quennehen, Alfons Schwarzenboeck, A. Matsuki, J. F. Burkhart, A. Stohl, et al.. Anthropogenic
and forest fire pollution aerosol transported to the Arctic: observations from the POLARCAT-France
spring campaign. Atmospheric Chemistry and Physics, European Geosciences Union, 2012, 12 (14),
pp.6437-6454. �10.5194/acp-12-6437-2012�. �hal-00668101�
www.atmos-chem-phys.net/12/6437/2012/ doi:10.5194/acp-12-6437-2012
© Author(s) 2012. CC Attribution 3.0 License.
Chemistry
and Physics
Anthropogenic and forest fire pollution aerosol transported to the
Arctic: observations from the POLARCAT-France spring campaign
B. Quennehen1,4, A. Schwarzenboeck1, A. Matsuki2, J. F. Burkhart3, A. Stohl3, G. Ancellet4, and K. S. Law41Laboratoire de M´et´eorologie Physique, UMR6016, Universit´e Blaise Pascal, CNRS, Aubi`ere, France 2Frontier Science Organization, Kanazawa University, Japan
3Norwegian Institute for Air Reasearch (NILU), Kjeller, Norway
4UPMC Univ. Paris 06; Universit´e Versailles St-Quentin; CNRS/INSU, LATMOS-IPSL, UMR8190, Paris, France
Correspondence to: B. Quennehen (b.quennehen@opgc.univ-bpclermont.fr)
Received: 23 January 2012 – Published in Atmos. Chem. Phys. Discuss.: 8 February 2012 Revised: 26 June 2012 – Accepted: 26 June 2012 – Published: 24 July 2012
Abstract. During the POLARCAT-France airborne
measure-ment campaign in spring 2008, several pollution plumes transported from mid-latitude regions were encountered. The study presented here focuses on air masses from two ent geographic origins (Europe and Asia) and from 2 differ-ent source types (anthropogenic pollution and forest fires). A first case study is dedicated to a European air mass, which was repeatedly sampled and analysed during three consec-utive days. Thereby, the evolution of the aerosol properties (size distributions, CO mixing ratio) is characterised and re-lated processes are discussed. In particular, the role of coag-ulation, condensation and cloud processing in the evolution of the Aitken and the accumulation mode particles are con-trasted.
A second case study focuses on European air masses impacted solely by biomass burning emissions and Asian air masses with contributions from both biomass burning and anthropogenic emissions. The analysis of aerosol modes highlight a similar behaviour for particle originating from biomass burning (from Europe as well as Asia). In com-parison to the predominating aged accumulation mode in biomass burning particles, a still larger aerosol accumulation mode related to Asian anthropogenic emissions can be iso-lated. These findings corroborate the external mixing of such kind of aerosol size distributions. An electron microscopy study (coupled to X-ray elemental analysis) of particles il-lustrated soot-like inclusions in several samples. Within sam-ples attributed to forest fire sources, the chemical signature is highly associated with the presence of potassium, which is a characteristic tracer element for biomass burning plumes.
The single particle images suggest an internal mixing of sam-pled individual aerosol particles. Thus, particles are found externally mixed as demonstrated from particle size distribu-tions while they appear internally mixed at the particle scale.
1 Introduction
Since the polar regions are more sensitive to global change than others (IPCC, 2007), a better understanding of the po-lar climate system is fundamental. This is why an increasing number of studies in the Arctic are dedicated to the collec-tion of measurement data in order to improve our current un-derstanding on climate related processes in the Arctic atmo-sphere (Law and Stohl, 2007). While ground-based observa-tions have been regularly performed at a few existing mea-surement stations (e.g., Sharma et al., 2002, 2004, 2006 and Quinn et al., 2002, 2007), aircraft observations of the Arctic atmosphere remain rare.
Aerosol particles play an important role in the global cli-mate (IPCC, 2007) through their direct (McCormick and Ludwig, 1967) and indirect effects (Twomey, 1977; Al-brecht, 1989) on Earth’s radiative budget. These effects re-main poorly investigated in the Arctic regions and are dif-ficult to quantify, implying large uncertainties (Garrett and Zhao, 2006; Lubin and Vogelmann, 2006). Since few pollu-tion sources exist in the Arctic regions (e.g., the Kola penin-sula as shown by Frossard et al., 2011 and Merlaud et al., 2011), polluted air masses observed in the Arctic are mainly transported from mid-latitude regions, leading for example
to the build up of Arctic Haze, firstly observed by pilots fly-ing over Arctic regions (Greenaway, 1950; Mitchell, 1957), more recently the phenomenon has been discussed with re-spect to its spatial extent by Dreiling and Friederich (1997), and summarised by Quinn et al. (2007). Arctic Haze stud-ies were mainly conducted to investigate the chemical and optical properties of Arctic Haze aerosol particles (Schnell, 1984; Clarke et al., 1984; Brock et al., 1990). Arctic Haze is mainly composed of particulate organic matter and sulphate and, to a lower extent, black carbon (Quinn et al., 2002). Arctic Haze originates from biomass burning and/or anthro-pogenic sources from any continent in the Northern Hemi-sphere. Eurasia (including Europe, former USSR countries, Siberia and northern China) is considered to be the major source region for Arctic Haze, particularly observed during the winter and early spring seasons (Stohl, 2006; Sharma et al., 2004, 2006; Hirdman et al., 2010; Huang et al., 2010; Brock et al., 2011).
However, aerosol characteristics in the Arctic are differ-ent from over source regions. This is due to ageing and/or removal processes which occur during transport of the pollu-tion plume from its sources to the Arctic. The principal trans-formation processes are listed below:
– Coagulation: describes the process of a particle
collid-ing with another one, thus, formcollid-ing one larger particle. As a consequence coagulation is reducing the total par-ticle number concentration at a rate proportional to the square of particle concentration (Hinds, 1999). A broad particle size distribution can be rather effective in scav-enging the smallest particles.
– Condensation: this process corresponds to the growth of
particles by condensation of the gas phase on particles (Hinds, 1999). Main condensable gases are depending on the pollution sources.
– Cloud processing: a part of the aerosol population is
ac-tivated as cloud condensation nuclei and subsequently chemically transformed in the liquid phase (Seinfeld and Pandis, 1998).
– Dilution/mixing: by mixing surrounding air into a
highly concentrated pollution plume, aerosol number and mass concentrations are reduced.
In addition, during their lifecycle, aerosols are subject to var-ious removal processes:
– Dry deposition, which is most efficient for coarse mode
particles (Seinfeld and Pandis, 1998).
– Wet deposition, which affects mostly accumulation
mode particles. It corresponds to the in-cloud scav-enging (washout) and below-cloud scavscav-enging (rainout) (Seinfeld and Pandis, 1998).
Whereas transformation of anthropogenic pollution aerosol is strongly related to both condensation and coagu-lation processes (Riemer et al., 2004), the transformation of biomass burning aerosol particles ageing is predominantly explained by the coagulation process at least in the far field of the source region (Fiebig et al., 2003; Dentener et al., 2006; Petzold et al., 2007; M¨uller et al., 2007).
In this context, and within the frame of the 4th Interna-tional Polar Year (IPY, 2007–2008), the POLARCAT (POLar study using Aircraft, Remote sensing, surface measurements and models, of Climate, chemistry, Aerosols and Transport) project was launched. The objectives within POLARCAT are particularly focusing on improving our knowledge re-lated to long-range transport of short-lived pollutants (par-ticulates and gases) to the Arctic. The approach chosen for POLARCAT has been to combine aircraft (in situ and remote-sensing) measurements with extensive model studies. Within the French contribution to the POLARCAT project, the French ATR-42 research aircraft was deployed out of Kiruna, Sweden in April 2008 and out of Kangerlussuaq, Greenland in July 2008. It performed 24 scientific flights with state of the art instrumentation measuring physical and optical aerosol properties. While for the summer campaign, studies have been presented recently (Schmale et al., 2011; Quennehen et al., 2011), this work focuses on the spring aerosol measurements. Most recently, Adam de Villiers et al. (2010) and Merlaud et al. (2011) presented results from the spring measurements of aerosol optical properties and NO2 distributions, respectively.
The main objective of the study presented here is to in-vestigate the physical properties of pollution aerosol par-ticles transported to the Arctic demonstrating particularly aerosol ageing observed from measurement data during the campaign. In the following, after a short presentation of the measurement instrumentation, the paper focuses on two case studies, presented in separate sections three and four. The first case study is related to an European anthropogenic pol-luted air mass sampled during three consecutive days, in or-der to study transformation of aerosol particles within pollu-tion plumes transported to the Arctic. The transformapollu-tion is particularly seen in the Aitken mode. The second case study focuses on Eurasian polluted air masses, including Russian and Siberian forest fires, as well as an Asian anthropogenic plume.
2 Instrumentation on board the ATR-42 French
aircraft and analysis of air mass origins
2.1 Instrumentation
2.1.1 Aerosol physical properties
Since the POLARCAT spring campaign was dedicated to cloud studies, a CVI (Counterflow Virtual Impactor,
Schwarzenboeck et al., 2000) inlet was operated on the ATR-42. The CVI inlet is equipped with a backward facing inter-stitial inlet and can also be operated isokinetically for total aerosol sampling in clear sky conditions. For isokinetic sam-pling, the counterflow was switched off, and the controlled flow is increased to meet measured air speed in the shroud. Downstream the inlet, clear sky aerosol size distributions were measured by the combination of a Scanning Mobility Particle Sizer (SMPS, Villani et al., 2008) and an Optical Par-ticle Counter (OPC, Grimm model 1.108), both operated in-side the ATR-42 cabin. While the SMPS measured particle number size distributions in the range 20 < Dp<500 nm, where Dp is the particle diameter, the OPC sized particles with diameters in the range 300 < Dp<2000 nm. The num-ber concentrations derived from SMPS plus OPC are com-pared with total concentration from a Condensation Particle Counter (CPC 3010, TSI), which measured particles with di-ameter greater than 10 nm. In the overlap region, only SMPS measurements were considered. In general, the comparisons between OPC and SMPS concentrations in the overlap region reveals good agreement.
In addition, the aerosol particle volatility was measured with a second set of SMPS and OPC instruments heated up to 280◦C using a thermo-denuder located upstream the sec-ond set of SMPS and OPC. After the thermal csec-onditioning, refractory particles are supposed to be mainly composed of soot, sea salt, mineral dust and some refractory fraction of organic carbon. Ambient and 280◦C particle volume con-centrations were calculated and used in order to determine the aerosol volatile fraction:
Fvolatile=
Vambient−V280◦C Vambient
(1) Fvolatile represents the volume fraction of particulate mat-ter volatilised afmat-ter heating. The volatile volume fraction of solely accumulation mode particles Fvolatile,acis calculated in the following way:
Fvolatile,ac=
Vambient,ac−V280◦C,ac(ref) Vambient,ac
(2) Where Vambient,ac is the aerosol accumulation mode volume and V280◦C,ac(ref)is the volume of the refractory tion mode. Finally, the number fraction of solely accumula-tion mode volatile particles (Fconc,ac) is calculated accord-ingly:
Fconc,ac=
N280◦C,ac(ref) Nambient,ac
(3) with Nambient,ac and N280◦C,ac(ref) corresponding to the aerosol accumulation mode concentration at ambient tem-perature and at 280◦C, respectively. The measurement ef-ficiencies of both SMPS/OPC systems were inter-compared regularly during the campaign, usually before take-off and without thermo-desorption. Deviations between both sys-tems were found to be below the instrument uncertainties (Quennehen et al., 2011).
2.1.2 Aerosol chemical properties and trace gas
concentrations
The chemical composition of aerosol particles was investi-gated using aerosol samples collected by a two-stage im-pactor. The impactor type used in this study is identical to that described in Matsuki et al. (2005a,b). The 50 % cut-off aerodynamic diameters are 1.6 and 0.2 µm for the first and second stage, respectively, with a volume flow rate of ap-proximately 1.0 l min−1(1013 hPa, 293 K). Thus, in practice, supermicron particles are found in the first stage of the im-pactor while submicron particles impact during the second stage. The decision to start or stop sampling was made in situ by the on-board operator according to the circumstances (i.e., by taking into account the flight patterns and spatial extent of pollution plumes/cloud samplings during respective flights). The aim of the individual particle analysis within the spring campaign was to study both pollution aerosol particles from clear sky samples and residual particles from liquid/ice phase Arctic cloud samples. The frequency and duration of the indi-vidual samples taken during the flights were a function of the flight patterns and spatial extent of pollution plumes/cloud samplings during respective flights. More information about the sampling substrate of the impactor is given in Matsuki et al. (2010).
In situ samples were then analysed in the laboratory af-ter the flights. Submicron samples were imaged utilising a transmission electron microscope (TEM, JEM-2010FEF, JEOL) to obtain high resolution images. Furthermore, an Energy Dispersion X-ray spectrometer (EDX, JED-2300, JEOL) monitored X-ray spectra to obtain elemental composi-tion of individual particles. Supermicron particles were anal-ysed by a Scanning Electron Microscope (SEM, S-3000N, Hitachi) coupled to an other EDX (EMAX-500, Horiba). The relative atomic ratios (%) of the detected elements were quantified by the manufacturer’s software in standard-less mode. Due to the limitation of the method related to the quan-tification of lighter elements contained in a single particle, C, N, and O were excluded from the quantitative analysis. For each sample of the submicron particles, 30 randomly cho-sen particles were analysed while for supermicron samples, every single particle was analysed. The number of analysed supermicron particles ranged from 16 to more than 50, de-pending on the particle loading of individual filters.
Carbon monoxide (CO, also investigated by Adam de Vil-liers et al., 2010) was measured by the MOZART CO in-strument, based on the gas filtered correlation principle of infrared absorption by the 4.67 µm fundamental vibration-rotation band of CO (N´ed´elec et al., 2003). CO is a rather inert tracer over a timescale of 10–20 days and is emit-ted by combustion processes (both biomass burning and anthropogenic combustion). In this study, excess CO is used instead of total CO mixing ratio. Excess CO is ob-tained by subtracting the background value of 120 ppbv (Pommier et al., 2010) from the total CO mixing ratio.
Fig. 1. ATR-42 flight tracks highlighting the legs on which forest fire and anthropogenic plumes were sampled.
Additionally, NO2 measurements were performed using an Airbone Limb Scanning-Differential Optical Absorption Spectrometer (ALS-DOAS) as presented in Merlaud et al. (2011).
2.2 Air mass origins and ages
In order to derive the origins of air masses sampled during the POLARCAT-France spring campaign, the FLEXPART La-grangian particle dispersion model (version 6.2) (Stohl et al., 1998, 2005) was used in its backward mode (Stohl et al., 2003). The model was repeatedly initialised along the flight trajectories for aircraft position changes of more than 0.20◦ in horizontal dimension and/or 150 m in vertical dimension. For every single run, 40 000 particles were released from a small volume around the aircraft position and then were tracked during twenty days (backwards in time). The primary output of FLEXPART backward calculations is the poten-tial emission sensitivity (PES), column-integrated values of which were used here mainly to characterise the origin and transport pathways of the sampled air masses. Footprint po-tential emission sensitivities (FPES) correspond to the PES values of the lowest layer in the model output (0–100 m). Since pollutant emissions mostly occur at the Earth’s sur-face, FPES provide important information about the potential sources of pollution for the sampled air masses. In addition to PES and FPES, hot spots detected by the radiospectrometer MODIS (Giglio et al., 2003) are indicated in red and black illustrating forest fires and other fires (e.g., agricultural), re-spectively.
As mentioned above, each flight segment (aircraft posi-tion changes of more than 0.20◦ in horizontal dimension and/or 150 m in vertical dimension) along the aircraft trajec-tory is considered as a starting point by FLEXPART. For each flight segment 40 000 particles were released by the model and at each time step (up to 20 days) the position of every single particle is calculated. Thus, when a particle reaches the ground (or the lower vertical layer of the model for the biomass burning areas), the particle age is obtained. For the 40 000 particles per segment, an age spectrum ranging from one to twenty days is derived. The integration of this age spectrum leads to the estimation of a mean plume age called hereafter FLEXPART age.
2.3 Lagrangian matches with FLEXPART
Following the approach outlined in Methven et al. (2006) we used FLEXTRA trajectory code to identify flight peri-ods having a Lagrangian connection with prior flights. In ad-dition to the latitudinal and equivalent potential temperature screening employed in the previous work, we used informa-tion on air mass longitude, elevainforma-tion and CO concentrainforma-tions to define our match information. For further details regard-ing the trajectory model set up and tracers used, the reader is referred to the original Methven et al. (2006) manuscript for details of the method.
For this experiment FLEXTRA was run forward for all 51 POLARCAT Spring and Summer flights. This included all flights from the NASA ARCTAS (Fuelberg et al., 2010), DLR Falcon (Roiger et al., 2011) and French ATR research
Table 1. Criteria for the Lagrangian matches selection and identifi-cation.
Criteria Value Horizontal separation <100 km Minimum elevation 250 m Time separation <45 min Elevation separation <1 km Equivalent potential temperature <5◦C
1 2 1 2 3 1 2 3 4
Potential emission sensitivities
Footprint emission sensitivities
Flight 33 April 9th Flight 34 April 10th Flight 35 April 11th
Fig. 2. FLEXPART column-integrated potential emission sensitivi-ties (PES, top) and footprint emission sensitivisensitivi-ties (FPES, bottom) for the anthropogenic air mass sampled during the flights on 9, 10 and 11 April 2008. Numbers indicate the air mass age in days at the location pointed by corresponding black arrows. On FES maps, red squares indicate the aircraft location, used as a starting point to run FLEXPART.
campaigns. Lagrangian matchpoints were initially selected and identified based on criteria as shown in Table 1.
In all thousands of match points were identified due to re-peat trajectories for flight pairs. Furthermore, the method will generate a many-to-many relationship between flights due to the frequency of trajectories being released (10 s). Rather than choosing a “best match trajectories” approach that is representative of an ensemble of trajectories, CO information from the flights was used to identify the optimal trajectories of interest for analysis of biomass burning events. CO as a
Clouds
Anthropogenic Biomass burning
Fig. 3. Evolution of the aerosol size distribution along the flight on 9 April. While the principal y-axis (left) shows the diameter related to the colour-coded concentrations, the secondary y-axis (right) cor-responds to the flight altitude plotted in black. Sampling periods re-lated to anthropogenic and forest fire plumes are indicated with red and brown rectangles, respectively.
101 102 103 104 10−1 100 101 102 103 104 R2 = 0.991 R2 = 0.984 R2 = 0.976 R2 = 0.988 R2 = 0.992 R2 = 0.992 R2 = 0.983 Diameter (nm) Concentrations dN/dlogD (#.cm −3) 9 April meas. 9 April fit 10 April meas. 10 April fit 11 April meas. 11 April fit Background meas. Background fit
Fig. 4. Anthropogenic aerosol size distributions measured (thin solid line with circles) and fitted (thick solid line) for flights on April 9, 10 and 11 coloured in red, orange and yellow, respectively. A typical background size distribution encountered in non polluted air masses is shown in blue. Distributions are fitted with a 3 log-normal parameterisation, corresponding correlation factors are indicated.
tracer provides a good method for determining when the air-craft was sampling periods of intense biomass burning and it has a lifetime significantly longer than the period between flights.
Table 2. Parameterisation of log-normally fitted size distributions for the anthropogenic plume. FLEXPART determined air mass ages are also indicated.
Flight date Flexpart age Aitken mode Accumulation mode Coarse mode (days) n1(cm−3) σ1 dm1(nm) n2(cm−3) σ2 dm2(nm) n3(cm−3) σ3 dm3(nm) 9 April 4.7 621 1.35 33.1 621 1.80 108.8 0.018 1.30 2000 5.3 981 1.36 32.2 556 1.80 124.8 0.001 1.30 2000 10 April 6.7 132 1.29 38.2 595 1.80 118.5 0.046 1.30 2000 7.1 495 1.44 42.7 402 1.69 139.4 0.024 1.30 2000 11 April 7.6 139 1.36 48.4 407 1.79 116.5 0.102 1.32 1462 7.8 210 1.54 51.9 163 1.47 151.0 20.00 2.00 800 Background 84.8 1.80 61.2 157.7 1.62 165.6 0.303 1.30 941 3 4 5 6 7 8 9 10 20 25 30 35 40 45 50 55 60 65 70
FLEXPART age (days)
Aitken mode mean diameter (nm)
R2 = 0.91 y = 14.4 exp(t/6.3) Flight 33 (04/09) Flight 34 (04/10) Flight 35 (04/11) Exponential fit
Fig. 5a. Evolution of the Aitken mode mean diameter as a function of the FLEXPART age for the anthropogenic plume. Data points are colour-coded with respect to the flight dates. An exponential fit shown as a black line.
3 Case 1: anthropogenic plume sampled during three
consecutive days
During flights on 9, 10 and 11 of April 2008 (flight num-ber 33, 34 and 35, respectively), an anthropogenic air mass was sampled during three consecutive days by the ATR-42 French aircraft (see Fig. 1). It originated from areas in cen-tral Europe as seen on the FPES maps shown in Fig. 2 and was sampled at an altitude between 4 and 5 km. The anthro-pogenic origin of the plume is supported by the fact that no hot spot influence was detected by MODIS. In addition, La-grangian calculations using the FLEXTRA model show the strong plume coherence between the sampling periods.
3.1 Aerosol size distributions evolution
Figure 3 presents the evolution of the aerosol number size distribution the flight performed on 9 April. The two
mea-3 4 5 6 7 8 9 10 0 500 1000 1500 2000 2500
FLEXPART age (days)
SMPS Concentration (#.cm ï 3) R2 = 0.76 y = 5808 exp(ït/3.4) Flight 33 (04/09) Flight 34 (04/10) Flight 35 (04/11) Exponential fit
Fig. 5b. Evolution of the SMPS concentration (20–450 nm) as a function of the FLEXPART age for the anthropogenic plume. Data points are colour coded with respect to flight dates and an exponen-tial fit is shown as a black line.
surement periods corresponding to the anthropogenic plume are indicated with red rectangles. A strong Aitken mode ap-pears during the periods when the anthropogenic plume was encountered. For all three flights sampling this air mass, aerosol size distributions averaged over the sampling peri-ods are plotted in Fig. 4. In addition, a typical polar back-ground size distribution at this altitude (4000 m) is shown in blue. Parametrisations of size distributions calculated from log-normal fits with three size modes, are added in this fig-ure. The log-normal parameters, i.e., the number concen-trations Ni, the standard deviation σi and the mean diam-eter Dmi related to mode i (ranging from 1 to 3) are re-ported in Table 2. The constraints used for the lognormal fit of each mode are given in Table 3. The highly concen-trated Aitken mode (860 cm−3), centred around 33 nm mean diameter for the first sampling flight evolves to larger mean diameters (51 nm for the third flight). Notice that the time since emission of the sampled pollution plume increased by
Table 3. Constraints used in the log-normal parameterisations for aerosol modes.
Parameterisation Aitken mode Accumulation mode 1 Accumulation mode 2 Coarse mode European anth. 20 ≤ Dp<90 nm 90 ≤ Dp<500 nm – 500 ≤ Dp<2000 nm European fires 20 ≤ Dp<110 nm 110 ≤ Dp<700 nm – 700 ≤ Dp<2000 nm Asian mixed 20 ≤ Dp<90 nm 90 ≤ Dp<200 nm 200 ≤ Dp<700 nm 700 ≤ Dp<2000 nm 101 102 103 0 500 1000 1500 2000 2500 3000 Diameter (nm) Flight 33 meas. Flight 33 fit Flight 34 meas. Flight 34 fit Flight 35 meas. Flight 35 fit
Aerosol concentrations dN/dlogD (cm
-3) A 101 102 103 0 500 1000 1500 2000 2500 3000 Diameter (nm) Flight 33 meas. Flight 33 fit Flight 34 meas. Flight 34 fit Flight 35 meas. Flight 35 fit
Refractory aerosol concentrations dN/dlogD (cm
-3) B
Fig. 6. (A) Ambient and (B) 280◦C aerosol number size distributions for flights on 9, 10 and 11 April.
about three days between the first and the third flight (Ta-ble 2, Fig. 2). The evolution of the aerosol size distribution observed during the three subsequent flights, was simulated using a coagulation model. The results are presented more in detail in Sect. 3.3. Furthermore, the evolution of the Aitken mode mean diameter as a function of mean air mass age de-rived from FLEXPART source contributions as a function of time is parameterised with an exponential fit and shown in Fig. 5a. In the course of the three consecutive flights (9 to 11 April), the mean modal diameter of the Aitken mode in-creases exponentially. Because of the different processes af-fecting particle growth rates in very different ways during different stages of atmospheric transportation, the presented exponential parameterisation, however, becomes more and more uncertain when extrapolating the modal mean diam-eter (backward) close to the emission region. Between the 9 and 11 April, the accumulation mode mean diameter is shifted from 104 to 133 nm and the mean maximum accumu-lation mode concentration decreased from 920 to 515 cm−3 in dN/dlogD. The decrease of accumulation mode number concentration (Fig. 5b) with ageing is attributed to coagula-tion and also to cloud processing. To investigate the pres-ence of cloud on the pathway of the air mass on 10 and 11 April, the ECMWF (European Center for Meteorological Weather Forcast) cloud cover and total precipitation prod-uct and HYSPLIT on-line version of the Lagrangian back-trajectory model (Draxler and Rolph, 2010; Rolph, 2010)
were used. Figure 9 presents the vertical profiles of ECMWF cloud cover along the HYSPLIT calculated backtrajectory positions. Simulations were initialised for 10 and 11 April at 10:00 and 13:00 UTC in each case and show cloud process-ing after 9 April. Finally, the correspondprocess-ing ECMWF total precipitation product suggests that, despite potential cloud processing precipitation scavenging did not occur.
3.2 Refractory aerosol particles
Ambient and elevated (280◦C) temperature systems can give evidence on the state of mixture of aerosol particles, for ex-ample, to what extent accumulation mode aerosol particles have been coated. The ambient and heated aerosol num-ber size distributions are presented in Fig. 6a and b for flights on 9, 10 and 11 July. Between the first and third sampling day of the European anthropogenic air mass, am-bient (104 to 133 nm) and heated (43.4 to 58.9 nm) accu-mulation mode modal diameter increased by 29 %, whereas the corresponding refractory mode modal diameter (result-ing from desorbed ambient accumulation mode) increased by 33 %. Fconc,ac is rather constant during the 6 selected periods with a mean value of 1.14, indicating that the en-tire ambient accumulation mode can be found in the refrac-tory mode (hence, shifted to smaller sizes between 43 and 59 nm). This ratio is greater than one since refractory Aitken mode particles may partly appear in the mode of refractory
4.7 5.3 6.6 7.1 7.6 7.8 20 40 60 80 100 120 140
Flexpart age (days)
∆CO mixing ratio (ppbv)
y = 248 exp(−t/6.4) R2 = 0.53
Fig. 7a. Evolution of the enhanced carbon monoxide mixing ra-tios (ppbv) as a function of FLEXPART age for the anthropogenic plume samplings. An exponential fit is shown. For each boxplot, the central line is the median, edges of the box are 25th and 75th per-centiles and the dotted line extends to the 5th and 95th perper-centiles. The mean is indicated by black dots.
accumulation mode particles. This result highlights the inter-nal mixing of the aerosol accumulation mode of this anthro-pogenic air mass. Fvolatile,acis also rather constant during the first two flights and decreased during the last flight. Its mean value is 0.79, thus, indicating that 79 % of the accumulation mode volume was composed of volatile compounds. Unfor-tunately, the instrumentation mounted on the ATR-42 did not allow determining the chemical composition of the refrac-tory and volatile aerosol fractions. In addition, the evolution of the Aitken mode after desorption dropped below 20 nm and could not be measured with the NVSMPS system.
3.3 Air mass properties evolution
The evolution of physico-chemical properties of the air masses measured on the ATR-42 and related to the anthro-pogenic air mass from central Europe is presented in Fig. 7a and 7b. These box plots present the median values as well as 25th and 75th percentiles (box edges) and also the 5th and 95th percentiles (dotted line edges). The mean values are in-dicated with black dots.
First, Fig. 7a presents the evolution of the enhanced gas phase CO (1CO) mixing ratio in ppbv over the background value of 120 ppbv as a function of the FLEXPART age. 1CO decreases exponentially (fitted black line) with a time scale of τ = 6.4 days. An estimation of the 1CO concentration near the source region is around 248 ppbv. The rather low correlation coefficient (r2=0.41) suggests that the pollution plume was heterogeneous and that the aircraft may have sam-pled somewhat different parts of the plume during the three
4.6 5.3 6.5 7 7.6 7.8 0.5 0.55 0.6 0.65 0.7 0.75 0.8 0.85 0.9 0.95 1
FLEXPART age (days)
Volatile volume fraction 25th - 75th percentile median
mean
Fig. 7b. Presentation of aerosol Fvolatileas a function of the
FLEX-PART derived age of air masses. The mean volatile volume fraction for the 6 flight segments is plotted in black.
flight missions. The overall decrease of excess CO with time is likely due to dilution of the plume.
Finally, Fig. 7b shows Fvolatile of the aerosol population as function of the FLEXPART age. This parameter is re-lated to the condensed (rather volatile) material, i.e., coat-ing of aerosol particles. Fvolatile is constant during the first four periods with a mean value of 0.81 ± 0.09, but decreases over the last two periods. This implies that the relative chem-ical composition of the particles within the air mass did not change considerably between the first and the second flight. The Fvolatile values derived in this study are very similar to what has been published for long-term observations made by H¨akkinen et al. (2012). H¨akkinen et al. (2012) present re-sults from long-term measurements of non-volatile aerosol fractions at the ground-based station of Hyyti¨al¨a, Finland. Their results support our findings, since H¨akkinen et al. (2012) found that during spring season, the main source of aerosol was anthropogenic with a volatile aerosol fraction of 0.17. Both H¨akkinen et al. (2012) and this study found higher aerosol volatile fractions than Birmili et al. (2010) who published a Fvolatilevalue of 0.69 for urban background air masses. Their high Fvolatilevalue is explained by the im-portant amount of volatile compounds released by anthro-pogenic pollution. Accordingly, we may conclude that such volatile compounds may have condensed on particles during transport to the Arctic.
3.4 Modelling of the coagulation process
The coagulation process appears to have been an efficient process governing the ageing of the European anthropogenic air mass. To confirm this statement, a modelling study of the coagulation process was performed with a time step of
Table 4. Comparison between log-normally fitted observed and simulated aerosol number size distribution parameters.
Flight date Aitken mode Accumulation mode
n1(cm−3) σ1 dm1(nm) n2(cm−3) σ2 dm2(nm) 10 April Obs. 313 1.36 40.4 493 1.75 128.9 Sim. 237 1.30 38.8 321 1.70 115.0 11 April Obs. 174 1.45 50.1 285 1.63 134,0 Sim. 166 1.30 41.1 263 1.65 118.1 101 102 103 0 500 1000 1500 2000 2500 3000 Diameter (nm) Concentration dN/dlogD (cm −3) Observations 9 April Observations 10 April Observations 11 April Model distribution t = 0h Model distribution t = 45h Model distribution t = 65h
Fig. 8. Aerosol number size distributions observed (coloured lines) and simulated with a coagulation model (grey level lines) for flights on 9, 10 and 11 April. t = 0 corresponds to the mean FLEXPART age for the measurements of the plume on 9 April. See text for de-tails.
100 seconds, starting from the mean aerosol size distribu-tion on 9 April and using a semi implicit coaguladistribu-tion model, based on particulate matter volume conservation, as pre-sented in Jacobson (2005). Figure 8 shows the modelled dis-tributions after coagulation superimposed on the measured distributions. The Aitken and accumulation mode parame-ters related to the observed and simulated distributions are presented in Table 4. Comparing the measurements on 9 to 11 April, the observed Aitken mode modal mean diame-ter shifted from 32.6 to 50.1 nm, while the simulated modal mean diameter shifted from 32.6 to 41.1 nm. Thus, the sim-ulation can explain about half of the modal mean diameter evolution. Condensation processes are probably responsible for the other half of the growth. Since, coagulation is the only process which impacts particle concentrations, evolution of the simulated Aitken mode modal concentrations are in good agreement, 237 cm−3(on the second day) and 167 cm−3on the third day) are close to the measured concentrations of 313 and 174 cm−3for 10 and 11 April, respectively.
However, the modelling of the accumulation mode particle evolution due to coagulation is less correlated with the
obser-vations. Whereas the simulated modal mean diameter shifted from 116.8 to 118.1 nm, the observed modal mean diameter shifted from 116.8 to 134 nm. Thus, the coagulation explains only 10 % of the modal mean diameter evolution. As demon-strated for the Aitken mode, the accumulation mode modal concentration is matches well the observed (285 cm−3) and simulated (263 cm−3) concentrations on 11 April.
Hence, both the Aitken as well as the accumulation mode modal diameter evolution cannot be explained solely by co-agulation. Thus, the processes of condensation and ageing of particulate matter helps to explain the entire modal di-ameter evolutions. To support the hypothesis, Merlaud et al. (2011) found enhanced gaseous NO2concentration measure-ments in the plume sampled on 9 April. NO2, through oxida-tion reacoxida-tions in the atmosphere, can form N2O5and NO3 compounds which are able to interact with aerosol particles (Mentel et al., 1996; Hallquist et al., 2000; Benton et al., 2010). However, it is difficult to evaluate the impact of con-densation processes since they cannot be simulated without a complete suite of measurements of potential condensable gases. In addition, condensation is, of course, occurring from 9 (and probably before) to 11 April and should impact the modal mean diameter evolutions during all three days of the study. The following relationship links particle diameter to the shift of the diameter due to condensation processes:
dDp
dt =
4DiMi RT Dpρp
f (Kn, α)(pi−peq) (4)
with Di and Mi are diffusion coefficient and molecular weight of the gas i, R is the ideal gas constant, T the medium temperature, ρpthe particle density, f (Kn, α) is a correction factor related to discontinuity effects and finally, pi is the partial pressure of the corresponding species while peqis the total gas pressure at the equilibrium. According to Eq. (4), the Aitken mode particle diameter growth rate should have been more impacted by condensation processes than the ac-cumulation mode particle diameter growth rate. However, cloud processing (as seen in Fig. 9) occurring upstream the sampling after 9 April most likely impacted the accumulation mode.
5 6 7 8 9 10 100 200 300 400 500 600 700 800 900 1000 Time (days)
Pressure levels (hPa)
Cloud cover back−trajectory 5 6 7 8 9 10 100 200 300 400 500 600 700 800 900 1000 Time (days)
Pressure levels (hPa)
Cloud cover back−trajectory 6 7 8 9 10 11 100 200 300 400 500 600 700 800 900 1000 Time (days)
Pressure levels (hPa)
Cloud cover back−trajectory
ECMWF cloud cover
0 0.1 0.2 0.3 0.4 0.5 0.6 0.7 0.8 0.9 1 6 7 8 9 10 11 100 200 300 400 500 600 700 800 900 1000 Time (days)
Pressure levels (hPa)
Cloud cover back−trajectory
starting date: 10 april 10h starting date: 10 april 13h
starting date: 11 april 10h starting date: 11 april 13h
Fig. 9. ECMWF cloud cover along the HYSPLIT back-trajectories corresponding to the European anthropogenic air mass.
4 Case 2: Eurasian polluted plumes
During flights on 8 (AM and PM), 9, 10 and 11 April, several pollution plumes were sampled by the ATR-42, such as from biomass fires in eastern Europe (north of the Black Sea) and forest fires in Siberia (see Fig. 10). Moreover, air masses with eastern Asia anthropogenic pollution particles were sampled. The Asian plume anthropogenic and biomass burning ori-gins, discussed in Adam de Villiers et al. (2010) are inves-tigated in the subsequent section. Compared to the Euro-pean anthropogenic plume discussed in the previous section, plumes presented in the following section are referred to as Eurasian pollution plumes.
4.1 Aerosol size distributions
During the POLARCAT-France spring campaign, 6 peri-ods related to Eurasian pollution transported to the Arctic were identified using FLEXPART PES: Four plumes corre-sponding to Russian fires, located at the north of the Black Sea, subsequently denoted Russian fires (RF) and transported over Europe to the sampling location and two plumes cor-responding to air masses containing a mixture of Siberian fires and eastern Asia anthropogenic emissions, called here-after Asian fires (AF) and Asian anthropogenic (AA), respec-tively. Asian plumes denoted (AF) and (AR) were both
trans-Russian fires
Potential emission sensitivities
Asian fires
8 April 11 April
Fig. 10. FLEXPART column-integrated potential emission sensitiv-ities for Russian (left) and Asian (right) forest fire plumes. Black and red dots represent agricultural and forest fires, respectively.
ported over the North Pole to the sampling location and were clearly visible in aerosol Lidar measurements, as presented in Adam de Villiers et al. (2010). Examples of PES corre-sponding to Russian and Siberian fire origins are presented
101 102 103 104 10−1 100 101 102 103 104 R2 = 0.988 R2 = 0.993 R2 = 0.995 R2 = 0.996 R2 = 0.982 R2 = 0.992 R2 = 0.977 R2 = 0.976 Diameter (nm) Concentrations dN/dlogD (#.cm −3)
Russian fires meas. Russian fires fit Asian anth. meas. Asian anth. fit Asian fires meas. Asian fires fit Background meas. Background fit European anth.
Fig. 11. Measured (thin solid line with circles) and fitted (thick solid line) aerosol number size distributions corresponding to Russian and Asian plumes transported to the Arctic. Distributions are fitted with three mode, corresponding correlation factors are indicated. Red and green distributions represent Russian and Asian forest fires, respectively; yellow distributions represent the Asian anthropogenic plume. For comparison reason, a polar background distribution is shown in blue and in addition, a distribution related to the European anthropogenic plume sampled on 9 April (discussed in the first case study).
in Fig. 10. Mean aerosol size distributions and log-normally fitted distributions for the pollution plumes originated from Russian fires, Asian fires and Asian anthropogenic emissions are shown in Fig. 11. Size distributions related to Russian and Asian fire plumes are plotted in red and green, respec-tively, while that related to the anthropogenic air masses is plotted in yellow. In order to illustrate the enhancement in particle concentrations over usual Arctic background con-centrations, a background aerosol size distribution (selection supported from PES and FPES analysis, indicating local ori-gins) is added in blue on Fig. 11. Parameters related to the log-normal parameterisations (three or four modes) of the aerosol size distributions are presented in Table 5.
Concerning the observed Eurasian pollution plume, aerosol size distributions are characterised by the highly con-centrated accumulation mode and very low Aitken mode par-ticle concentrations as seen in Fig. 11. The FLEXPART ages are reported in Table 5. While the Aitken mode was the main contributor to the total particle concentration of the European anthropogenic plume (Sect. 3), Russian fires and Asian pol-luted plumes were mostly characterised by large accumula-tion mode particles. According to these findings, Eurasian pollution plume air masses, especially from anthropogenic origins were expected to be older than the anthropogenic Eu-ropean ones. The air mass ages calculated from FLEXPART for the Eurasian plumes are similar to ages of the European
anthropogenic plumes discussed in the previous section (5.3– 7.4 days).
With respect to the log-normal parameterisations (see Ta-ble 5), for Asian air masses, two modes have been necessary in the diameter range usually associated to the accumulation mode (100–300 nm). The first mode with a modal mean di-ameter of 150 nm is related to forest fires while the second mode, centred on 250 nm, might be linked to anthropogenic emissions. These assumptions are based on Adam de Vil-liers et al. (2010) who discussed these two air masses (AF) and (AA) in their study. Both air masses were composed of a mixing between biomass burning and anthropogenic contri-butions. In their study, Adam de Villiers et al. (2010) found evidence on the different intensity of the anthropogenic con-tribution in these two air masses. This intensity of the an-thropogenic contribution can be seen in the fitted concentra-tions of the second accumulation mode (149 and 35 cm−3), as shown in Fig. 12b and c. When comparing these air masses to the European air masses, air mass ages (roughly five days) are rather similar. However, aerosol size distribu-tions are completely different for European (first case study) and Asian (second case study) air mass origins. Whereas the European Aitken and accumulation mode maxima are of the order of 2400 and 920 cm−3 in dN/dlogD plots, with cor-responding mode diameters of 33.1 and 116.8 nm, respec-tively, the maxima are on the order of 240 and 860 cm−3in dN/dlogD, with mode diameters of 74.5 and 200.1 nm for the Asian plumes (Asian accumulation mode concentrations cor-respond to the sum of both modelled modes).
The mean size of particle modes observed can be related to the mean size of particles at the emission site (depending on the source type) and the processing of particle during trans-portation (depending on the initial particle size distribution, the amount of aerosol precursors and the time available). In this case study, the information about the aerosol properties in the source region is insufficient. Thus, the differences in the Aitken mode concentration may be explained by (i) Asian particles emitted with larger diameters and a small amount of Aitken mode particles (which may, in addition, involve a large condensational sink and exclude secondary nucleation) or (ii) nucleation events occurring in European air masses during transport. Both hypotheses are difficult to prove, pri-marily due to the lack of information on particle emissions at the source. However, the following section presents the anal-ysis of ambient and refractory aerosol size distributions and, thus, the aerosol volatile volume fraction in order to shed light on the source contributions to the size distributions.
4.2 Refractory aerosol particles
The volatility behaviour (particle number and volume) of aerosol particles from Russian and Asian fires as well as from Asian anthropogenic sources is derived from ambient and heated number size distributions. Concentrations and mean modal diameters for ambient and heated distributions are
Table 5. Parameterisation of log-normally fitted size distributions for forest fire plumes. FLEXPART determined air mass ages are also indicated.
Air mass type Flexpart age Aitken mode Accumulation mode 1 Accumulation mode 2 Coarse mode (days) n1(cm−3) σ 1 dm1(nm) n2(cm−3) σ2 dm2(nm) n3(cm−3) σ3 dm3(nm) n4(cm−3) σ4 dm4(nm) Russian fires 5.3 25.6 1.43 26.5 488 1.62 125.5 – – – 2.2 1.57 700 5.5 8.4 1.4 27.7 515 1.61 131.2 – – – 1.81 1.53 700 6.8 7.9 1.26 26.0 565 1.61 143.5 – – – 1.75 1.57 700 7.4 332 1.60 101.6 183 1.50 183.2 – – – 1.39 1.45 700 Asian anth. 5 7.8 1.20 32.5 433 1.67 145.4 149 1.37 253.3 0.88 1.30 852 Asian fires 6.6 3.9 1.45 39.9 380 1.67 150.2 36 1.30 249.9 0.34 1.52 1271 Background 84.8 1.80 61.2 157 1.62 165.6 – – – 0.303 1.30 941
Table 6. Parameterisation of log-normally fitted refractory size distributions for forest fire plumes.
Air mass type refractory mode 1 refractory mode 2 refractory mode 3
n1(cm−3) σ1 dm1(nm) n2(cm−3) σ2 dm2(nm) n3(cm−3) σ3 dm3(nm) Russian fires 85 1.80 27.9 406 1.57 74.2 11 1.68 298.3 27 1.31 24.5 494 1.54 71.9 35 1.90 168.7 53 1.59 25.4 513 1.53 77.6 79 1.89 130.0 174 1.80 24.8 372 1.57 73.5 23 1.88 191.1 Asian anth. 86 1.76 26.6 353 1.49 75.3 160 1.48 150.1 Asian fires 58 1.48 27.1 393 1.63 77.8 18 1.90 203.1
given in Tables 5 and 6, respectively. Figure 12a presents the mean ambient and desorbed size distribution for Russian fires. As described in the previous section, ambient particle size distributions are dominated by the highly concentrated accumulation mode. The mean refractory (or desorbed) size distribution shows a similar shape with a highly desorbed for-mer accumulation mode preserving particle concentrations, as seen in the calculated Fconc,ac mean value of 0.96 for the related periods. The mean value of 0.79 for the derived accu-mulation mode volatile volume fraction Fvolatile,achighlights the high volatility of the accumulation mode of the Russian fire plume particles. This is also illustrated by the important shift in the modal mean diameter from 127.0 to 74.2 nm. A second, but rather refractory mode is found with a very low concentration at a modal diameter of 27 nm.
The Asian air masses (fires and mixed emissions) were also characterised by highly concentrated particles in the ac-cumulation mode (Fig. 12b and c). As mentioned in Sect. 4, the accumulation mode is composed of two contributions described by two separate modes (anthropogenic and for-est fires, Adam de Villiers et al., 2010) corresponding to mean diameters of roughly 150 and 240 nm, respectively. For the Asian fires, the accumulation mode (at ambient tempera-ture) desorbed to an almost mono-modal size distribution (at 280◦C) with a mean diameter of 78 nm. This means that the properties of aerosol particle size distributions from Asian fires and Russian fires are very similar.
However, for the Asian anthropogenically influenced air masses, aerosol size distributions can be separated in two
modes. A first mode which behaves very similarly to the dominant mode of the Asian fire air masses and a second mode which desorbed to a distinct refractory mode with a higher modal mean diameter, as compared to the dominant mode of the Asian fires. Regarding the modal diameters and concentrations of the two modes and what we learned from size distributions related to fires, the first mode then is as-sociated to Asian fire emissions, while the second mode is attributed to a contribution from Asian anthropogenic emis-sions. A similar behaviour of an anthropogenic air mass was already presented by Pratt and Prather (2009) who observed aged urban particles, mostly composed of organic material, at ambient temperature and 230◦C and found modal mean diameters of 242 and 177 nm, respectively.
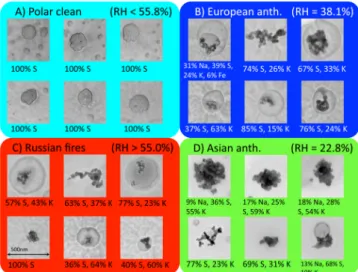
5 In situ samples
During the five last flights of the campaign, seven aerosol in situ samples were collected in clear sky conditions. Table 7 summarises information about the samples including the ori-gin of the sampled air masses, flight dates, start and end time of sampling, and the corresponding relative humidity (RH). Figure 13 presents typical images of submicron aerosol par-ticles sampled in different air masses. Clean polar air mass images clearly show satellite-like particles with a large drop surrounded by smaller droplets, as seen in Fig. 13a, which are typically a signature of acidic sulphate. The supposed acidity and absence of soot both indicates that the particles were not
101 102 103 0 200 400 600 800 1000 1200 1400 Diameter (nm) Concentrations dN/dlogD (cm -3)
Russian fires meas.
Russian fires fit Russian fires 280°C meas.Russian fires 280°C fit
A 101 0 200 400 600 800 1000 1200 102 103
Asian fires meas.
Asian fires fit Asian fires meas. at 280°CAsian fires fit at 280°C
B Concentrations dN/dlogD (cm -3) Diameter (nm) 101 102 103 0 200 400 600 800 1000 1200
Asian anth. meas.
Asian anth. fit Asian anth. meas. at 280°CAsian anth. fit at 280°C
C Concentrations dN/dlogD (cm -3) Diameter (nm)
Fig. 12. Ambient and 280◦C aerosol number size distributions for (a) Russian fires air masses and (b) Asian fire and (c) Asian anthro-pogenic air masses.
in close contact with the continental air masses. No obvious differences can be found between Russian fire and European anthropogenic particles, as shown in Fig. 13b and c where many particles left liquid like stain and soot like inclusions. RH may have had influence on the formation of the coat-ing layer because those in Fig. 13d seem to have more solid,
Fig. 13. Representative images of submicron aerosol particles sam-pled in situ during POLARCAT flights. Particle origins are: polar clean air (A), European anthropogenic (B), Russian fires (C) and Asian anthropogenic (D). Width of images corresponds to 500 nm. Elemental compositions of particles, determined by EDX, are indi-cated in term of atomic ratio (C, N, O are excluded). See text for details.
crystalline like structure. Figure 13d images are for RH of 23 % while Fig. 13b and c images are for RH > 40 %. Oth-erwise, the elements comprising the forest fire and anthro-pogenic particles were rather common.
The detection frequencies (DF) and atomic ratio (AR) of several elements found in analysed submicron aerosol sam-ples are presented in Fig. 14a. Sulphur (S) is a major com-pound of sulphuric acid and sulphate and it is not surprising to find it with a 100 % DF. However, sulphur is more con-centrated in anthropogenic particles with an AR about 80 %. Potassium (K) is considered as a biomass burning tracer (An-dreae, 1983), but can be measured, to a lower extent, in fos-sil fuel emissions, too (Guazzotti et al., 2003). As shown in Fig. 14a, almost all particles from fire origins contain K while the DF of K decreases to 60 % for anthropogenic particles and 20 % for clean polar air. This trend in DF is similar in the AR (Fig. 14b). DF of soot-like inclusions depends on air mass origins, but cannot be clearly related to fire or anthro-pogenic origins. Analyses of supermicron samples mainly pointed out the predominence of alumino-silicate mineral dust particles, and to a lesser extent by sea salt. Unlike sub-micron particles, no clear-cut correlation regarding the air mass origins were found. Thus, the dust influence found by Adam de Villiers et al. (2010) in the Asian air masses can not be confirmed by the supermicron samples analysis.
6 Summary and discussion
This study focuses on the characterisation of pollution plumes transported to the Scandinavian Arctic during spring
Table 7. TEM-EDX (submicron) and SEM-EDX (supermicron) samples of individual particles analysed for this study.
Air mass type date start time end time submicronic RH (HH:MM UTC) (HH:MM UTC) analysis (%) European anth. 9 April 09:39 09:47 analysed 38.1
Russian fires
8 April 08:48 09:04 analysed 99.0 8 April 13:52 13:59 analysed 82.6 9 April 12:04 12:17 analysed 55.0 Asian anth. 11 April 10:42 10:52 analysed 22.7 Polar clear air 8 April 9:33 09:37 analysed 26.3 11 April 12:16 12:27 analysed 55.8
Fig. 14a. Detection frequency of the major elements (EDX) and soot (visual identification) among individual submicron aerosol par-ticles.
of the year 2008. Two studies of transported air masses are presented here. Therein, the first case study investigates an European anthropogenic plume sampled during three con-secutive flights, as seen by a Lagrangian study. Aerosol size distributions related to this plume illustrate particularly well the ageing of observed Aitken mode where concentration is decreasing (from 860 to 165 cm−3 in dN/dlogD) and mean Aitken mode diameter is increasing (from 33 to 51 nm) with plume age increasing from 5.0 ± 0.2 to 7.7 ± 0.1 days. Half of the Aitken mode evolution could be reproduced using a semi-implicit coagulation model, suggesting that other pro-cesses (cloud processing and condensation) are equally in-volved in the evolution of the Aitken mode (and also accu-mulation mode) particle diameters. In addition, the simulated Aitken mode modal concentrations were similar to the obser-vations. Whereas the simulated accumulation mode concen-tration was in certainly limited agreement with the observa-tions (recall that the pollution plume was heterogeneous and the aircraft may have sampled somewhat different parts of the more or less diluted/mixed plume during the three flight missions), the accumulation mode modal mean diameter evo-lution was less well reproduced by the coagulation model:
Fig. 14b. Atomic ratio of the major elements (EDX) among indi-vidual submicron aerosol particles.
only 10 % of the modal diameter evolution can be related to the coagulation process. As a consequence, cloud process-ing of aerosol particles is suggested as the main process for accumulation mode modal mean diameter growth.
Related parameters like mean diameter of the Aitken mode, and 1CO mixing ratio exponentially decreased with ageing of the plume. Again, we have to state that varia-tions with respect to the exponential fit are due to the plume heterogeneity. According to these exponential parameteri-sations, extrapolations of trends suggest that Aitken mode particles were emitted with an estimated 1CO mixing ratio of 248 ppbv. These values are in agreement with measure-ments performed over urban areas (McMeeking et al., 2010). This finding is also supported by the refractory distributions demonstrating that the Aitken mode particles were desorbed to sizes below the instrument lower detection limit of 20 nm. The modal mean diameter of the refractory mode desorbed from the accumulation mode is increasing with time. This evolution is probably due to the ageing of organic materi-als. This growth in refractory core may compensate the gas
phase condensation on particles and explain why the volatile volume fraction is constant.
The second case study focuses on air masses originat-ing from Russia (north of Black Sea) and Asia (transported across the North Pole). Russian air masses were mostly in-fluenced by large forest fires and present almost mono-modal aerosol number size distributions, on average, centred around 127 nm in the accumulation mode size range. This mode desorbed into a mode centred at 74 nm which means that aerosols in the russian fire plumes were internally mixed. Aerosols in Asian air masses had a more complex behaviour since their accumulation modes were found externally mixed and composed of two contributions (Adam de Villiers et al., 2010) from biomass burning and anthropogenic emissions with modal mean diameter at 150 and 240 nm, respectively. These two contributions desorbed in two separate modes cen-tred at 75 and 150 nm, thus, corresponding to biomass burn-ing and anthropogenic contributions, respectively. The modal concentrations were consistent in both ambient and refrac-tory modes.
In order to compare the observation of this study with earlier studies, Fig. 15 presents modal mean diameters of aerosol size distributions as compared to their geo-metric standard deviation. Observations from earlier stud-ies (Reid and Hobbs, 1998; Reid et al., 1998, 2005; Pet-zold et al., 2007) are indicated with black symbols while POLARCAT-spring observations are indicated with coloured dots. Whereas fire plumes are following similar linear regres-sion trends as already observed in previous studies by Den-tener et al. (2006) and Janh¨all et al. (2010), the linear regres-sion related to the anthropogenic plume is different. How-ever, the deviation to the linear regression for anthropogenic plumes might be caused by only one data point. Therefore, the proposed regression should be considered with caution.
Finally, in situ submicron and supermicron aerosol par-ticles samples were collected during the flights. Clear dif-ferences were found for plumes with different origins es-pecially with respect to the potassium detection frequency and atomic ratio, which is highest in fire samples, then de-creases for anthropogenic samples, and is lowest for clean air polar air masses. Sulfate was found in each particle sample. The observation of soot-like inclusions support that soot can be transported over larger time periods than ex-pected (> 5 days), as claimed by Bourgeois and Bey (2011). In addition, particle images confirm differences between clean and polluted air mass origins of aerosol particles. Indi-vidual particles analysis show an internal mixing. Thus, the Asian air masses can be considered as an external mixing of two internally mixed contributions.
7 Conclusions
This study focuses on the characterisation of aerosol parti-cles in pollution plumes transported to the Arctic. Two case
1.2 1.3 1.4 1.5 1.6 1.7 1.8 1.9 2 0.05 0.1 0.15 0.2 0.25 0.3
Geometric standard deviation
Median diameter (µm)
Dentener et al. (2006) LR Janhäll et al. (2010) LR Petzold et al. (2007) Reid et al. (2005) Reid & Hobbs (1995) Reid et al. (1998) Euro. fire LR Euro. anth. LR European fires Asian fires European anth.
Fig. 15. Modal mean diameters for the accumulation mode of for-est fire aerosol size distributions as a function of their geometric standard deviations. Values for the European anthropogenic plumes are indicated for comparison. Linear regression (LR) from earlier studies and for fires and anthropogenic plumes are also shown.
studies are presented. The first case study focuses on a Euro-pean anthropogenic air mass sampled during three consec-utive days. Between the samplings performed on the first day (9 April) and the subsequent two days (10 and 11 April) aerosol size distributions experienced cloud processing. The study conclude that cloud processing accounts for the most important contribution to modify the accumulation mode modal diameter, whereas the coagulation process only ac-counts for less than 10 % of the modal mean diameter growth. In contrast, the Aitken mode modal mean diameter evolu-tion can be explained to 50 % with a pure coagulaevolu-tion model. Since the volatile volume fraction is rather similar along the three days, condensation of volatile compounds on particles equally contributed to particle growth. However, it is diffi-cult to conclude more quantitatively on the impact of dif-ferent processes on the aerosol size distribution evolution since more information is needed, especially about the prop-erties and concentrations of particulate matter and condens-able vapours at the source region. The data presented here can be used for an extended modelling study of the transport of air masses from the source region to the sampling area.
The second case study focuses on European and Asian biomass burning air masses. All observed forest fire air masses show similar characteristics with respect to the aerosol particle size distributions. In particular, the mono-modal ambient aerosol distributions which desorbed to mono-modal refractory size distributions with modal mean diameters of 135 and 75 nm, respectively. Finally, biomass burning influenced Asian air mass were compared with an air mass influenced by both anthropogenic and biomass burn-ing sources. This comparison clearly concludes about the
external mixing of the two contributions both observed in the accumulation mode of the aerosol size distributions. The above external mixing is still visible in the refractory size dis-tributions. The analysis of individual sub-micrometer parti-cles from collected in situ samples demonstrates that individ-ual pollution particles were mostly internally mixed (conden-sation processes during transport). Thus, the resulting aerosol particles of the Asian air mass (biomass burning plus an-thropogenic contributions) are individually internally mixed, whereas the overall air mass is considered to be externally mixed. Soot-like inclusions highlight the presence of soot in the Eurasian air masses, even after more than 5 days of trans-port.
Acknowledgements. The authors would like to thank the French
research agencies ANR, CNES, CNRS-INSU, and IPEV as well as EUFAR. Funding support from the French projects ANR Blanc SIMI 5-6 021 01 Climate Impact of Short-lived Pollutants and Methane in the Arctic (CLIMSLIP) and CLIMSIP-LEFE (CNRS-INSU) is acknowledge. NILU researchers were supported by the Norwegian Research Council in the framework of POLARCAT-Norway and CLIMSLIP. We also would like to thank SAFIRE and Christophe Gourbeyre for their support during the planning and execution of the French ATR-42 campaigns and, together with DT-INSU, for help with instrument integration.
Edited by: P. Quinn
The publication of this article is financed by CNRS-INSU.
References
Adam de Villiers, R., Ancellet, G., Pelon, J., Quennehen, B., Schwarzenboeck, A., Gayet, J.-F., and Law, K. S.: Airborne mea-surements of aerosol optical properties related to early spring transport of mid-latitude sources into the Arctic, Atmos. Chem. Phys., 10, 5011–5030, doi:10.5194/acp-10-5011-2010, 2010. Albrecht, B. A.: Aerosols, Cloud Microphysics, and Fractional
Cloudiness, Science, 245, 1227–1230, 1989.
Andreae, M. O.: Soot carbon and excess fine potassium: Long-range transport of combustion-derived aerosols, Science, 220, 1148– 1151, 1983.
Benton, A. K., Langridge, J. M., Ball, S. M., Bloss, W. J., Dall’Osto, M., Nemitz, E., Harrison, R. M., and Jones, R. L.: Night-time chemistry above London: measurements of NO3and
N2O5from the BT tower, Atmos. Chem. Phys., 10, 9781–9795,
doi:10.5194/acp-10-9781-2010, 2010.
Birmili, W., Heinke, K., Pitz, M., Matschullat, J., Wiedensohler, A., Cyrys, J., Wichmann, H.-E., and Peters, A.: Particle
num-ber size distributions in urban air before and after volatilisation, Atmos. Chem. Phys., 10, 4643–4660, doi:10.5194/acp-10-4643-2010, 2010.
Bourgeois, Q. and Bey, I.: Pollution transport efficiency toward the Arctic: Sensitivity to aerosol scavenging and source regions, J. Geophys. Res., 116, D08213, doi:10.1029/2010JD015096, 2011. Brock, C., Radke, L., and Hobbs, P.: Sulfur in particles in Arctic hazes derived from airborne in situ and lidar measurements, J. Geophys. Res., 95, 22369–22387, 1990.
Brock, C. A., Cozic, J., Bahreini, R., Froyd, K. D., Middlebrook, A. M., McComiskey, A., Brioude, J., Cooper, O. R., Stohl, A., Aikin, K. C., De Gouw, J. A., Fahey, D., Ferrare, R., Gao, R. S., Gore, W., Holloway, J. S., H¨ubler, G., Jefferson, A., Lack, D. A., Lance, S., Moore, R. H., Murphy, D. M., Nenes, A., Novelli, P. C., Nowak, J. B., Ogren, J. A., Peischl, J., Pierce, R. B., Pilewskie, P., Quinn, P. K., Ryerson, T. B., Schmidt, K. S., Schwarz, J. P., Sodemann, H., R., S. J., Stark, H., Thomson, D. S., Thornberry, T., Veres, P., Watts, L. A., Warneke, C., and Wollny, A. G.: Characteristics, sources, and transport of aerosols measured in spring 2008 during the aerosol, radiation, and cloud processes affecting Arctic Climate (ARCPAC) project, Atmos. Chem. Phys., 11, 2423–2453, doi:10.5194/acp-11-2423-2011, 2011.
Clarke, A. D., Charlson, R. J., and Radke, L. F.: Air-borne observations of Arctic aerosols. IV: Optical prop-erties of Arctic Haze, Geophys. Res. Lett., 11, 405–408, doi:10.1029/GL011i005p00405, 1984.
Dentener, F., Kinne, S., Bond, T. C., Boucher, O., Cofala, J., Gen-eroso, S., Ginoux, P., Gong, S., Hoelzemann, J. J., Ito, A., Marelli, L., Penner, J. E., Putaud, J.-P., Textor, C., Schultz, M., van der Werf, G. R., and Wilson, J.: Emissions of primary aerosol and percursor gases in the year 2000 and 1750 pre-scribed data-sets for AeroCom, Atmos. Chem. Phys., 6, 4321– 4344, doi:10.5194/acp-6-4321-2006, 2006.
Draxler, R. R. and Rolph, G. D.: HYSPLIT (HYbrid Single-Particle Lagrangian Integrated Trajectory) Model access via NOAA ARL READY Website (http://ready.arl.noaa.gov/HYSPLIT. php), NOAA Air Resources Laboratory, Silver Spring, MD, 2010.
Dreiling, V. and Friederich, B.: Spatial distribution of the arctic haze aerosol size distribution in western and eastern Arctic, Atmos. Res., 44, 133–152, doi:10.1016/S0169-8095(96)00035-X, 1997. Fiebig, M., Stohl, A., Wendish, M., Eckhardt, S., and Petzold, A.: Dependence of solar radiative forcing of forest fire aerosol on ageing and state of mixture, Atmos. Chem. Phys., 3, 881–891, doi:10.5194/acp-3-881-2003, 2003.
Frossard, A. A., Shaw, P., Russell, L. M., Kroll, J. H., Canagaratna, M. J., Worsnop, D. R., Quinn, P. K., and Bates, T. S.: Springtime Arctic haze contributions of submicron organic particles from European and Asian combustion sources, J. Geophys. Res., 116, D05205, doi:10.1029/2010JD015178, 2011.
Fuelberg, H. E., Harrigan, D. L., and Sessions, W.: A meteoro-logical overview of the ARCTAS 2008 mission, Atmos. Chem. Phys., 10, 817–842, doi:10.5194/acp-10-817-2010, 2010. Garrett, T. J. and Zhao, C.: Increased Arctic cloud longwave
emis-sivity associated with pollution from mid-latitudes, Nature, 440, 787–789, doi:10.1038/nature04636, 2006.
Giglio, L., Descloitres, J., Justice, C. O., and Kaufman, Y.: An enhanced contextual fire detection algorithm for MODIS,