HAL Id: hal-00069414
https://hal-insu.archives-ouvertes.fr/hal-00069414
Submitted on 8 Sep 2006
HAL is a multi-disciplinary open access archive for the deposit and dissemination of sci-entific research documents, whether they are pub-lished or not. The documents may come from teaching and research institutions in France or abroad, or from public or private research centers.
L’archive ouverte pluridisciplinaire HAL, est destinée au dépôt et à la diffusion de documents scientifiques de niveau recherche, publiés ou non, émanant des établissements d’enseignement et de recherche français ou étrangers, des laboratoires publics ou privés.
Magnetic fabrics and fluid flow directions in
hydrothermal systems. A case study in the Chaillac
Ba-F-Fe deposit (France).
Stanislas Sizaret, Yan Chen, Alain Chauvet, Eric Marcoux, Jean-Claude
Touray
To cite this version:
Stanislas Sizaret, Yan Chen, Alain Chauvet, Eric Marcoux, Jean-Claude Touray. Magnetic fabrics and fluid flow directions in hydrothermal systems. A case study in the Chaillac Ba-F-Fe deposit (France).. Earth and Planetary Science Letters, Elsevier, 2003, 203, pp.(3-4) 555-570. �10.1016/S0012-821X(02)01112-3�. �hal-00069414�
Magnetic fabrics and fluid flow directions in hydrothermal
systems. A case study in the Chaillac Ba–F–Fe deposits
(France)
Stanislas Sizaret, Yan Chen, Alain Chauvet, Eric Marcoux and Jean Claude Touray UMR6113, ISTO, Université d’Orléans, 45067, Orléans Cedex 02, France
Abstract
This study presents a possible use of anisotropy of magnetic susceptibility (AMS) to describe the mineralizing process in hydrothermal systems. Ba–F–Fe-rich deposits within the Chaillac Basin are on the southern border of the Paris Basin. In these deposits hydrothermal textures and tectonic structures have been described in veins, sinters, and sandstone cemented by hydrothermal goethite. 278 oriented cores from 24 sites have been collected in these formations. In addition, a lateritic duricrust superimposed on the hydrothermal formation has been sampled. Rock magnetic investigations show that the principal magnetic carrier is goethite for the hydrothermal mineralization and for the laterite level. The AMS measurements show distinguishable behaviors in the different mineralogical and geological contexts. The K1 magnetic lineation (maximum axis) is strongly inclined for the vertical veins. For the horizontally mineralized sinters, the magnetic lineation is almost horizontal with an azimuth similar to the sedimentary flow direction. The AMS of goethite-rich sandstone close to the veins shows strongly inclined K1 as they are probably influenced by the vertical veins; however, when the distance from the vein is larger than 1 m, the AMS presents rather horizontal K1 directions, parallel to the sedimentary flow. The laterite has a foliation dominance of AMS with vertically well-grouped K3 axes and scattered K1 and K2 axes. Field structural observations suggest that the ore deposit is mainly controlled by EW extension tectonics associated with NS trending normal faults. Combining the AMS results on the deposit with vein textures and field data a model is proposed in which AMS results are interpreted in terms of hydrothermal fluid flow. This work opens a new investigation field to constrain hydrodynamic models using the AMS method. Textural study combined with efficient AMS fabric measurements should be used for systematic investigation to trace flow direction in fissures and in sand porosity.
1. Introduction
Ore deposit hydrodynamics have been studied at mining district scale by different models based on thermicity, fluid buoyancy, fluid fluxes and mass balance (e.g. [1 and 2]). More recently, additional parameters have been integrated, such as heat transport, aqueous mass transport, fracture framework, geochemistry, permeability change (dissolution and precipitation) and tectonics [3 and 4]. The results provide valuable information for general hydrodynamic trends but are not applicable at the scale of the deposit. Independently, the influence of fluid flow direction on mineral textures has been studied at crystal scale [5, 6, 7, 8 and 9]. For example, in aragonite formation, it has been observed that elongated mammillary concretions could be formed in response to solution circulation [5]. Crystal faces exposed to the flow have higher growth rate with respect to faces parallel to streamline or in upstream position [6 and 7]. Gonzalès et al. [8] proposed that high flow velocity may increase the reactant supply rates, leading to the formation of fibrous textures.
Such experimental study and observations on natural deposits show that anisotropic crystal growth could be interpreted in terms of flow direction. The difficulty remains to quantify the crystal anisotropies in three dimensions by classical methods such as microscopy and textural analysis. The anisotropy of magnetic susceptibility (AMS) method offers a powerful tool to investigate such 3D magnetic fabrics of mineralized veins. This method, currently applied to metamorphic, igneous and detritic sedimentary rocks [10, 11, 12 and 13], defines an ellipsoid with three principal oriented axes K1, K2 and K3 (K1≥K2≥K3). The ellipsoid shape and the orientation of its axes are discussed in terms of tectonic deformation (for metamorphic rocks) or flow direction (for magmatic rocks and sediments) [14 and 15]. In these cases, AMS fabrics are interpreted as a response of mechanical constraints and thus attributed to solid deformation for metamorphic formation or crystal orientation in flowing viscous magma. Only few AMS studies have been applied in metallogeny, and the scarce examples have been performed on metamorphic ore deposits [16 and 17], or on pseudotachylite of the Sudbury impact structure [18]. The aim of this study is to apply the AMS method to investigate flow direction of an aqueous fluid in which crystals are formed. Deformation state of the veins is also studied with two objectives: (i) to ensure that AMS fabric is a response of hydrothermal fluid rather than the result of tectonic effects, (ii) to constrain the formation model of mineralized veins and their eventual tectonic control.
2. Geological and tectonic setting
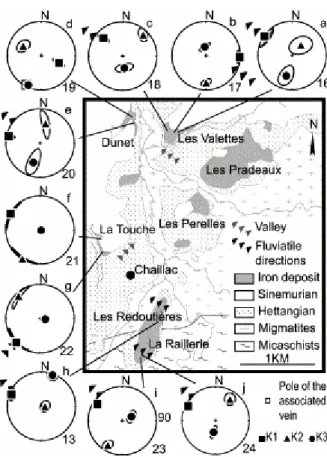
The Chaillac Basin (Fig. 1) is located at the southern border of the Paris Basin where the sedimentary series lie unconformably on the Hercynian metamorphic basement [19]. The filling is composed of transgressive Lower Jurassic Hettangian silicoclastic sediments synchronous with the major tectonic subsidence of the Paris Basin during a large extensive event [21]. In this part of the basin, the tectonics are characterized by an EW extension involving NS normal faults [21]. The ‘Hettangian’ Chaillac Basin is thus limited to the east by N15°E trending normal basement faults (at Les Pérelles and Les Pradeaux; Fig. 1). Hettangian sands show a westward decrease in thickness and are covered by the Lower Jurassic Sinemurian limestone to the northwest.
Fig. 1. Simplified geological map of the Chaillac Basin showing the AMS sampling sites (modified after [19]). MC stands for Massif Central.
During the Hettangian, a widespread F, Ba and Fe-rich hydrothermalism occurred within the French Massif Central borders [19, 20, 21, 22, 23, 24 and 25]. In the La Marche district north of the Massif Central, this mineralizing event is associated with NS and EW normal faults and NS vertical fluorite veins [25]. In the Chaillac Basin, stratiform ore deposits also linked with EW and NS normal fault activity have been formed during the Triassic–Liassic sedimentation ( Fig. 1) [19]. In the case of the Le Rossignol–Les Redoutières hydrothermal system, a stratiform deposit (Les Redoutières) is formed above two normal basement faults (Fig. 2a,b). The former, in the western part, is relatively barren, whereas the second, called the ‘Le Rossignol’ fault, is mineralized and connected to the ‘complexe des Redoutières’ sinter [19] ( Figs. 2a and 2b). The fact that some faults are mineralized and others are barren is still an open question.
3. Sedimentary and metallogenic constraints on the
Chaillac Basin
3.1. Hettangian flow direction
The Hettangian series have been described as successive sand and clay levels [25]. The sand is a coarse, immature arenite comprising angular quartz, altered feldspaths, muscovite, quartz pebbles and metamorphic rock fragments. In the vicinity of mineralized veins, hydrothermal solutions cement the sand, which become sandstone [26].
Fig. 2. Geometry of the Le Rossignol, Les Redoutières and La Raillerie deposits. (a) Schematic Chaillac deposit map. (b) A–A’, cross section of the Les Redoutières stratiform deposit. (c) B–B’, cross section of the La Raillerie deposit. (d) C–C’, cross section of the Chaillac deposits.
Study of the lateral facies variation between sandy channels and clay lenticle confirms the continental and fluviatile origin of the sedimentary environment [27]. Within the Les Redoutières open pit (Fig. 1), 25 measurements of tree trunks give a N30°E trending preferred direction. These trunks could have been deposited parallel or perpendicular to the flow direction. As the Rossignol structures produce a strong dip toward the NW ( Fig. 2b), we supposed that these trunks are deposited in a dam position, perpendicular to the channel. Hettangian flow direction could be deduced to have been in the N300°E direction. At the La Raillerie, some pebbles of barite-rich sinter formation are oriented N40°E 35°SE. They produce an imbrication fabric in which the pebble dip witnesses a local flow direction towards the NW (N310°E) ( Fig. 2a). At a basin scale, Ziserman [19], using basement topography and Hettangian cover thickness, has reconstructed Hettangian valleys ( Fig. 1). This could be due to main NS and secondary EW-oriented normal faults lowered the western and northern compartments respectively, producing a decrease of basement altitude from SE to NW. Combining the sedimentological arguments, tree trunk and pebble positions, a general flow toward N300°E is thus deduced. Moreover, the fact that Hettangian sediments re-worked mineralization shows it to be coeval with the Hettangian sedimentation.
3.2. Le Rossignol–Les Redoutières hydrothermal system
The Le Rossignol–Les Redoutières hydrothermal paragenesis sequence is summarized in Fig. 3. The mineralogical study of the vertical Rossignol vein shows two major stages; the green– purple fluorite stage and the yellow fluorite–barite stage [28]. The latter is divided into three sub-stages, that are the only ones encountered within stratiform mineralization. In the stratiform deposit, these sub-stages are herein defined as: fluorite-dominant, barite-dominant and barite- and goethite-rich ( Fig. 3).
Fig. 3. Evolution of the general paragenetic mega-sequence.
The geometry of the deposit consists of two distinct parts: the main structure (Rossignol veins and associated flat ones; Fig. 2b) and the cross veins ( Fig. 4). Both are associated with sand porosity filling. These two kinds of structure are shown on the schematic block diagram of Fig. 4.
Fig. 4. Synthetic diagram showing the mineralogy and structure of the Les Redoutières deposit. (a) Texture of the horizontal part of the Le Rossignol vein (main structure) filled by micro-sequence of crystallization (fluorite/barite) (see also Fig. 5a,b). (b) The upper sequence is barite-enriched and fluorite-depleted. (c) Fluorite vein cut and then sealed by barite (see Fig. 5c). (d) Pull-apart filled by fluorite and barite micro-sequences. (e) Ba–Fe sinter, the vertical vein passing in continuum to horizontal single ribbon (see Fig. 5g). (f) Ba–Fe sinter crust cross-cut by goethite-rich vein. (g) Goethite predominance with texture of horizontal precipitation at the end of the stage.
The main structure is the flat fluorite-dominant vein in the Hettangian cover, which is connected to the main fault-related vertical vein, hosted in the basement (Fig. 2b). The flat veins are organized in 1 m to 1 cm thick fluorite/barite sequences ( Fig. 4a). The barite is virtually absent in oldest sequences. Fluorite levels crystallize in the form of two ribbons with centripetal growth forming flat veins ( Fig. 5a). Voids between the ribbons can be filled alternatively by: (i) additional fluorite geodic crystallization (Fig. 5a); (ii) granular fluorite with sedimentary textures ( Fig. 5a,b); or (iii) barite in single ribbons with a centripetal sheaf structure generally growing upward ( Fig. 4a,b). Though lateral variations are observed ( Fig. 4a), barite always appears to be the latter ( Fig. 5a). In EW sections, some voids exhibit some pull-apart-like geometry, suggesting a downward displacement of northern and western compartments ( Fig. 4d). Moreover, veins and fluorite ribbons show vertical truncation filled by latest fluorite ( Fig. 5b) or barite ( Fig. 4 and Fig. 5). Such fluorite/barite sequences are repeated and evolve upwards with time. Younger and higher sequences are thicker, barite-enriched and fluorite-depleted ( Fig. 4b). Thin goethite cracks cut these structures ( Fig. 4c). Cross veins are formed by the intersection between vertical and horizontal veins. Vertical vein azimuths are mainly NS and EW, the former being thicker than the latter (average thicknesses: mNS=0.13±0.21 m, mEW=0.07±0.06 m, 72 measurements). The thickness of vertical veins increases upward and their fillings are symmetric with the succession, from the rim toward the core, of geodic fluorite ribbons, sheaf barite ribbons and final goethite mammillary concretions called ‘botryoid’ (Fig. 5g,h). This succession exists at two scales: a deposit scale (mega-sequence) and a vein-filling scale (micro-sequence). The mega-sequence evolution forms three successive envelopes of the deposit and accounts for the three mineralogical sub-stages: fluorite-rich, barite-rich and barite–goethite-rich ( Fig. 2 and Fig. 3). The micro-sequence chemistry progressively changes with an increasing barite concentration associated with decreasing fluorite, and a goethite concentration being maximum within the latest filling ( Fig. 4e–g). These successive micro-sequences fill the veins, with three modes of reopening: (i) at the center of the vein ( Fig. 5d), (ii) at the boundary wall/vein including some sandstone fragments in the vein structure, and (iii) along discontinuities between successive ribbons ( Fig. 5e,f). Microstructures indicate reopening with downward movement of the northern compartment ( Fig. 5f). Horizontal shearing planes are also presented that control the formation of thicker barite layer ( Fig. 5d). The relation between vertical and horizontal structures is obvious. Vertical veins pass in continuum to horizontal veins with symmetrical ribbons (veins) or in a single barite ribbon (sinter crusts) ( Fig. 4e,f). Sinter crusts are made of single barite and goethite ribbons that precipitated at the paleosurface with sheaf and botryoid textures, respectively, and with upward growth directions. Crusts host younger horizontal and vertical veins forming a sinter structure ( Fig. 4f). These crusts are interlayered with the Hettangian sandstone, and locally, in horizontal ore layers, goethite ribbon clasts have been locally reworked ( Fig. 5i). These observations suggest that the sinter is coeval with Hettangian sedimentation as previously illustrated.
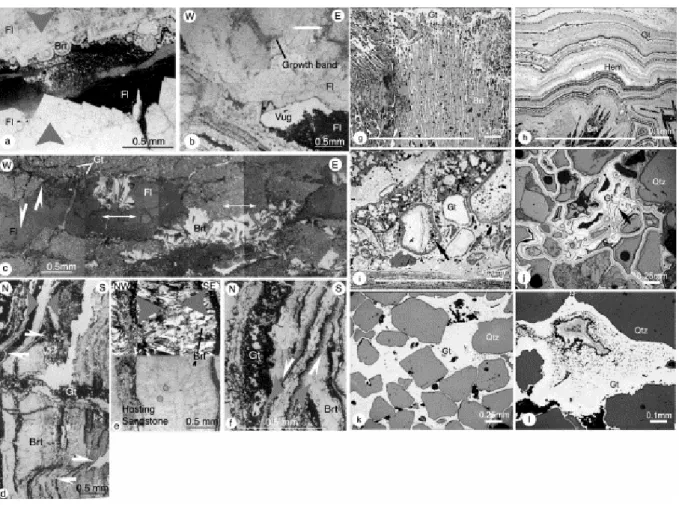
Fig. 5. Mineralogy of the fluorite-dominant stage and goethite microscopic textures. (a) Centripetal growth of fluorite, forming a vug, filled by grained fluorite and barite spherolite (see Fig. 4a). (b) Truncated fluorite growth band sealed by younger fluorite precipitation (see Fig. 4a). (c) Truncated and normal sheared fluorite vein with western lowered compartment, the vein is sealed by sheaf barite crystallization, the latest small fractures are filled with goethite (see Fig. 4c). (d) Ribbons of barite and goethite horizontally sheared and cut by latest goethite-rich vein. (e) Vertical vein filled with barite and a little fluorite seen by polarized (upper) and analyzed (lower) light, respectively. (f) Reopening process of the vertical vein, fractures with centripetal filling reopen vein along discontinuities between ribbons. (g) Barite sheaf structure coated by goethite. (h) Colloform goethite ribbon. (i) Clasts cemented in the sinter formation; arrows indicate reworked goethite ribbon clast. (j) Colloform goethite cement of sandstone. Arrow indicates thin desiccation crack. (k) Massive texture in laterite ferruginous duricrust (see Fig. 7a). (l) Hydrothermal colloform goethite relic recrystallized with massive texture (see Fig. 8g). The larger edge of the microphotograph is parallel to the vein (for g, i and j); Fl, fluorite; Brt, barite; Gt, goethite; Qtz, quartz; and Hem, hematite; white arrows show the deformation direction and gray ones the mineral growth direction.
In addition, ore also occurs as sandstone cement within the sand pores. Fluorite impregnations are mainly found close to the main structure, whereas, laterally, barite invades the bottom of the Hettangian formation. Goethite occurs on the top of the deposit (Fig. 2b–d) where quartz, muscovite and feldspar clasts are coated by colloform goethite that crystallizes in a thin layer ( Fig. 5j).
3.3. Other deposits of the Chaillac Basin and lateritic occurrences
Located more to the south, the La Raillerie deposit is in continuity with Les Redoutières (Fig. 2a). The La Raillerie hydrothermal system has a similar association between NS trending basement faults, barite and goethite impregnation in sand porosity and minor barite-rich cross veins. Fluorite is almost absent and two main differences are highlighted: (i) The NS main
fault is associated with NS basement cracks filled by Hettangian sand ( Fig. 2c). Inter-relationship between cross vein and such faults suggests that they are contemporary. (ii) In the western part of La Raillerie and above the hydrothermal formation, sand enriched in detritic goethite alternating with clay lenticle is lateritized ( Fig. 2c). The lateritic profile begins 3 m beneath the surface with a 15 cm thick stone line consisting of quartz and minor goethite grains. In this level, silica is assumed to have precipitated and to have fed pre-existing detritic quartz grains, as suggested by epitaxial overgrowth textures. Upwards, the sand appears more or less cemented by goethite, presenting a cavernous structure, and is covered by a ferruginous sandstone on top. This latter level is a 1.5 m thick duricrust, displaying relics of oblique sedimentary stratifications and made of coarse quartz themselves cemented by goethite with massive texture ( Fig. 5k).
In the northern part of the Chaillac Basin, the other goethite-rich stratiform deposits have similar paragenesis to the one established at Les Redoutières; indeed, it could be extended at the Chaillac Basin scale. The lateritic event is common to all the deposits, and close to the surface, hydrothermal botryoids have recrystallized with a massive texture (Fig. 5l) [29].
4. Mineralogical study and magnetic analysis
In order to characterize AMS fabrics in different geological contexts and to distinguish the influence of laterization on the hydrothermal magnetic fabrics, samples were collected from horizontal and vertical veins, laterites and host rocks. 278 cores of mineralized veins, laterite and ferruginous sandstones were sampled from 24 sites using a gasoline drill. The core azimuths were measured by both magnetic and sun compasses, when possible. The angular differences between two measurements were negligible (<3°).
4.1. Magnetic mineralogical analysis
The magnetic susceptibility carriers were identified, using the following methods: X-ray diffraction analysis (PW 1380 Philips diffractometer), isothermal remanent magnetization (IRM; IM30 pulse magnetizer) and thermomagnetic experiments (CS3 apparatus coupled with KLY-3S kappabridge).
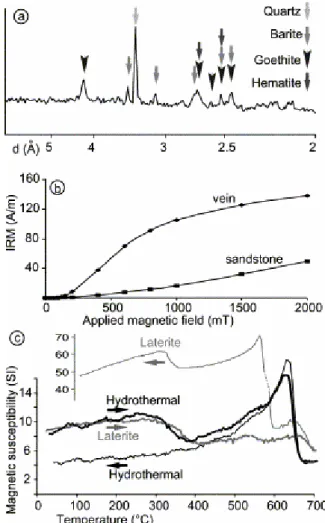
X-ray diffraction analysis applied to sandstone showed the dominance of quartz, barite and goethite with scarce hematite (Fig. 6a). IRM shows that no magnetic saturation could be observed up to 2 T for both goethite-rich sandstone and mineralized veins, confirming the existence of high magnetic coercivity minerals such as goethite and hematite (Fig. 6b). The evolution of magnetic susceptibility versus temperature depends on the goethite origin, lateritic or hydrothermal ( Fig. 6c). In both cases partial heating has shown that the curves are irreversible at low temperature (200 and 300°C, respectively). For both the major decrease of the susceptibility between 280 and 300°C is coeval with dehydration by producing abundant water, thus the curves reflect goethite transformation. In the hydrothermal case, the curve shows a slight decrease of the susceptibility at about 100°C, typical for goethite [30 and 31]. The important variation of the susceptibility between 600 and 680°C indicates the existence of hematite, which is probably produced by the dehydration of goethite ( Fig. 6c) [30, 31 and 32]. The neogenic hematite shows a lower susceptibility (5) Fig. 6c). For lateritic samples no evident drop is observed at 100°C, and after the decrease between 350 and 400°C, we observed a slight drop and an important one at about 580 and 680°C, suggesting the existence of magnetite and hematite, respectively ( Fig. 6c). During cooling the susceptibility drastically increases after 580°C, indicating that more magnetite is formed; finally we observed an
increase between 300 and 350°C ( Fig. 6c). These curves are difficult to interpret because they are irreversible at low temperature, reflecting important mineralogical transformations during the heating [31 and 32]. This implicates that this thermal analysis cannot directly determine the AMS carrier. Combining the IRM measurement (high coercivity) and X-ray analysis (goethite dominance), we conclude that the goethite is the major AMS carrier in the hydrothermal and lateritic samples.
Fig. 6. Determination of the susceptibility carrier. (a) X-ray diffraction performed on hydrothermal sandstone. (b) Isothermal remanent magnetization (IRM) on hydrothermal sandstone and vein. (c) Magnetic susceptibility variation versus temperature from both laterite and hydrothermal formation.
4.2. AMS results
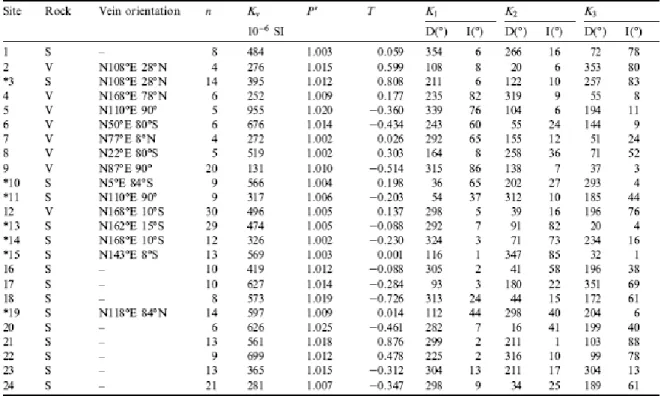
At least four cores were measured for each site (Table 1). The anisotropy degree (P′, ‘ellipticity’ [33]), is generally weak for all sites, varying from 1.002 to 1.025. The shape parameter (T; T<0, prolate shape; T>0, oblate shape [33]) is variable, depending on geological and hydrothermal contexts. The average orientations of K1, K2, K3 were calculated with bivariate statistics (Table 1) [34]. Magnetic foliation (K1–K2 plane) and corresponding vein orientation are shown in Fig. 7.
Table 1. AMS data and parameters measured in the Chaillac Basin
S, sandstone; V, vein; *, for sandstone the orientation of the neighboring vein is given; Kv, volumetric susceptibility; n, number of measured samples; P′, corrected anisotropy degree, P′=exp{2[(ln K1−ln Km)2+(ln
K2−ln Km)2+(ln K3−ln Km)2]}1/2 with ln Km=(ln K1+ln K2+ln K3)/3 and K1, K2, K3 the directions of the maximum, intermediate and minimum ellipsoid axes, respectively [33]; T, shape parameter, T=[2ln(K2/K3)/ln(K1/K3)]−1 [33]; D and I, declination and inclination.
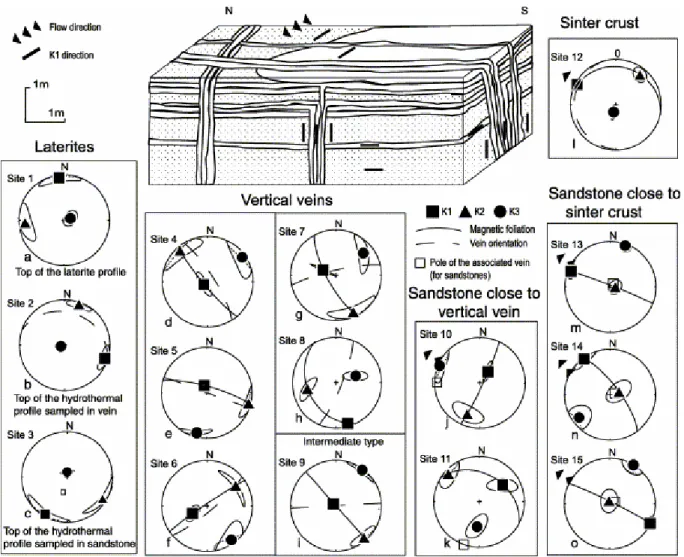
Fig. 7. Block diagram showing the sampling areas with corresponding K1 directions and AMS stereo-diagrams from each mineralogical and geological context (projection in lower hemisphere). The 95% interval of confidence has been calculated independently for each axis.
4.2.1. Laterite
Sites 1, 2, 3 and 21 show the AMS results from ferruginous sandstone of the lateritic profile and sinter formation close to the surface (Fig. 7 and Fig. 8). K3 is strongly inclined, K1 and K2 are scattered in the horizontal plane. The positive shape parameters T for these sites suggest a predominantly oblate shape, with a ‘sedimentary-type’ magnetic fabric (Table 1) [10].
4.2.2. Hydrothermal formation
The K1 axes of vertical veins (sites 4–9) are all within the vein plane except site 8 (Fig. 7d–i). In sites 4–7 and 9 K1 is strongly inclined (Fig. 7d–g,i). Site 8 shows horizontal K1 and the vein azimuth is slightly closer to the K1 axis than to K2 (Fig. 7h). Considering the general trend, K2 and K3 show a coherent mean direction with a NW K2 and a NE K3 except for sites 6 and 8. More generally, the shape of the 95% interval of confidence shows a possible exchange between K2 and K3. The average shape parameter T is variable and slightly positive, but is not well defined between prolate and oblate (Table 1). Magnetic foliation orientations and vein planes could be assimilated for sites 4–6 ( Fig. 7d–f); in these cases K3 and vein poles have a coherent orientation. For sites 7–9, the magnetic foliations are clearly different from their
corresponding vein plane (Fig. 7–i); in the two former (sites 7 and 8) the magnetic foliation is normal to the vein, whereas the latter (site 9) is at about 45°.
Fig. 8. Map of Chaillac ferruginous sandstone basin with AMS sandstone sites, comparing K1 and sedimentary flow directions (projection in lower hemisphere).
The sinter crust (site 12) has K1 almost horizontal with a NW azimuth (Fig. 7l), parallel to the sedimentary flow direction deduced from tree trunk positions. The shape parameter (T), is weakly positive value and indicates a slightly oblate shape (Table 1). Statistically, the magnetic foliation coincides with the corresponding vein plane ( Fig. 7l).
The AMS of sandstones relatively close (up to 10 cm) to the mineralized veins (sites 10, 11 and 19) can be compared with those from samples neighboring the vertical veins (Table 1 and Fig. 7 and Fig. 8). The K1 axes are well-grouped with vertical (site 10) or oblique dips (sites 11 and 19). The value of the shape parameter is generally negative, suggesting a predominantly prolate shape (Table 1). AMS results from the zones close to the horizontal sinter crust (sites 13–15) show that the K1 axis is always horizontal with a direction similar to the sedimentary flow (Fig. 7m–o). The shape parameter T is prolate (Table 1).
On the scale of the Chaillac Basin, ferruginous sandstones far away from the sinter formation show that horizontal K1 axes are parallel to the Hettangian sedimentary directions [19] ( Fig. 8). All sites (16–24) show negative shape parameters ( Table 1), with a predominance of the magnetic lineation. K2 and K3 orientations are variable.
4.3. Textural analysis of goethite in cross veins
Goethite is the main susceptibility carrier in hydrothermal formation, so its texture necessitates a better characterization to interpret AMS analysis. If barite crystallizes in sheaf structure with centripetal growth (Fig. 5g), goethite ribbon orientation is controlled by both vein directions ( Fig. 5h) and barite radiating sheaf structures ( Fig. 5g). In the former case, goethite ribbons are parallel to the vein, whereas in the latter, goethite layers follow the barite shape and [001] cleavage, which have an average orientation perpendicular to the vein plane. In goethite ribbon, a goniometric study has been attempted to find the orientations of the [002] lattice plane of goethite normal to the <c> axes. No coherent result is obtained; for a single sample, two distinct areas give different results (Fig. 9). This is probably because the size of the studied surface is not representative ( 15 mm2). Because goethite fibers (parallel to <c>) are radial it was considered that the <c> axes have a mean direction orthogonal to the vein plane.
Fig. 9. Lattice-preferred orientation for [002] pole plane corresponding to <c> axis, and AMS performed on goethite vein. Both stereograms are from the same sample on different areas. (a) The stereogram displays a texture where axis <c> makes an angle of 60° with the vein plane. (b) This stereogram does not show any preferred orientation. The levels indicate relative intensity of diffracted X-rays.
To quantify the mineral orientation shape and alignment in the colloform ribbons, image analysis has been carried out on a thin section (1.75 cm×1.75 cm) parallel to the goethite ribbon (Fig. 10). Colloform ribbons have botryoidal shapes and junctions between botryoids are herein called ‘hollow’ (Fig. 10). 184 hollows and 187 botryoids have been redrawn on a ×200 scale in a unique goethite layer to avoid the section effect. Using image analysis, statistical calculations have been performed on: (i) botryoid/hollow shapes and long axis trends, and (ii) direction and distances between neighboring botryoids and hollows. Botryoid and hollow shapes are simulated as ellipses and an average ellipse of the botryoid shape is statistically calculated using the SPO (Shape Preferred Orientation) program [35, 36 and 37]. The distribution is calculated with the ‘center-to-center’ method [38].
Fig. 10. Textural analysis of goethite botryoids in a vein. (a) Representative thin section for AMS and mineral alignment comparison. H and B stand for hollow and botryoid, respectively. The section is in the vertical vein plane (N110°E90°) that is mineralized with colloform goethite. (b) AMS measurements show: K1/K2=1.02 (ellipticity), and K1 (317°, 77°). (c) Results of image analysis on the thin section. The two stereograms on the left show the average shapes of botryoids and ‘hollows’, the two on the right present the average distance between ‘nearest neighbors’ for botryoids and hollows (distribution, ‘center-to-center’ method).
Fig. 8 shows the averages of the long axes of botryoid and hollow ellipses, with the corresponding pitches of 68°E and 22°W, respectively. Botryoid ellipticity has a mean value of 1.04 and is weaker than the hollow one (1.65). The distributions of the marker (hollow and botryoid) are described by an ellipse. Its smallest axis represents the direction along which the distance between two markers is shortest. Such an axis could be considered as a marker of an ‘alignment’ direction. Results give a pitch of small axes of 99°W for botryoids and 91°W for hollows ( Fig. 10). Ellipticity is relatively similar for both markers, with values of 1.10 and 1.18, respectively. These distributions show a good coherence between the small axes of the center-to-center ellipse and the AMS K1 axes.
5. Discussion and conclusion
5.1. Main results
Even though in the southern border of the Massif Central, an Eocene remagnetization has been interpreted as the signal of fluid migration producing Pb, Zn, F, Ba, Mississippi valley-type mineralization [39], at Chaillac our data suggest a Hettangian age for the hydrothermal deposition. Arguments are: (i) the F, Ba, Fe paragenesis is hosted by the Hettangian detritic formation and this mineralization modifies the sediment (e.g. barite pebbles and sandstone with detritic goethite grains); (ii) an important part of the mineralization forms a Ba–Fe–(F)– rich sinter interbedded in the Hettangian sediments; (iii) the Sinemurian is barren [19]. An Eocene lateritic event is regionally known and could be superimposed to a previous formation close to the Eocene paleo-surface [19 and 40].
Vein fillings consist of a micro-sequence of crystallization, evolving in time from fluorite-dominant to barite-fluorite-dominant and finally to goethite. This evolution can be integrated within a similar mega-sequence succession of fluorite–barite–goethite, which corresponds to the chemically reduced mega-sequence fluorite–barite–marcasite observed at the root of the main Le Rossignol structure [28].
The flat fluorine veins show normal shearing and are truncated during the hydrothermal event (Fig. 4 and Fig. 5). These may occur after the beginning of the Hettangian sedimentation. The vertical veins are oriented NS and EW, their filling textures are centripetal, symmetric and show successive reopening with locally slight normal shearing ( Fig. 5e,f). The statistics on thickness suggest that the reopening process is more important in the NS veins and that NS and EW basement faults were contemporaneous.
In laterite, the susceptibility carrier is goethite. The magnetic fabrics are oblate, with a horizontal foliation, horizontally scattered K1 and K2, and vertical K3. Within the hydrothermal formation, the main susceptibility carrier is goethite, the AMS fabrics are essentially prolate. K1 is parallel to the fluviatile direction, except for vertical veins where K1 is usually vertical, frequent K2 and K3 exchanges occur. The majority of studied vertical veins present a coherent AMS mean direction with vertical K1 and NW–SE magnetic foliation parallel, or normal, to the vein plane. Finally, within veins, hollow and botryoid alignments are coherent with K1 directions.
5.2. Tectonic control and hydrothermalism
Successive reopening, with symmetric filling in cross veins and truncation of the flat veins sealed by the mineralization suggest that pure extension was synchronous with the deposition. As the NS veins are larger than the EW ones, we deduce that the EW extension is more important than the NS one. This is consistent with the occurrence of NS basement cracks interpreted as intense EW tectonic extension, as in the Saar–Nahe basin [41] ( Fig. 2c). By extension, these observations confirm that EW and NS basement faults are synchronous. Normal shearing and pure extension could be the tectonic response of the Chaillac Basin to the general subsidence of the Paris Basin during an EW extension [20]. The minor EW-oriented normal faults have probably accommodated the northward deepening due to the evolution of the depositing center of the Paris Basin.
This study allows us to reconstruct the behavior of a F–Ba–Fe-rich sinter during its formation. The chemical evolution of the mineralization in the deposit can be described at two time scales: bulk hydrothermal chemistry evolution (i.e. mega-sequence) and micro-sequence of crystallization. Both start with fluorite, followed by barite, then end with goethite. The mega-sequence of crystallization is correlated in time to the feeder veins (i.e. the Rossignol fault vein) [29]. As the flat fluorite crystallized before the fluorite in the vein ( Fig. 11a) [28], it can be supposed that when the barite crystallized in the stratiform deposit, fluorite was deposited in the deep vein ( Fig. 11b). A similar process could be proposed to explain the stratification of the three sub-stages and thus for barite and goethite precipitations ( Fig. 11c).
Fig. 11. Ore deposit model for the Le Rossignol–Les Redoutières hydrothermal system. In this model, (a) fluorite deposition starts at the top of the Rossignol vein, (b) during the les Redoutières barite-dominant stage, fluorite is deposited in the Le Rossignol deep part, and (c) during the goethite and barite-rich Redoutières stage, barite is deposited in the Rossignol vein.
The migration of the mineralizing fluid is controlled by the regional tectonics of the Hettangian subsidence of the Paris Basin. This event forms the (N15°E and N105°E) basement faulting system, which conducts the hydrothermal fluid towards the surface and thus allows it to impregnate the sand. Mineralized sandstones became more competent as their porosities decreased. Afterwards, sandstones were fractured, making more fluid migration to the surface and sinter formation possible. Opening of the horizontal veins is problematic in such an environment. In normal structures, the hydrostatic pressure dominates close to the surface. However, it is possible that local fluid over pressure occurs under impermeable cover and open horizontal vein. Fluorite grain sedimentation suggests a decrease of flow transport capacity, indicating that flow velocity and fluid pressure decreased at the end of the micro-sequence deposition. Moreover, the succession of micro-micro-sequence crystallization within the faults is linked to successive vein reactivations forming normal or pure extensional structures.
5.3. Magnetic fabric genesis
5.3.1. Comparison between textural analysis and magnetic fabric in
hydrothermal formations
The goethite is the main magnetic susceptibility carrier. The AMS fabric is thus linked to lattice-preferred orientation, grain shape and alignment [10]. Because of its crystallographic and magnetic character, goethite has an inverse fabric, i.e. its magnetic susceptibility along the <c> axis (the longer crystallographic axis) is weaker than in the basal plane (<a> and <b> crystallographic axes) [11 and 30]. The goethite lattice orientation has not been clarified by goniometric analysis in botryoidal textures ( Fig. 9) and the <c> axes are assumed to be normal to the precipitation surface in a vein.
The planar shape of the goethite ribbon would favor an oblate fabric with K1, K2 scattered in the vein plane. The <c> axes’ preferred orientation should produce well-grouped K3 normal to the vein. However, the AMS study does not show such results in either vein or sinter crusts. Because the goethite has an inverse fabric and the magnetic fabric is mainly prolate (Table 1), the well-grouped K1 orientations may be due to botryoid linear shape or alignment in the vein plane.
Statistics performed on ‘hollow’ and botryoid-shape orientations do not show a good correlation with AMS data. ‘Hollow’ and botryoid distributions deduced from the ‘center-to-center’ analysis show similar orientation. Alignments of ‘hollows’ and botryoid structures within the same plane do not have the same significance in the interpretation of the AMS results. Botryoids are concentrations of goethite and ‘hollows’ are characterized by a lack of goethite. However, the botryoidal alignment, defined by the ‘center-to-center’ method, can be correlated to the K1 directions obtained by AMS analysis. The ellipticity, around 1.1, obtained for the botryoidal alignment is not significantly different from the AMS ellipsoid value (1.024) considering that the AMS signal could be diluted by the presence of barite. These observations may suggest that the K1 direction is due to the botryoid alignments (Fig. 7).
5.3.2. The genesis of the magnetic fabrics in hydrothermal formations
Observation of the magnetic foliations in the vicinity of the vertical vein shows a relatively constant NW–SE trend (except for site 6, Fig. 7f) that could be interpreted as the result of a possible NE–SW compression during crystallization or post-crystallization. However, the Hettangian compression in the Chaillac Basin is unlikely because: (i) NS and EW vein fillings are symmetric and do not present any feature of conjugate veins, (ii) all the tectonic structures linked to hydrothermalism suggest an extensional pattern, and (iii) no compressive event is evidenced during the Hettangian [21]. The overprint by late Cretaceous and Tertiary compressive tectonics is far from evident because: (i) samples from sandstones and veins show different orientations of the magnetic foliation, (ii) the anisotropy degree is too weak to show posterior compressional deformation, and (iii) no compressive structure has been regionally described.
In samples from sinter crust and sandstone, K1 orientations are horizontal and parallel to sedimentary currents. These could be considered parallel to the surficial hydrothermal stream during Hettangian times (Fig. 8). Moreover, in vertical veins, K1 usually has a vertical dip (e.g. Fig. 7d–j), possibly indicating hydrothermal stream directions within veins and suggesting a strong link between K1 and fluid flow directions. The AMS results of sandstones
close to vertical veins show that flow in vertical veins has possible local influence on the fabrics of the host rocks (Fig. 7 and Fig. 8).
Indeed, if K1 is linked to the flow direction, then the goethite botryoid alignment may be controlled by hydrothermal flow. This interpretation can be compared to aragonite reniform-aligned structures that are parallel to the flow direction [5]. In these cases, botryoidal alignments should be the result of the anisotropic growth rate due to the differential supply along the streamline. In the vein, the botryoid alignments formed by solution flow are comparable with sedimentary flowforming linear structures. Such structures have been interpreted as the result of circulation with helicoidal streamlines [42]. The zones with higher rates of particle supply are located along lines where streamlines converge, explaining linear structures as having formed parallel to the main flow. Supply from a concentrated solution may follow the same law and give alignments parallel to the streamline, presenting aligned crystallization.
The majority of studied vertical veins present well-grouped vertical lineation (K1 axes); however, K2 and K3 show important azimuthal dispersion, suggesting that K2 and K3 may exchange (Fig. 7). The phenomenon of K2–K3 exchange may be explained by the lattice-preferred orientation of goethite <c> axes with respect to the vein. Two extreme cases may be considered. The first is that K3 is normal to the vein plane, i.e. the foliation is parallel to the vein plane. This may be due to the orthogonal relationship between <c> axes of goethite and the vein plane, illustrated in Fig. 5h for pure goethite bands. The second case shows that K3 is parallel to the vein plane, i.e. the foliation is normal to the vein plane, when the barite and goethite are crystallized in the same bands. This could be due to the orthogonal orientation of goethite <c> axes with respect to the [001] barite faces. As the barite faces are perpendicular to the vein, <c> axes are statistically parallel to the vein (Fig. 5g). As the samples are taken from different contexts, this is the reason why K2 and K3 are azimuthally scattered. This kind of fabric has been described by Rochette et al. [11]. In such conditions, the magnetic foliation presents rather the goethite crystal growing in hydrothermal flowing solution than the tectonic constraint.
The AMS results for the sandstones are more difficult to interpret because the goethite ribbons coat sand grains and thus do not show any well-defined structure. Lattice-preferred orientation and shape orientation are not easily characterized by image analysis. The goethite spatial distribution in the samples is probably responsible for the magnetic lineation. Based on the strong correlation between flow direction and AMS linear fabrics, it is proposed that streamlines control the goethite precipitation. Grain faces exposed to flow may have higher supply rates from hydrothermal solution, as for experimental crystal growth [6]. In such conditions, goethite growth on these faces will be faster than on other faces. This mechanism could reinforce goethite alignment along grain faces exposed to the flow.
5.3.3. Laterite
Ellipsoids obtained by AMS measurements for lateritic duricrust samples show an oblate shape, with K3 vertically grouped and K1, K2 horizontally scattered (Fig. 10 and Fig. 7). Such fabrics have been described for laterite [43]. Similar results obtained at the surface of the Les Redoutières sinter formation are interpreted as iron remobilization during the lateritization process. This suggests that, close to the surface, lateritic fabrics have replaced hydrothermal ones [29]. This is confirmed by goethite recrystallization close to the alteration front ( Fig. 5l)
and explains the mixture of both hydrothermal and lateritic-related fabrics observed within intermediate levels ( Fig. 10a,g).
5.4. Conclusion
The K1 given by AMS analysis in the vertical veins, sinter crusts and sandstones are interpreted in terms of hydrothermal fluid directions. In vertical vein and sandstone close to these veins, the K1 direction is strongly inclined, which is interpreted as the consequence of a vertical stream direction; for both sinter crust and sandstone cement far away from the vertical veins, K1 directions are similar to sedimentary flow. More generally, we propose that minerals precipitated during fluid circulation have oriented distribution responsible for magnetic anisotropy of the susceptibility carrier.
This work opens a new investigation field to constraint hydrodynamic modeling using the efficient AMS method. Textural study and AMS fabric measurements should be used for systematic investigation to trace flow direction in fissures and in sand porosity.
Acknowledgements
We specially thank F. Pinier from the Barytine de Chaillac, J-P. Chambard and F. Blanchard from the Société Industrielle du Centre for providing access to their unpublished mine documents and for financial support. L. Barbanson, A. Boullier, B. Henry and M. Jébrak are acknowledged for stimulating discussions and constructive comments
References
1. P.A. Domenico, F.W. Schwartz, Physical and Chemical Hydrogeology, Wiley, New York, 1990, Chap 9, pp. 317–357.
2. H.L. Barnes, Geochemistry of Hydrothermal Ore Deposits, 3rd edn., Hubert Lloyd Barnes, 1997, pp. 125–191.
3. G. Garven, M.S. Appold, V.I. Toptygina and T.J. Hazlett, Hydrogeologic modelling of the genesis of carbonate-hosted lead zinc ores. Hydrogeol. J. 7 (1999), pp. 108–126
4. B.E. Hobbs, Y. Zhang, A. Ord and C. Zhao, Application of coupled deformation, fluid flow, thermal and chemical modelling to predictive mineral exploration. J. Geochem. Explor. 69–70 (2000), pp. 505–509.
5. L.M. Lebedev, Metacolloid in Endogenic Deposits, Plenum Press, New York, 1967, 298 pp.
6. M. Prieto and J.L. Amoros, On the influence of hydrodynamic environment on crystal growth. Bull. Minéral. 104 (1981), pp. 114–119.
7. S.E. Kessler, R.E. Stoiber and G.K. Billings, Direction of flow mineralizing solutions at Pine Point. N.W.T. Econ. Geol. 67 (1972), pp. 19–24.
8. L.A. Gonzàles, S.J. Carpenter and K.C. Lohmann, Inorganic calcite morphology: Roles of fluid chemistry and fluid flow. J. Sediment. Petrol. 62 (1992), pp. 382–399.
9. I. Kostov, R.I. Kostov, Crystal Habits of Minerals, Pensoft, Sofia, 1999, 415 pp.
10. D.H. Tarling, F. Hrouda, The Magnetic Anisotropy of Rocks, Chapman and Hall, London, 1993, 217 pp.
11. P. Rochette, M. Jackson and C. Aubourg, Rock magnetism and the interpretation of anisotropy of magnetic susceptibility. Rev. Geophys. 30 (1992), pp. 209–226.
12. G.J. Borradaile and B. Henry, Tectonic application of magnetic susceptibility and its anisotropy. Earth Sci. Rev. 42 (1997), pp. 49–93.
13. J.L. Bouchez, D.H.W. Hutton, W.E. Stephens, Granite: From Segregation of Melt to Emplacement Fabrics, Kluwer Academic, Dordrecht, 1997, 368 pp.
14. F. Hrouda, Magnetic anisotropy of rocks and its application in geology and geophysics.
Geophys. Surv. 5 (1982), pp. 37–82.
15. S. Nomade, H. Théveniaut, Y. Chen, A. Pouclet and C. Rigollet, Paleomagnetic study of French Guyana Early Jurassic dolerites: hypothesis of a multistage magmatic event. Earth
Planet. Sci. Lett. 184 (2000), pp. 155–168.
16. H. Siemes, H. Schaeben, C.A. Rosière and H. Quade, Crystallographic and magnetic preferred orientation of hematite in banded iron ores. J. Str. Geol. 22 (2000), pp. 1747–1759. SummaryPlus | Full Text + Links | PDF (1582 K)
17. L.A. Tompkins and D.R. Cowan, Opaque mineralogy and magnetic properties of selected banded iron-formarions, Hamersley Basin, Wetsern Australia. Aust. J. Earth Sci. 48 (2001), pp. 427–437.
18. R.G. Scott and J.G. Spray, Magnetic fabric constraints on friction melt flow regimes and ore emplacement direction within the south Range Breccia Belt, Sudbury Impact structure.
Tectonophysics 307 (1999), pp. 163–189.
19. A. Ziserman, Les gisements de Chaillac (Indre): la barytine des Redoutières, la fluorine du Rossignol. Association d’un gîte stratiforme de couverture et d’un gîte filonien du socle.
Mém. BRGM 104 (1980), pp. 344–374.
20. F. Guillocheau et al., Meso-Cenozoic geodynamic evolution of the Paris Basin: 3D stratigraphic constraints. Geodin. Acta 133 (2000), pp. 189–246.
21. J.C. Baubron, M. Jébrak, C. Joannès, J. Lhégu, J.C. Touray and A. Ziserman, Nouvelles datation K/Ar sur des filons à quartz et fluorine du Massif central français. C.R. Acad. Sci.
Paris D 290 (1980), pp. 951–953.
22. J. Bouladon and P.C. de Graciansky, Les minéralisations de couverture (Plomb, zinc, cuivre barytine, fluorine, …) du Trias au pliocène, en France. Chr. Rech. Min. 480 (1985), pp. 17–33.
23. C. Marignac and M. Cuney, Ore deposits of the French Massif Central: insight into the metallogenesis of the Variscan collision belt. Miner. Depos. 34 (1999), pp. 472–504.
24. S. Yaman, Etude géologique et minéralogique des filons de fluorine de la Charbonnière (Haute Vienne) et du Chatenet (Vienne). Annexes fluides et microfaciès de la fluorine ambrée du filon du Rossignol (Chaillac Indre), Ph.D. Thesis, Univ. Orléans, 1977, 124 pp.
25. D. Ninkovic. Etude géologique et métallogénique du bassin de Chaillac (Indre), Ph.D. Thesis, Univ. Paris, 1961, 98 pp.
26. J.C. Touray and A. Ziserman, Sur la genèse des gisements (F-Ba-Fe-Mn) de Chaillac. Les Paléosurfaces et leur métallogenèse. Mém. BRGM 104 (1980), pp. 377–380.
27. J.J. Châteauneuf, Etude de la microflore dans le gisement barytique de Chaillac. Mém.
BRGM 104 (1980), pp. 375–376.
28. S. Sizaret, E. Marcoux, M. Jébrak, J.C. Touray, Multiphase hydrothermal activity and intra-vein sedimentation in Le Rossignol fluorite vein deposit (Chaillac, Indre, France): genetic implications, Econ. Geol. (2003) submitted.
29. S. Sizaret, Y. Chen, E. Marcoux and J.C. Touray, Anisotropy of magnetic susceptibility (AMS) and trace chemistry: a new approach to discriminate between hydrothermal and supergene processes. Application to the Ba-Fe-F deposit of Chaillac (Indre, France). C.R.
Acad. Sci. Paris Earth Planet. Sci. 332 (2001), pp. 431–437.
30. D.J. Dunlop, Ö. Özdemir, Rock Magnetism Fundamentals and Frontiers, Cambridge University Press, 1997, pp. 74–76.
31. M.J. Dekkers, Magnetic properties of natural goethite-III. Magnetic behaviour and properties of minerals originating from goethite dehydration during thermal demagnetisation.
Geophys. J. Int. 103 (1990), pp. 233–250.
32. Ö. Özdemir and D.J. Dunlop, Intermediate magnetite formation during dehydratation of goethite. Earth Planet. Sci. Lett. 177 (2000), pp. 59–67.
33. V. Jelinek, Characterization of the magnetic fabric of the rocks. Tectonophysics 79 (1981), pp. 63–67.
34. M. Le Goff, Lissage et limites d’incertitudes des courbes de migration polaire: pondération des données et extension bivariate de la statistique Fischer. C.R. Acad. Sci. Paris 311 (1990), pp. 431–437.
35. P. Launeau and P.Y.F. Robin, Fabric analysis using the intercept method. Tectonophysiscs 267 (1996), pp. 91–119.
36. P. Launeau and A.R. Cruden, Magmatic fabric mechanisms in a syenite: results of a combined anisotropy of magmatic susceptibility and image analysis study. J. Geophys. Res. B 103 (1998), pp. 5067–5089.
37. V. Grégoire, J. Darroze, P. Gaillot, A. Nedelec and P. Launeau, Magnetite grain shape and distribution anisotropy vs. rock magnetic fabric a three-dimensional case study. J. Str. Geol. 20 (1998), pp. 937–944.
38. J.G. Ramsay, M.I. Huber, The Techniques of Modern Structural Geology, Academic Press, New York, 1993, 307 pp.
39. B. Henry, H. Rouvier, M. le Goff, D. Leach, J.C. Macquar, J. Thibieroz and M.T. Lewchuck, Paleomagnetic dating of widespread remagntization on the southeastern border of the French Massif Central and implications for fluid flow and Mississippi Valley-type mineralization. Geophys. J. Int. 145 (2001), pp. 368–380.
40. Y. Tardy, C. Roquin, Dérive des Continents Paléoclimats zt Alterations Tropicales, BRGM, Orléans, 1998, pp. 264–294.
41. H. Stollofen, Facies architecture variation and sismogenic structures in the Carboniferous-Permian Saar-Nahe Basin (SW Germany): evidence for extension-related transfer fault activity. Sediment. Geol. 119 (1998), pp. 47–83.
42. J.R.L. Allen, Sedimentary Structures: Their Character and Physical Basis, Elsevier, 1984, pp. 1–52.
43. P.E. Mathé, P. Rochette, D. Vandamme and F. Colin, Volumetric changes in weathered profiles: iso-element mass balance method questioned by magnetic fabric. Earth Planet. Sci.
![Fig. 1. Simplified geological map of the Chaillac Basin showing the AMS sampling sites (modified after [19])](https://thumb-eu.123doks.com/thumbv2/123doknet/14797772.604728/4.892.284.608.99.478/simplified-geological-chaillac-basin-showing-sampling-sites-modified.webp)


![Fig. 9. Lattice-preferred orientation for [002] pole plane corresponding to <c> axis, and AMS performed on goethite vein](https://thumb-eu.123doks.com/thumbv2/123doknet/14797772.604728/14.892.281.615.436.661/fig-lattice-preferred-orientation-plane-corresponding-performed-goethite.webp)

