Design and Implementation of Multi-asset Funds in India
By
YUVRAJ SINGH
Master of Business Administration
Imperial College London, 2010
SUBMITTED TO THE MIT SLOAN SCHOOL OF MANAGEMENT IN PARTIALREQUIREMENTS FOR THE DEGREE OF MASTER OF SCIENCE IN MANAGEMENT STUDIES
AT THE
MASSACHUSETTS INSTITUTE OF TECHNOLOGY JUNE 2011
@2011 Yuvraj Singh. All Rights Reserved.
The author hereby grants to MIT permission to reproduce and to distribute publicly paper and electronic copies of this thesis document in whole or part in any medium now known or hereafter created
Signature of the Author:
/
11
FULFILLMENT OF THE MASSACHUSETTS INSTITUTE OF TECHNOLOGYJUN 15
2011LIBRARIES
ARCHIVES
MIT Sloan School of Management May 6, 2011
Certified by:
S.P. Kothari Deputy Dean and Gordon Y. Billard Professor of Management Thesis Supervisor
Accepted by:
Michael A. Cusumano SMR Distinguished Professor of Management Program Director, M.S. in Management Studies Program MIT Sloan School of Management
Design and Implementation of Multi-asset Funds in India
By
YITVRAJ SINGH
Submitted to MIT Sloan School of Management On May 6, 2011 in Partial Fulfillment of the Requirements for the Degree of Master of Science in
Management Studies
ABSTRACT
India, over the past decade, has steadily emerged as a center of attractive investment opportimities, owing to high GDP growth rates and rising levels of per capita income. Asset management in India is going through a steady metamorphosis with rapidly growing AUM attributable to an influx of foreign investment and a steadily increasing investable surplus, albeit in the face of changing regulation. Although valuations have increased at a rapid rate, investors have been weary of high volatility and are seeking investment products that focus on risk-adjusted returns. Multi-asset investment ftnds are gaining prominence worldwide as they offer the benefits of diversification, while enabling exposure to an array of asset classes. The market for alternative investment products in India is at a nascent stage, offering tremendous potential for fund managers who can not only cater to the risk and return needs of investors, but also provide innovative and novel solutions that extend beyond the prevalent homogenous product mix to a target market in which investor literacy is progressively increasing.
This thesis provides a background of the Indian capital markets, specifically the Asset Management Industry, to deternine the key value drivers that are imperative to success and leadership in the future. A segmentation of the market is conducted to offer targeted distribution and marketing in an otherwise diverse and broad market. An analysis of the risk and return metrics of asset classes has been performed to devise model portfolios that illustrate the value added of multi-asset funds. The study also provides competitive strategies for fund managers seeking to establish and grow their business in India.
Thesis Supervisor: S.P. Kothari
Acknowledgements
Firstly, I express my deepest gratitude to my thesis supervisor, Dean S.P. Kothari for agreeing to supervise my thesis and for his invaluable help and guidance over the past few months. His advice and inentorship has enriched my experience at MIT Sloan and I thank him for all the time he has devoted to guiding me through.
I thank all my professors at MIT Sloan from whom I have learned imnmensely. I have endeavored
to apply those learning to this paper.
I thank MSMS Program Manager Chanh Phan and Program Assistant Julia Sargeaunt for their
guidance from the beginning to completion of this thesis. Their support has made my experience at MIT Sloan memorable and indeed more valuable.
I thank MSMS Program Director Professor Michael Cusumano for his oversight of the MSMS Program, an exceptional educational experience that I have been privileged to be a part of. Thank you to all my MSMS and Sloan classmates with whom I have shared this experience over the past year.
To all my friends and colleagues.
And lastly to Mom and Dad, my sisters Natasha and Tina. and my fiance Pooja for their endless love and support.
Table of Contents
List of Figures... 7 List of Tables... 9 1. Introduction... 10 . Objectives... 11 3. M ethodology... 13 3.1 Background research... 133.2 D ata acquisition, analysis and design... 14
3.3 M arket segm entation and com petitive strategy ... 15
4. Countly Analysis... 16
4.1 Background... 16
4.2 Econom ic clim ate... 17
5. Regulation ... 21
5.1 D om estic financial m arkets regulation... 21
5.2 Overseas investment regulation ... 21
5.2.1 Institutional investm ent overseas... 21
5.2.2 Individual investm ent overseas... 22
5.3 Foreign institutional investor regulation ... 22
6. The A sset M anagem ent industry ... 23
6.1 Com petitive environm ent... 23
6.2 Profitability ... 26
6.3 M arket penetration... 28
6.4 D istribution ... 30
6.4.1 Banks... 30
6.4.2 Independent Financial A dvisors... 31
6.4.3 D irect Sales... 31
6.5 Hedge finds in India... 32
7. M ajor asset classes in India... 35
7.1 Direct Equity ... 35 7.2 Insurance... 36 7.3 Fixed deposits... 38 7.4 Provident fund ... 39 7.5 M utual ftnds1... 39 7.6 Real estate... 41 7.7 Private equity ... 41 7.8 Com m odities... 42 8. Target market... 43 8.1 Investor classification... 43 8.1.1 Individual investors... 43 8.1.1.1 Retail investors... 44
8.1.1.2 H igh net w orth individuals... 45
8.1.2 Institutional investors... 48
8.1.2.1 Foreign institutional investors... 49
8.1.2.2 D om estic institutional investors... 52
8.2 Segm entation by incom e group... 53
9. M ulti-asset funds ... 55
9. 1 Itroduction to m ulti-asset ivesti g... 55
9.2 Perfonnance m etrics... 55
9.3 M ulti-asset funds in hidia... 57
10. Selected asset classes for m ulti-asset funds... 60
10.1 Benclunark... 60 10 .2 E q u ity ... 6 1 10.3 Real estate... 63 10.4 Conunodities... 64 10.5 Hedge Funds... 65 10.6 Treasuries... 67
10.7 Com parison of risk/return m etrics... 68
11. Portfolio allocation... 72
12. Com petitive strategy... 79
13. Conclusion... 85
Figure No. 4.1 4.2 4.3 4.4 6.1 6.2 6.3 6.4 6.5 6.6 6.7 6.8 7.1 7.2 7.3 7.4 7.5 7.6 7.7 7.8 7.9 8.1 8.2 8.3 8.4 8.5 8.6 8.7
List of Figures
Figure NameIndia's Gross Domestic Product
Bombay Stock Exchange Market Capitalization (% of GDP)
GDP Contributors
Inflation
No. of Asset Management Companies in India Average AUM (in USD billion)
Asset Management Industry Profitability
AMC Market Penetration
Segmented AUM of asset Management Companies (in USD billion)
AMC Distribution Channels
Eurekahedge India Hedge Fund Index (All Strategies) Comparative Performance of Indian Hedge Fund Strategies Breakdown of Direct Equity Investments
Market Cap of BSE and NSE (in USD billion) Breakdown of Insurance Assets
Life Insurance Investments Bank Deposit Interest Rates Mutual Fund Investments
Mutual Funds Percentage Share in Household Savings
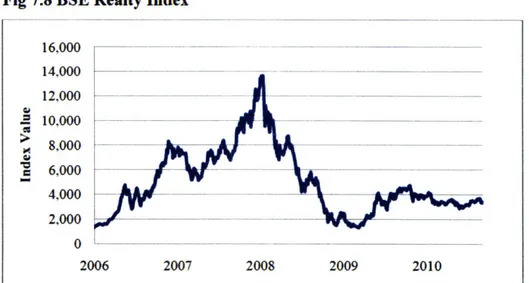
BSE Realty Index
Private Equity Investment in Indian SMEs Distribution of Individual wealth in India Composition of Household savings Indian HNI Growth (in thousands)
Asia-Pacific HNI Wealth Distribution in 2009 (in USD million) HNI Wealth Distribution
Foreign Institutional Investment
8.8 Sources of Foreign Institutional Investment in India
8.9 Distribution of Population by Income Group
9.1 Evolving Asset Allocation
10.1 BSE Sensex (Jan 2006 -Mar 2011)
10.2 NSE S&P CNX Nifty (Jan 2006 -Mar 2011)
10.3 NSE Nifty Cumulative vs. Monthly Returns
10.4 BSE Realty Index (Jan 2006 - Mar 2011)
10.5 BSE Realty Index Cumulative vs. Monthly Returns 10.6 MCX Comdex (Jan 2006 -Mar 2011)
10.7 MCX Comdex Cumulative vs. Monthly Returns
10.8 Eurekahedge India Hedge Fund Index (Jan 2006 -Mar 2011)
10.9 Eurekahedge India Index Cumulative vs. Monthly Returns
10.10 91-day T-bill Yield % (Jan 2006 -Mar 2011)
10.11 Risk/Return of Selected Asset Classes
10.12 Daily Return Volatility of Major Stock Indices
10.13 AMC Resource Mobilization and Stock Market Volatility 11.1 Graphical Representation of the OCRA
11.2 Cumulative Returns of Multi-asset Portfolio vs. Benchmark
11.3 Optimal Portfolio Risk/Reward Line 12.1 Value Proposition of Multi-asset Funds 12.2 Four Actions Framework
List of Tables
Table No. Table Name
5.1 Financial Markets Regulatory Authorities
6.1 Largest Asset Management Companies in India
6.2 Fund Offerings by AMCs
6.3 Performance Metrics of Indian Hedge Funds
8.1 Investment Preferences of Income Groups
9.1 Performance Metrics of Global Hedge Funds by Strategy
9.2 Multi-asset Funds in India
10.1 Key Statistics of Selected Asset Classes 10.2 Correlation Matrix
11.1 Key Statistics for the Optimal Portfolio (without correlation) 11.2 Key Statistics for the Optimal Portfolio (with correlation)
1. Introduction
Twenty years after liberalization, India today stands amidst the fastest growing economies of the world, supported by a rapidly growing services sector and rising export levels. India's growth story has not only caught the eye of investors worldwide, but also financial service providers who are eagerly seeking to deploy resources to gain competitive advantage through servicing the investment needs of an enormously large populace with a rapidly growing investable surplus. The tremendous potential to provide investment solutions to India's individual and institutional investor segments is further underscored by the prevalent low levels of participation in the capital markets due to a history of high volatility and stock market scams.
India's Asset management industry is transforming itself to adapt to the dynamically changing landscape of regulation and evolving client mandates. While on the one hand, there is a concerted effort by policy makers to make progressive shifts toward further liberalization, on the other, the economy is recovering from the global financial crisis. Risk-adjusted returns are the need of the hour and improving investor literacy has compelled asset management companies to rethink their product offerings from primarily equity and fixed-income strategies. to incorporate innovative solutions in order to be able to compete on product, and not on the traditional distribution and marketing.
Multi-asset funds have seen increasing demand worldwide over the past few years as investors look for solutions that provide diversification and the opportunity to capitalize on price increases across different asset classes. The Indian asset management landscape provides opportunities for multi-asset fund managers to introduce such products by catering to not only the risk and return needs of investors, but also the idiosyncrasies of a country that places high value on the attributes of trust and transparency. Now is the time to gain an early mover advantage through providing optimal solutions in the multi-asset class by devising a competitive strategy that will allow for product innovation and targeted distribution.
2. Objectives
This paper seeks to answer three questions. What is the landscape of the hidian Capital Markets, specifically the Asset Management industry? What is the market for Multi-asset funds in India? What are the best implementation strategies for Multi-asset investment products in India?
Answering these questions firstly requires a comprehensive analysis of the Indian capital markets. Section 4 provides a historical perspective and the current economic climate to give a better understanding of why India is a favored destination for financial service providers. While the key economic indicators and growth projections are important to understand the country's attractiveness, it is also important to understand the regulatory policies in effect. Section 5 details the country's regulators and key policies that drive investments within the country and overseas. Section 6 provides a detailed analysis of the Asset Management industry in India and its intrinsic characteristics, namely the competitive environment, profitability, market penetration and distribution. To understand the market for multi-asset funds and develop suitable strategies to enter the market, it is important to look at the country's Hedge Fund industry to fully weigh the possible options to create market space. Section 6 extends the Asset Management landscape to the Indian Hedge Fund industry to provide an analysis of the performance of strategies employed. Before designing products for the Indian market, it is necessary to analyze the current investment options available in the country. The purpose of section 9, which details the available asset classes, is not only to provide information on these asset classes and their popularity among Indian investors, but also to understand the possible mix that can be included in multi-asset products. Section 8 offers a segmentation of the market based on investor categorization, income groups and geographic location to enable focused marketing and distribution for each class of investors to be targeted.
Section 9 makes the case for multi-asset funds and their growing need in the current investment climate. It provides an analysis of the prevailing multi-asset funds in India, in both the Asset Management and Hedge Fund space. The section then looks at the possible market for
Designing new products requires an understanding of the expectations of Indian investors pertaining to risk and return. An analysis of the prevailing risk/return characteristics in section 10 sets forth the parameters to be targeted for new product offerings.
After gaining an understanding of the market and characteristics of asset classes., section 11 attempts to design a model optimal multi-asset portfolio, illustrating its value added over not just the benclnnark. but also all other asset classes. The five asset classes included are Equity, Real Estate., Connodities. Hedge Funds and Treasuries. Finally. section 12 presents competitive strategies to gain market share for multi-asset products and fund managers seeking to establish and grow their business in the Indian asset management landscape.
3. Methodology
To answer the questions posed in the project objectives, the methodology used in this paper is categorized into three distinct segments. An in-depth understanding of the target market is necessary to determine the characteristics that are intrinsic to the Indian capital markets. This entails a general background of the country and a more specific understanding of the industry in question. After assimilating all the facts and analyzing the relevant data pertaining to the identifiable asset classes to be included, we are able to propose sample portfolios, illustrating their value added over investments in a single asset class. Finally, strategies for distribution and implementation of multi asset funds are proposed, along with foreseen challenges.
3.1
Background Research
Firstly, a fact based approach is used to collect all relevant data to facilitate conclusions on the market for multi asset funds. Starting with a macro perspective of India's economy and the key statistics that will be drivers of the economy over the next few years. Since the advent of liberalization in the early 1990s, regulation has driven investment trends and thus research into the regulatory policies was conducted to provide a brief overview of the regulation of capital markets in the country. The next step was to conduct a detailed analysis of the Asset Management Industry in India, extending to the developing Hedge Fund Industry. Since this is the target industry for proposed entry, research conducted was not only specific to historical and projected growth, but also essential factors such as profitability, market penetration and distribution. A list of prospective distribution and branding partners is provided to enable fact based decisions on possible partnerships that are essential to product diffusion in a market where reputation and branding are of prime importance. To understand the potential market and later segment it for targeted distribution and marketing, research was conducted into the different types of investors in India, their respective investment preferences and distribution of wealth. Growth projections from various sources were collected to understand the market potential over the next few years. Before moving to the next segment pertaining to data analysis, a brief overview of multi-asset investing is provided along with the existing products and the potential to design and introduce new products that will have an early mover advantage in a market that is projected to grow rapidly.
3.2
Data Acquisition, Analysis and Design
Data was collected for the five identified asset classes, namely Equity, Real Estate, Commodities, Hedge Funds and Treasuries. To capture their intrinsic risk and return characteristics, firstly indices representing each asset class were chosen as follows:
" Benclnark - Bombay Stock Exchange Sensitive Index * Equity - National Stock Exchange S&P CNX Nifty Index
" Real Estate - Bombay Stock Exchange Realty Index
" Conunodities - Multi Conmodity Exchange Comdex
e Hedge Funds - Eurekahedge India All Strategies Hedge Fund Index
" Government Treasuries - 91-day T-bill Yield
Data on monthly returns was collected to calculate expected annualized returns and standard deviation, along with the Sharpe ratios of each asset. Calculating the Sharpe ratio is essential as many asset classes have returned exceptional returns over the past five years, however with equally high volatility. Cumulative returns were also calculated for the past five years. The BSE Realty Index and the MCX Comdex are relatively new indices and were established only in the past five years. Hence a comparison of all asset classes is perfonned for the period beginning January 2006 and ending March 2011. This time period is a good representation of the high growth experienced by all asset classes and also incorporates sharp downturns post January
2008, resulting from the global financial crisis and the recovery thereafter.
Once the key statistics of the data were calculated, the next step was to build portfolios with optimal asset allocation based on expected return and standard deviation. A model incorporating the Optimal Combination of Risky Assets (OCRA) was used to determine sample multi asset portfolios, also including the risk free asset of Government Treasuries. In deternining the allocation, it is essential to understand the relationship between the asset classes represented by the correlations of returns over the past five years. The effect of this relationship is illustrated by comparing the difference in allocations once the correlations are taken into consideration. The optimal portfolio had better returns and volatility when compared with an equal-weighted portfolio. Finally. comparing the multi asset portfolio with firstly the benchmark. and then the
other asset classes shows the value added of multi asset portfolios. The asset allocations can be dynamically altered with the changing expected return and volatility of each asset class.
Sources of primary data:
a. Thompson Reuters DataStream
b. Securities and Exchange Board of India
c. Reserve Bank of India
d. Government of India's Ministry of Finance
e. Office of the Economic Advisor
f. Bombay Stock Exchange
g. World Bank World Development Indicators
h. Confederation of Indian Industry Sources of secondary data:
a. McKinsey Global Institute
b. KPMG Research
c. IIMS DataWorks
d. Merrill Lynch Wealth Management
e. Eurekahedge
3.2
Market Segmentation and Competitive Strategy
The final section of this paper pertains to segmenting the target market and recommending breakthrough strategies for implementation. These strategies are determined taking into consideration the current state of the industry as well as projections for growth over the next few years. Distribution is crucial and the emphasis is on proposed strategic alliances. An effort is made to focus different distribution strategies for the respective market segments. A four actions framework is used to propose changes that can be made to current industry norms in order to gain a competitive positioning in the market.
4.
Country analysis
4.1
Background
From the beginning of the 1990s, India has been at the center of robust economic development, with high GDP growth rates. influx of foreign investment and governnent policy changes targeted toward liberalization. India., in the late 1980s. had seen an economic crisis resulting from a current account deficit and overvaluation of its currency. Foreign exchange reserves had decreased and the effects of rising oil prices due to the Gulf war. together with declining export levels, manifested through a balance of payments crisis reaching a critical level by mid 1991. The country's foreign exchange reserves had decreased by over 50% in June 1991, friom the
already depleted January level of $1.2 billion.1 Diminishing investor confidence and lack of
credit availability exasperated the problem and time came for drastic measures to be taken. The newly fonned Congress govenunent led by Prime Minister P.V. Narasimha Rao appointed Dr. Mamnohan Singh as the Finance Minister to establish economic reforms that collectively initiated India's economic liberalization. The priary objective of these reforms was to make progressive shifts from socialism to capitalism; from a closed to a market economy.
The effects of colonialism started to make way for an open economy and gradually, India became one of the fastest growing economies in Asia. The proverbial "Hindu Growth Rate." which stagnated between 3.2% and 3.5% in the pre-liberalization economy saw rapid increases as early as 1991 itself. While much of the world's focus on India has come over the past five years with GDP growth rates nearing double digits., the country's GDP growth from 1991 to
2006 was fourth highest of all emerging markets at 6.2%. only behind China, Vietnam and
Malaysia at 10.2%. 7.6% and 6.3% respectively.2 Since 2006., India has seen an even higher growth rate at 8.91% making the country the 11 largest economy in the world in nominal terms at $1.25 trillion and 4t largest in PPP terms at $3.25 trillion.
What Caused the 1991 Currencv Cisis in India? Cerra and Saxena. 2002 2 World Bank WDI database
Fig 4.1 India's Gross Domestic Product 1400 12 1200 10 1000----800 600 400 200 2 0 0 2001 2002 2003 2004 2005 2006 2007 2008 2009 2010
mGDP(USD billion) m GDP Growth Rate
Source: World Development Indicators (World Bank)
Economic growth, however, has not been evenly distributed across the country with states in the South and West being major beneficiaries of growth and 300 million of its 1.1 billion population still living below the poverty line.3 India's population is largely agricultural with over 60% living in rural villages.
4.2
Economic Climate
Since 1992, India has gradually emerged as one of the favored investment destinations in the world, with an increasing investment surplus and high projected growth rates. High GDP growth, stronger regulation and heightened competition between financial service providers have been the hallmark of the Indian capital markets over the past five years. GDP growth, which was at 8.6% in 2010, is projected to grow at 5.8% till 2050. Per capital income is also projected to increase from the current level of $2,932 to $20,000 by 2050.4 The average GDP growth rate has been 6.35% over the past decade and 7.6% since 2007. Stock market capitalization has grown at
14.1%, only behind Brazil and Russia at 20% and 15% respectively. Foreign Institutional
Investment inflows, which were at $244 million in 1992, increased to their highest level of $27.2
3
India: Democracy and Development. Vietor and Forrest 2009
billion in 2008, however dropping sharply in 2009. Foreign investment has also helped India increase its Forex reserves to over $303 billion (as at March 2011).5
Increasing investor participation and the influx of foreign investment has spurred the stock markets, especially since 2004, with market capitalization as a percentage of GDP increasing to a high of 108% in 2008. The single stock futures market in India is the largest in the world today.
Fig 4.2 Bombay Stock Exchange Market Capitalization (% of GDP)
120 100-80 60
40
20
,,
\1#re#
\
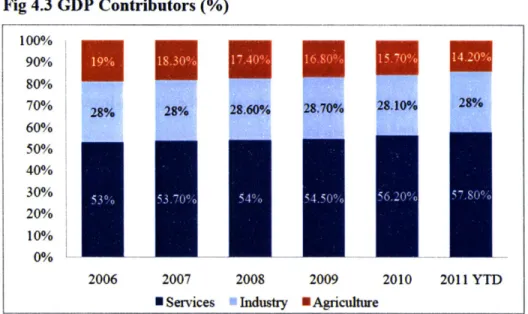
Source: SEBIThe primary driver of GDP growth has been the services sector, registering a 9.4% growth rate in
2009, significantly higher than the Manufacturing and Agricultural sectors, with 2.4% and 1.6%
growth respectively. The Services sector is the major contributor to GDP, with the sector's percentage share of GDP having increased from 53% in 2006 to 57.8% in 2011 (year-to-date). Even with the high proportion of agricultural population in the country, the share of Agriculture has been on the decline and is currently at 14.2%.
Fig 4.3 GDP Contributors (%) 100%
90%
*m
80% 70% 28% 28% 2.60% 2 28.40% 60% 50% 40% 30% E 2006 2007 2008 2009 2010 2011 YTDU Services Industry 0 Agricture
Source: Office of the Economic Advisor
Inflation continues to be a major concern in India. The widely used all-commodity Wholesale Price Index (WPI), has grown by over 45 points over the past four years (using 2006 as the base year). In the same period, Inflation, as measured by the Consumer Price Index, has almost doubled from 6.7% to 12.37% (highest in 13 years).' This rate was almost three times as high as the Reserve Bank's target rate of 4.1%. High inflation has spurred a demand for investment avenues that provide inflation beating returns.
Fig 4.4 Inflation 150 14512 140 " 135
130
- 125... 3 120 6% 115 4% 110 105 2 ___ __12% 100 % 2007 2008 2009 2010m Wholesale Price Index "Inflation Rate
Source: Office of the Economic Advisor
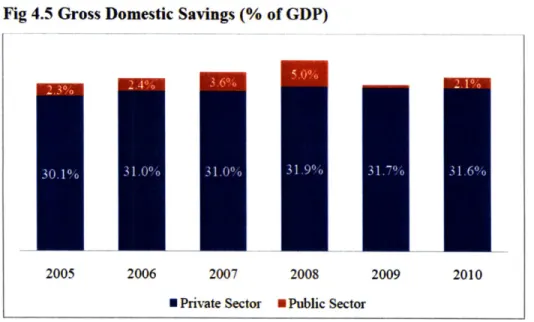
India has one of the highest savings rates in the world, mostly attributable to the private sector. Gross Domestic Savings in 2010 were at 33.7%, of which 31.6% came from the private sector. Total financial savings were at 11.8%, an increase from 10.1% in 2005. The high potential for fund managers in the Indian market is evidenced by the Saving-Investment gap, which has increased from -0.4% in 2005 to -2.8% in 2010.7
Fig 4.5 Gross Domestic Savings (% of GDP)
2005 2006 2007 2008 2009 2010
U Private Sector U Public Sector
Source: Office of the Economic Advisor
The effect of the subprime mortgage crisis on the Indian capital markets initially was positive as investors redeployed funds toward emerging markets from September 2007 to January 2008. This effect, however, was short-lived as GDP growth declined from the 9.6% high of 2008 to
5.1% in 2009. Portfolio inflows turned negative, amounting to -$13.1 billion from 2008 to 2009.
Foreign Direct Investment (FDI) remained positive even in uncertain economic conditions and grew by $35 billion in the same period, signaling investors' confidence in the Indian growth story.
Capital markets have seen improved liquidity since 2000, when short selling was first allowed by the Securities and Exchange Board of India, as well as the introduction of exchange traded derivatives in 2001. The move from fixed to rolling settlement cycles of T+2 days is cited as a significant reason for improved liquidity of the capital markets. By 2007, India had the third largest equity market in the world in terms of the number of trades executed per day.
5.
Regulation
5.1
Domestic Financial Markets Regulation
Established in 1992, the Securities and Exchange Board of India (SEBI) is the regulator of the financial markets in India. It draws its regulatory and enforcement powers from the policies set forth in the Companies Act of 1956, Securities Contracts Act of 1956 and the SEBI Act of 1992. Before the establishment of SEBI, brokerage fees and commissions were included in the security prices when reported to customers. In an effort to improve transparency, SEBI now requires all fees to be disclosed separately and securities to be delivered in a dematerialized ("demat") form. Regulatory bodies for different financial activities operate under the purview of SEBI and have direct oversight of financial market functions. The regulatory bodies are listed below.
Table 5.1 Financial Markets Regulatory Authorities
Capital Markets SEBI Securities and Exchange Board of India Asset Management AMFI Association of Mutual Funds in India
Insurance IRDA Insurance Regulatory & Development Authority
Banking RBI Reserve Bank of India
Pension Funds PFRDA Pension Fund Regulatory & Development Authority Commodities FMC Forward Markets Commission
5.2
Overseas Investment Regulation
The Reserve Bank of India (RBI) regulates the flow of investments in and out of India. It sets policies for institutional and individual investors for investing overseas.
5.2.1 Institutional Investment Overseas
Indian Asset Management Companies can invest up to $300 million or 10% of their AUM (whichever is lower) overseas. RBI has been taking measured steps to allow more flexibility to institutional investors in their investment mandates. In 2008, it increased the aggregate
investment overseas by all AMCs to $7 billion.8 However, the current level of overseas investment is much lower than the maximum allowed, at $1.5 billion. Publicly listed Indian companies on the other hand are permitted to invest up to 50% of their net worth in direct overseas portfolio investments. For Joint Ventures, this limit is much higher at 400% of the company's net worth.
5.2.2 Individual Investment Overseas
RBI has set very strict policies for individuals to invest overseas, in an effort to direct investable funds toward domestic markets. Currently, this limit for individual investors is $200,000 per person per year.9 While this limit may seem very low, it has increased significantly from the
$25,000 per person limit in 2006. Moreover, the remittance is required to be made through an
RBI authorized dealer. Investors are not allowed to remit finds for margin or margin calls under this policy. RBI also sets forth policy for income earned through investments made overseas. which is allowed to be reinvested. Dividend income from these investments is taxable in India. Short term capital gains (securities sold within 3 years) are taxed as regular income and long term capital gains are taxed at 20%.
5.3
Foreign Institutional Investor Regulation
FIs in India are regulated by SEBI and the Reserve Bank. The Foreign Exchange Management Act (FEMA) sets the policies for the flow of foreign exchange in and out of the country. FEMA was incorporated in 2000 to replace the outdated Foreign Exchange Regulation Act (FERA) of
1973. FEMA allows FIts to invest in Indian securities either directly, or through sub-accounts.
Most FIIs invest trough sub accounts that are registered with SEBI. Each sub account is permitted to invest in up to 10% of a company's paid up capital as long as the FIL including all its sub accounts, do not invest more than 24% of a company's paid up capital. Unless an FII is registered as an all-debt holding, it is required to maintain a 70:30 debt to equity ratio.
FIts that are not registered with SEBI, such as overseas hedge funds, use Participatory Notes (PNs) to invest in Indian securities. The primary purpose of PNs is to allow the investors of FIls to participate in the Indian markets.
8 RBI lets inutualfunds invest $7 billion abroad, Economic Times. April 2008 9 RBI Master Circular 2007
6.
The Asset Management Industry
6.1
Competitive Environment
India's Asset Management industry has been at the center of liberalization policies and increasing competitiveness since the mid 1990s. Success of the industry can largely be attributed to deregulation and rapid advances in the stock markets. Life Insurance Corporation (LIC) was the only dominant player in the market till the late 1990s as entry of overseas asset managers was restricted. With liberalization, the competitive landscape has changed dramatically and the
industry, as at 2010, has 41 major players.
Fig 6.1 No. of Asset Management Companies in India
41 38 33 32 35 26 9 1993 19 200 2005 2007 2009 2010
Source: CII-KPMG; AMFI
The public sector's stronghold over the industry has decreased, especially during the past five years evidenced by the decline in major public sector players from 11 to 5 since 2006 and 79% of the industry's assets under management (AUM) being held by private firms as of 2009. Even with the growth of private sector companies, the India Asset Management Industry is well behind developed countries like the US, which boasts more than 700 fund houses, and also
developing countries like China, with over 70 fund houses.10
t0
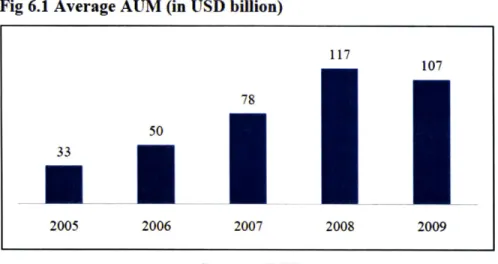
Fig 6.1 Average AUM (in USD billion) 117 107 78 2005 2006 2007 2008 2009 Source: AMFI
The industry's competitive landscape has seen major shifts over the past decade as not only has the number of major players increased, but also has the number of product offerings. Almost
75% of the cumulative AUM is held by the ten largest players and 50% held by the five largest
players. According to a study conducted by McKinsey, the Indian Asset Management industry is projected to grow at a 33% CAGR over the next five years, with the retail investor segment driving growth at an estimated 36%. While these projections may seem very high, the industry has seen an even higher growth rate of 47% from 2003 to 2008. Industry AUM is projected to increase from the 2010 level of $128 billion to $440 billion by 2015."
Table 6.1 Largest Asset Management Companies in India
Reliance Capital Asset Management Ltd. $22.68b 16%
2 HDFC Asset Management Co. Ltd. $19.53b 12%
3 ICICI Prudential asset Management Co. Ltd. $14.63b 10%
4 UTI asset Management Company Ltd. $14.53b 10%
5 Birla Sun Life Asset Management Co. Ltd. $12.82b 10%
6 SBI Funds Management Pvt. Ltd. $9.22b 5%
7 Franklin Templeton Asset Management Pvt. Ltd. $8.77b 4%
8 DSP BlackRock Investment Managers Pvt. Ltd. $6.15b 3%
9 Kotak Mahindra Asset Management Ltd. $6.13b 3%
10 Tata Asset Management Ltd. $4.63b 3%
The total number of schemes offered collectively by all Indian AMCs is approximately 160 thousand, with a major bias toward Income and Equity finds, comprising 56% and 27% of total
AUM respectively. The amount invested by Fund of Funds overseas is very low, at $560 million,
comprising only 4.4% of AUM. Table 6.2 Fund Offerings by AMCs
Income 45.24 21.25 5.46 71.95 56.2%
Euit 34.18 1.16 0.00 35.34 27.6%
Balanced 3.66 0.30.00 3.89 3.0%
Money Market 3.89 0.00 0.00 3.89 3.0%
Gilt 0.77 0.00 0.00 0.77 0.6%
Equity Linked Savin 4.60 0.64 0.00 5.24 4.1%
Gold ETF 0.83 0.00 0.00 0.83 0.6%
Other ETF 0.50 0.00 0.00 0.50 0.4%
Investing overseas 5.60 0.00 0.00 5.60 4.4%
Total 99.29 23.28 5.46 128.02 100.0%
Source: SEBI
Many major overseas asset managers are looking to gain access to the massive potential of growth in the Indian retail investor segment through acquisitions of existing AMCs with established distribution channels. Goldman Sachs Asset Management, which had received approval from SBI in 2008 to establish asset management services in India, announced on March
16, 2011 that they would acquire Benchmark AMC, which has $700 million in AUM. The
industry has also seen similar acquisitions in recent times with Religare Enterprises, one of the country's largest integrated financial services companies, acquiring Lotus India Mutual Fund in 2010 from Alexandra Fund Management and Sabre Capital,'2 and Nomura acquiring a stake in
LIC Mutual Fund. Projected industry growth is supported by increasing valuations of such
transactions, with Goldman Sachs paying 4.1% of AUM for Benchmark, significantly higher
than the 2.5% paid by Nomura.13
2 Goldman Sachs acquires Benchmark AMC - Press Trust of India,
2011
6.2
Profitability
While industry statistics such as AUM, scheme offerings and number of firms has been rising, profitability has not been able to outpace growth. The growing competitive landscape has meant that increase in costs has outstripped profitability, measured as a percentage of AUM. In 2008, industry profitability was at 14 bps, a decrease from the 24 bps level of 2004.' Regulatory pressure and heightened competition has caused AMCs to steadily lower management fees, even in the wake of increasing costs. Such a trend is changing industry dynamics where volume will be the key driver of top line growth. According to a recent BCG estimate, new entrants in India's Asset Management industry will need $2.5 billion in AUM just to break even, illustrating the downward pressure on profitability.
Competition has also obligated Asset Managers to increase their marketing and distribution efforts. Homogeneity in product offerings has shifted the onus on building brand names, with its associated sales and marketing costs. As a result, expenses as a percentage of AUM have increased to 113 bps (in 2008) from the 41 bps level of 2003.
Fig 6.3 Asset Management Industry Profitability
0.300/ 0.25% 0.20%/ 0.15% 0.10%/ 0.05% 0.000/ 2004 2005 2006 2007 2008
Profit/AUM -Admin Exp/AUM
Source: CII-KPMG
The industry saw a landmark regulation in January 2008, where the Securities and Exchange Board of India (SEBI) imposed a "no entry load" mandate on direct investment in mutual funds. The typical entry loads, averaging 2.25% across all fund houses. was a major source of revenue and profitability for AMCs industry wide. Contrary to intuition, however. cumulative earnings of all the 41 AMCs in India increase by almost 300% in 2010, notwithstanding the effects of the new regulation. Total earnings reached their highest level in 2010, at Rs. 935.6 crore (approx.
$208 million) from the 2009 level of Rs. 243.5 crore (approx. $54 million). This rise in
profitability has been attributed to fund houses making concerted efforts to decrease costs and focus on product offerings. According to Mr. A Balasubramaniam, CEO of Birla Sun Life Asset Management Co. Ltd., the country's fifth largest AMC by AUM, "profitability improvement is on asset mix change, fixed income volume and the focus on cost."'5 On average, the industry
saw a 6% decrease in costs in the same period.
AMCs have shifted focus from peripheral product offerings and turned to their core business of equity and fixed-income related products. However, it can also be argued that the increase in profitability was not related to a change in the regulatory enviromnent, but rather due to a trend of recovery from the recent global financial crisis, which had severely affected the industry in
2008 and 2009. According to Mr. S. Sikka, CEO of Reliance Capital Asset Management, the
country's largest AMC, "the profitability is nothing to do with new SEBI guidelines. In
2008-2009, PAT [Profit after taxes] was low due to slowdown. So the base was low and that reflected
increase in profitability."16
The increase in profitability, however, may be misleading as 85% of the $208 million aggregate number is attributed to the top ten players listed above. Smaller AMCs have faced the brunt of the regulatory change and are banking on AUM growth over the next 3-5 years to generate higher levels of income. Average industry operating margins declined from 33% in 2007 to 22% in 2010.'1
15 Fund houses 'profit climbs 3 times in entry load-free year. Economic T imes, 2011
1 MFs 'profits surge 300% in 2009-10 .The T imes of India. 2011
"1 Despite Profit Plunge, Asset Management Industry Remains Resilient, Donna Mitchell, Financial Planning. 2010
6.3
Market Penetration
While industry AUM has increased at very high rates and growth is projected to continue, penetration has been an issue faced by Asset Management Companies, with over 75% AUM attributed to only eight major cities. One of the primary reasons for this trend is the high cost associated with targeting low income sectors where population density is low and ticket sizes are small. In the face of heightening competition, asset management firms are looking to expand to newer and relatively untapped markets in the retail investor segment.
AUM as a percentage of Market Cap peaked in 2000 at 14.4% and decreased to a low of 7.6% in
2007. This metric can be attributed to the high growth rate of the stock markets, suggesting that
AUM has kept pace with GDP growth. Another indicator, AUM as a percentage of GDP, increased steadily from 5.3% in 2000, reaching its highest level in 2009 at 18.2%, suggesting that investors turn to mutual funds as a safer investment in times of stock market volatility, as was the case in 2009. However, these penetration levels are much lower when compared to the
US, at 79% and Brazil at 39%.18
Fig 6.4 AMC Market Penetration
20% 18.6% 18.9/ 18.2% 18% 16% 14.4% 14.4% 15.2% 15.0% 14% 13.1% 12% 11.3% 10.4% 10%/ 8% . 6% 4% 2% 2000 2005 2007 2009 2010 YTD (as of Sep)
E AUM as % of Deposits AUM as % of GDP E AUM as % of Market Cap
Source: Morningstar India
Although the top eight cities account for 15% of penetration, the overall penetration of households is very low at 3-4%. Institutional penetration, while on the increase, is also very low with 50% AUM attributed to large corporations. The Small and Medium-sized Enterprises
(SME) sector is projected to drive growth of this segment and is being targeted by many fund
managers for new business.
Industry AUM grew from $94 billion to approximately $140 billion year-on-year from 2009 to
2010. A further segmentation of the data shows that while AUM attributed to HNIs was higher in 2009, the Retail investor segment grew the most, by over 83%. The only sector that showed a
decrease in AUM was Banks, with a 6% YoY decrease. The largest sector is Corporations, which saw the AUM attributable to it increase from $47 billion to $70 billion.
Fig 6.5 Segmented AUM of Asset Management Companies (in USD billion)
160.00 -140.00 120.00 -100.00 80.00 60.00 -- - ---40.00 40.00 20.00 2009 2010
* Retail OHNI Banks Fis U Corporations
6.4
Distribution
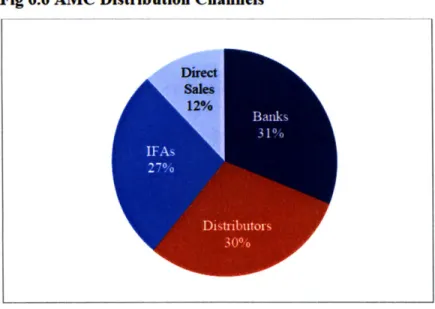
Although a large proportion of AMC business in India comes from the large cities, Asset Managers are seeking to capitalize on rising income levels and investor awareness in smaller towns and are hence relying on leveraging all available distribution channels. AUM attributed to the top 10 cities has decreased from 92% in 2005 to 80% in 2009, albeit still very high.'9 According to Anthony Heredia, CEO of Morgan Stanley Investment Management in India, "To see significant growth in rural markets we need improvements in banking services, more organized distribution, and the right infrastructure to enable cost efficient customer service. Once that happens, a larger number of asset managers will increase their focus on this area as a means to drive long term asset growth." Asset managers are seeing a tremendous potential of growth from the 18 to 59 age group, which currently comprises of 340 million individual investors. The four major distribution channels used by AMCs are Banks, Distributors, Independent Financial Advisors and Direct Sales. Although there are over 92 thousand registered mutual fund distributors in the country, they lag far behind the number of insurance agents, with the former comprising only 3.7% of the 2.5 million insurance agent base, and facing even higher competition in the wake of the SEBI regulation doing away with the typical 2.25% entry loads of mutual funds.
Fig 6.6 AMC Distribution Channels
Source: AMFI
6.4.1 Banks
Together with registered distributors, banks form the largest channels for distribution of AMC products in India. Even though Independent Financial Advisors outnumber banks in terms of personnel dedicated to selling mutual funds, banks have a much larger share of AUM, at approximately 65%. Banks carry out these functions through wealth management services to
high net worth individuals (HNIs) as well as through financial services to retail investors. While
major private sector banks such as Citi, HSBC. Kotak and ICIC have become the largest mutual fund distributors in India, public sector banks such as State Bank of India are looking to increase their focus on mutual fund distribution by establishing retail units in Tier 2 and Tier 3 cities, a market that has traditionally been overlooked by AMCs for distribution.
Due to the relatively new regulation restricting entry loads, many IFAs have turned away from selling mutual fund projects, which has made AMCs look to banks to take over the their distribution share. According to Srinivas Jain, Chief Marketing Officer of SBI Mutual Fund, "Partnering with banks is the only way to widen the reach of mutual funds in India.. .the key to success will be giving training to bank officials."20 The 20 Tier 2 cities currently contribute only
17% to industry AUM, which shows the tremendous potential for concerted distribution efforts
to penetrate this market with a trend of growing investable surplus.
6.4.2 Independent Financial Advisors (IFAs)
IFAs lead AMC distributors in the retail investor segment and account for approximately 65 thousand registered distributors. While HNIs have traditionally favored banks for their mutual fund transactions, IFAs are looking to capture market share in this high growth sector due to high ticket sizes. AMCs are looking to engage this segment of the distribution mix by building their own IFA verticals due to their growing popularity with HNIs, as they provide flexibility to investors according to their preferences.
6.4.3 Direct Sales
This final part of the distribution mix forms the smallest network in terms of AUM. Traditionally, AMCs have used direct sales very selectively, primarily in transactions with very
large ticket sizes. However, increased industry competition and the consequent downward pressure on margins have induced some AMCs to focus more on direct sales. State Bank of India, the country's largest bank, has set up over 100 points of direct acceptance across the country, with 28 investor service centers, 45 investor service desks and over 20,000 agents. Other AMCs such as Reliance Capital and HDFC are believed to be following suit.2 1
6.5
Hedge Funds in India
The Indian Hedge Fund industry is still at a developing stage, with only 60-70 fund offerings and average AUM of $70 million per fund. Regulatory pressures have historically kept fund managers from venturing in the Indian Hedge Fund landscape. However, over the past five years, the sector has gained prominence due to the rapidly growing HNI population, dynamically changing needs of institutional investors, and investors' desire to gain superior, yet risk-adjusted, returns. The industry saw its most productive period from 2005 to 2007, when AUM increased
by over 150% and number of fimds increased from 20 to over 60.22 The Eurekahedge India Hedge Fund Index, for all strategies, grew by over 100% in the same period. The Index has had an annualized return of 7.65% since inception in 1999, with an annual standard deviation of
23.7% and a Sharpe Ratio of 0.24.
Fig 6.7 Eurekahedge India Hedge Fund Index (All Strategies)
350 -300 * 250 200 150 100 0 50 1999 2000 2001 2002 2003 2004 2005 2006 2007 2008 2009 2010 Source: Eurekahedge
21 Evolvng Distribution Strategies;
reaching out to retail investors, FPSB, Syed Shahbubdin
Indian hedge funds faced a turbulent period in 2008, where AUM decreased significantly due to losses and a flight to safety by investors. Indian hedge funds had to bear the brunt of the recent financial crisis, with a sharp AUM decline of 70% in 2008 and the Hedge Fund Index registering net returns of negative 50%. Traditionally, Indian hedge funds garnered high returns by investing in Indian mid-caps that saw a bull-run until 2008. These mid-caps were the worst perfonners when the equity markets dropped sharply in 2008, hence causing hedge fund returns to consequently drop as well. However, there was a steep reversal in 2009, with average returns of 53.6%. 2010 saw a reversal in this trend and Indian hedge funds posted the best returns globally, at 4.6%. The Indian equity markets grew only 2% in the same period. Moreover, 2011 has already seen tremendous inflows into the Indian hedge fund space, with industry growth estimated at 30% by Eurekahedge. A major reason for this surge has been the buoyant stock market, as a majority of funds are equity focused. In fact, 68% of Indian hedge funds employ long-short strategies with an overwhehning 70% equity focus.23 The total industry AUM is
currently estimated at $5 billion.2 4
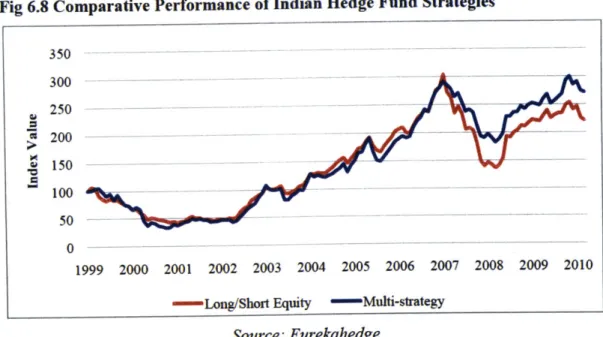
The industry is currently at a transitional phase, with many fund managers shifting their mandate from a primarily equity focus to multi strategy funds, which have increased their market share from 10 to 20%, while equity only funds have seen a decline in market share by over 15%. Asset classes such as Commodities, Fixed-income and Gold are gaining prominence in the portfolios of many fund managers as a more risk-centric approach has become the need of the hour. Hedge funds in Iidia piiiariy employ strategies, namely Long/Short Equity and Multi Strategy. The Long/Short Equity index comprises 22 constituents while the Multi-strategy index comprises 6 constituents.
23 India focused hedge
fuinds ranked among world's best performers, Economic Times, 2010
14 The flip-flop story of Indian hedge funds, International Business Times,
Fig 6.8 Comparative Performance of Indian
Hedge Fund Strategies
350 300 250 200 150 100 50 0 -- -1999 2000 2001 2002 2003 2004 2005 2006 2007 2008 2009 2010
- Long/Short Equity -Muti-strategy
Source: Eurekahedge
Multi-strategy finds have historically performed
better than Long/short Equity funds with a
9.37% annualized return compared to 7.36% for
the latter. However, they have also returned a higher standard deviation of 26.26% when compared
to 22.49% for Long/Short Equity. A comparison of the Sharpe Ratios shows that Multi-Strategy
funds have shown higher
risk-adjusted returns, with a higher Sharpe Ratio
of 0.28. 2010 was a year of positive returns, with
multi-strategy funds showing the best performance with
annialized return of 15.35%. 2011, on
the other hand, has not begun as well for Indian
hedge funds as all strategies have thus far shown negative returns, with Multi-strategy once again outperforming
Long/short Equity.
Table 6.3 Performance Metrics of Indian Hedge Funds
Annualized Return (%) 7.36
9.37 7.65
Best Monthly Return (%) 25.34
16.8 25.35
Worst Monthly Return (%) -18.09
-31.76 -19.18
2010 Return (%) 10.71
15.35 13.1
2011 Return (%) -10.27
-6.58 -9.84
Rise in NAV Since Inception Date 121.03
171.77 127.84 Last 3 Months (%) -8.2 -4.75 -7.18 Sharpe Ratio 0.24 0.28 0.24 Annualized Std Deviation (%) 22.49 26.26 23.7
Percentage of Positive Months (%) 58.21
61.19 58.21 Source: Eurekahedge
7. Major Asset Classes in India
To analyze the trends in investment strategies in India, as well as the changing demands of investors over time, we take a look at the major asset classes that are available to Indian investors. The profiles of these asset classes not only gives a better understanding of the capital markets and savings trends, but also enables fund managers to determine the asset classes that may be included in multi-asset products. Following are the major asset classes available in India.
7.1
Direct Equity
The recent boom in the Indian stock markets has prompted many investors, who traditionally preferred to stay away from the stock markets, to direct an increasing proportion of their investable funds toward direct equity investments. As at March 2010, the cumulative total invested in Direct Equities was approximately $1.3 trillion. However, retail investors only contributed 9.7% of this amount, with domestic and foreign institutional investors contributing over 62%. Total individual wealth contribution to Direct Equity investments was 31% of the cumulative individual wealth in the country.
Fig 7.1 Breakdown of Direct Equity Investments
Most of the Direct Equity investment is done through the 23 stock exchanges in India. The Bombay Stock Exchange (BSE) and National Stock Exchange (NSE) are most actively traded. The three largest sectors of investment are IT, Financial and Energy. Currently, the BSE has over four thousand listings, which is more than any stock exchange in the US. The market cap of BSE saw tremendous growth from 2001 to 2008, increasing from approximately $100 billion to $1.5 trillion, with a sharp decline in 2009 due to adverse market conditions.
Fig 7.2 Market Cap of BSE and NSE (in USD billion)
1,800 1,600 1.400 1,200 1,000 BSE 800 NSE 600 400 200 g BS 0 Source: SEBI
7.2
Insurance
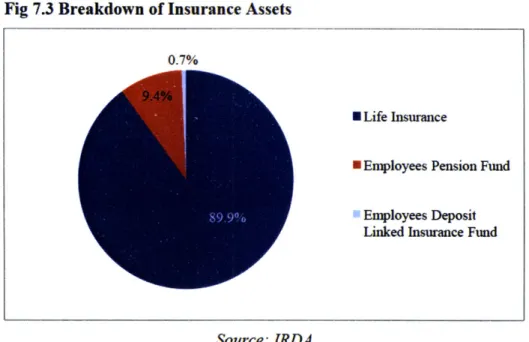
Life insurance products have the highest penetration among all investment options in India.25 The major reason for this is the low risk profile, together with tax benefits provided to Life Insurance investors. Life Insurance is categorized in to the Public and Private sectors. Life Insurance Corporation (LIC) is the only public insurer and the largest asset manager in the country, accounting for 71% of the $220 billion insurance industry AUM. There are 21 major private sector players that account for the other 29% AUM. The industry was dominated by LIC up until 2000 and the private players have only emerged in the past 10 years. Approximately $40 billion of premiums are invested in the equity markets through Unit Linked Insurance Plans (ULIPs).
India's insurance industry is projected to grow at 15-20% per year over the next five years.2 LIC itself saw a 32% rise in AUM in 2009.
Fig 7.3 Breakdown of Insurance Assets
Source: IRDA
The large proportion of investments by life insurers are in central government securities, at 43%. Other major investment avenues are state government securities and infrastructure investments.
Fig 7.4 Life Insurance Investments
U Central Govt. * State Govt. * Infrastructure U Approved Inv. *Other Source: IRDA 2 6 McKinsey Research 2 7
Life Insurance Corporation of India says assets rise 32 percent to S250 billion, Bloomberg, 2010 0.7%
* Life Insurance
* Employees Pension Fund
Employees Deposit Linked Insurance Fund
7.3
Fixed Deposits
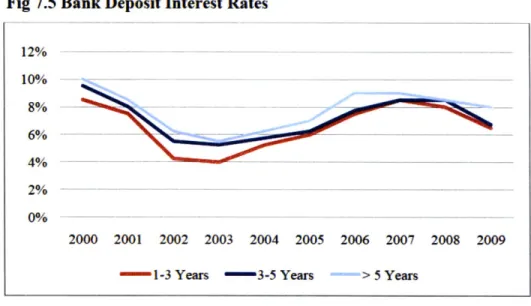
This investment avenue, due to its safety feature, has always comprised of a large proportion of investor savings. They are extremely popular with the Retail investor segment as they carry an insurance from the Deposit Insurance and Credit Guarantee Corporation for up to Rs. 100, 000 (approximately $2,100). Deposits are made at fixed interest rates and maturities, which may last from fifteen days to ten years. Investors have the option to choose between Bank Fixed Deposits and Corporate Fixed Deposits. 50% of all household savings in India are in Fixed Deposits and over 80% of all urban households invest in them. They form a major source of competition for other asset classes as the prevailing high interest rates make them even more attractive for investors looking for capital preservation.
Fig 7.5 Bank Deposit Interest Rates
12% 10% 8% 6% 4% 2% 0%-2000 2001 2002 2003 2004 2005 2006 2007 2008 2009
1-3 Years - 3-5 Years > 5 Years
Source: Thompson Reuters DataStream
While interest rates vary from one bank to the other and from one corporation to the other, the average interest rate for a five year deposit currently is 8% per year. Interest is treated as ordinary income for the purpose of taxation. Fixed deposits are overwhelmingly dominated by bank deposits, with cumulative funds of approximately $850 billion as of 2010, as compared to
7.4
Provident Fund
Provident funds are used for the dual purpose of tax savings and capital preservation. The two types of Provident Funds available are Public Provident Fund (PPF) and Employee Provident Fund (EPF). PPFs are voluntary investments with the central government and pay a fixed 8% interest rate with a 15 year maturity. On the other hand, EPFs form a retirement planning tool available to workers in which employers contribute a certain percentage to the investment pool. Since PPFs are voluntary, their total contribution is much lower, at 25% of the total $47 billion AUM.2 8 The biggest contributors to PPF investments are the middle-income segment (with
annual income between $1,100 and $4,200), accounting for over half of the total AUM. The higher income groups have traditionally invested a very small percentage of their investable surplus in PPFs.
Fig 7.6 Public Provident Fund Investments by Income Group
2>$10,800 N $4,200 - $10,800 N $2,100 -$4,200 ES1,100 - $2,100 <$1,100 Source: SEBI
7.5
Mutual Funds
Mutual Funds have seen high growth rates and increasing penetration over the past five years. Much of this growth is attributed to increasing income levels and growth of the stock markets. Industry AUM had increased at a 29% CAGR from 2004 to 2008, increasing to $114 billion in
2007 before a decline in 2008. Current AUM is approximately $154 billion. HNIs and retail
investors hold approximately 45% of AUM, with institutional investors and corporate accounting
2
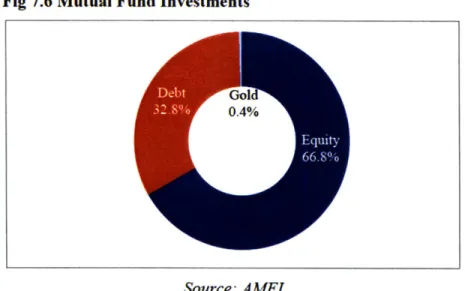
for the other 55%. Mutual funds have traditionally invested in three major asset classes, namely Equity, Debt and Gold, typically with a focus on a single asset class. Some Asset Management Companies are looking to gain exposure to other asset classes such as ETFs, Commodities and Real Estate with New Fund Offerings (NFOs) in the pipeline.
Fig 7.6 Mutual Fund Investments
Source: AMFI
The share of household savings in mutual fund AUM has been increasing, from the 1.2% level in
2005 to 7.7% in 2009, as retail investors and HNIs seek to gain exposure to the capital markets
through new fund offerings. Although AUM and contributions have increased at high rates, India' share in the global mutual fund industry is at a mere 0.32%, illustrating the potential for further growth.30
Fig 7.7 Mutual Funds Percentage Share in Household Savings
Source: CII-KPMG Confederation of Indian Industry
3 Association of Mutual Funds in India and KPMG research
7.7% 4.8% 3.8%