Measurement of inclusive jet and dijet cross sections in
proton-proton collisions at 7 TeV centre-of-mass energy with the
ATLAS detector
The ATLAS Collaboration
October 15, 2018
Abstract. Jet cross sections have been measured for the first time in proton-proton collisions at a centre-of-mass energy of 7 TeV using the ATLAS detector. The measurement uses an integrated luminosity of
17 nb−1 recorded at the Large Hadron Collider. The anti-kt algorithm is used to identify jets, with two
jet resolution parameters, R = 0.4 and 0.6. The dominant uncertainty comes from the jet energy scale, which is determined to within 7% for central jets above 60 GeV transverse momentum. Inclusive single-jet differential cross sections are presented as functions of jet transverse momentum and rapidity. Dijet cross sections are presented as functions of dijet mass and the angular variable χ. The results are compared to expectations based on next-to-leading-order QCD, which agree with the data, providing a validation of the theory in a new kinematic regime.
1 Introduction
At the Large Hadron Collider (LHC), jet production is the dominant high transverse-momentum (pT) process and as
such gives the first glimpse of physics at the TeV scale. Jet cross sections and properties are key observables in high-energy particle physics. They have been measured at e+e−, ep, p¯p, and pp colliders, as well as in γp and
γγ collisions. They have provided precise measurements of the strong coupling constant, have been used to obtain information about the structure of the proton and photon, and have become important tools for understanding the strong interaction and searching for physics beyond the Standard Model (see, for example, [1]). Searches for new physics using jets in 7 TeV collisions were recently pub-lished [2]. In this paper, we present the first measurements of inclusive single-jet and dijet cross sections using the AT-LAS detector. The measurements are performed using a data set taken early in LHC running, from 30 March to 5 June 2010, corresponding to an integrated luminosity of 17 nb−1. The measurement involves a determination of the trigger and reconstruction efficiencies of ATLAS for jets, as well as a first determination of the calorimeter response to jet energy.
The paper is organised as follows. The detector is de-scribed in the next section, followed by the definition of the cross sections to be measured (Section 3), a discus-sion of the simulations used in the measurement (Sec-tion 4) and the theoretical predic(Sec-tions to which the data are compared (Section 5). The evaluation of the trigger efficiency is given in Section 6. The following two sections (Sections 7 and 8) describe the evaluation of the main un-certainty in the measurement, coming from the jet energy
scale. The event selection and data correction are then described (Sections 9 and 10), followed by the results and conclusions.
2 The ATLAS Detector
The ATLAS detector covers almost the entire solid angle around the collision point with layers of tracking detectors, calorimeters, and muon chambers. For the measurements presented in this paper, the inner detector, the calorime-ters, and the trigger are of particular importance. These components, and the rest of the detector, are described in detail elsewhere [3].
The inner detector has full coverage in φ and covers the pseudorapidity1 range |η| < 2.5. It consists of a sil-icon pixel detector, a silsil-icon microstrip detector, and a transition radiation tracker, all immersed in a 2 T mag-netic field. These tracking detectors are used to recon-struct tracks and vertices, including the primary vertex.
High granularity liquid-argon (LAr) electromagnetic sampling calorimeters, with excellent energy and position resolution, cover the pseudorapidity range |η| < 3.2 (the barrel covers |η| < 1.475 and the two end-caps cover
1
Pseudorapidity is defined as η = − ln(tan(θ/2)). The AT-LAS reference system is a Cartesian right-handed coordinate system, with the nominal collision point at the origin. The anti-clockwise beam direction defines the positive z-axis, while the positive x-axis is defined as pointing from the collision point to the centre of the LHC ring and the positive y-axis points upwards. The azimuthal angle φ is measured around the beam axis, and the polar angle θ is measured with respect to the z-axis.
1.375 < |η| < 3.2). The hadronic calorimetry in the range |η| < 1.7 is provided by a scintillating-tile calorimeter, which is separated into a large barrel (|η| < 1.0) and two smaller extended barrel cylinders, one on either side of the central barrel (0.8 < |η| < 1.7). In the end-caps (|η| > 1.5), LAr hadronic calorimeters match the outer |η| limits of the end-cap electromagnetic calorimeters. The LAr forward calorimeters provide both electromagnetic and hadronic energy measurements, and extend the cov-erage to |η| < 4.9.
The trigger system uses three consecutive trigger levels to select signal and reject background events. The Level-1 (L1) trigger is based on custom-built hardware to process the incoming data with a fixed latency of 2.5 µs. This is the only trigger level used in this analysis. In order to commission the trigger software, the higher level triggers also recorded decisions on events, but these decisions were not applied to reject any data. The events in this analy-sis were accepted either by the system of minimum-bias trigger scintillators (MBTS) or by the calorimeter trigger. The MBTS detector [4] consists of 32 scintillator coun-ters that are each 2 cm thick, which are organised into two disks with one on each side of the ATLAS detector. The scintillators are installed on the inner face of the end-cap calorimeter cryostats at z = ±356 cm such that the disk surface is perpendicular to the beam direction. This leads to a coverage of 2.09 < |η| < 3.84. The MBTS multiplic-ity is calculated for each side independently, and allows events containing jets to be triggered with high efficiency and negligible bias.
The L1 calorimeter trigger uses coarse detector in-formation to identify the position of interesting physics objects above a given energy threshold. The ATLAS jet trigger is based on the selection of jets according to their transverse energy, ET. The L1 jet reconstruction uses
so-called jet elements, which are formed from the electro-magnetic and hadronic calorimeters with a granularity of ∆φ × ∆η = 0.2 × 0.2 for |η| < 3.2. The jet finding is based on a sliding window algorithm with steps of one jet element, and the jet ET is computed in a window of
configurable size around the jet.
Recorded events are fully reconstructed offline, using object-oriented analysis software running on a distributed computing grid.
3 Cross Section Definition
Jets are identified using the anti-kt jet algorithm [5]
im-plemented in the FastJet [6] package. This algorithm constructs, for each input object (e.g. a parton, particle or energy cluster) i, the quantities dij and diB as follows:
dij = min(kti−2, k −2 tj ) (∆R)2 ij R2 , (1) diB = kti−2, (2) where (∆R)2ij = (yi− yj)2+ (φi− φj)2, (3)
kti is the transverse momentum of object i with respect
to the beam direction, φi is its azimuthal angle, and yi
is its rapidity, defined as y = 12ln[(E + pz)/(E − pz)],
where E denotes the energy and pz is the component of
the momentum along the beam direction. A list containing all the dijand diBvalues is compiled. If the smallest entry
is a dij, objects i and j are combined (their four-vectors
are added) and the list is updated. If the smallest entry is a diB, this object is considered a complete “jet” and is
removed from the list. As defined above, dij is a distance
measure between two objects, and diBis a similar distance
between the object and the beam. Thus the variable R is a resolution parameter which sets the relative distance at which jets are resolved from each other as compared to the beam. In this analysis, two different values for the R parameter are chosen: R = 0.4 and R = 0.6; using two values allows comparison to QCD calculations subject to rather different soft (non-perturbative) QCD corrections. The anti-kt algorithm is well-motivated since it can be
implemented in next-to-leading-order (NLO) perturbative QCD (pQCD) calculations, is infrared-safe to all orders, and produces geometrically well-defined (“cone-like”) jets. The jet cross section measurements are corrected for all experimental effects, and so refer to the ideal “truth” final-state of a proton-proton collision (see, for example [7]), where jets are built from stable particles, i.e. those with a proper lifetime longer than 10 ps. This definition includes muons and neutrinos from decaying hadrons.
Inclusive single-jet double-differential cross sections are measured as a function of jet pT and y for all jets in the
kinematic region pT > 60 GeV, |y| < 2.8. This ensures
that jets lie well within the high efficiency plateau region for the triggers used, as described in Section 6, and that the jets are in a region where the jet energy scale is well understood, as described in Section 7.
The dijet double-differential cross section is measured as a function of the invariant mass of the dijet system, m12, binned in the maximum rapidity of the two leading
(i.e. highest pT) jets, |y|max = max(|y1|, |y2|). It is also
measured as a function of the angular variable
χ = exp(|y1− y2|) ≈
1 + cos θ∗
1 − cos θ∗ (4)
binned in the dijet mass m12. Here the subscripts 1,2 label
the highest and second highest pTjet in the event within
|y| < 2.8, respectively, and θ∗ is the polar scattering angle
of the outgoing jets in the dijet centre-of-mass frame. The approximation in the expression is exact for massless jets perfectly balanced in pT. The leading jet is required to
lie in the pT, |y| kinematic region defined above. The
sub-leading jet is required to lie in the same rapidity region and to have pT > 30 GeV, which ensures that both the
jet reconstruction efficiency and purity2 are above 99%. This cut is also important to limit misidentification of the subleading jet due to less precise jet energy resolution for
2
The efficiency and purity were determined using Monte Carlo with a requirement that truth and reconstructed jets match to within ∆R = 0.3.
pT< 30 GeV (see Section 10). Allowing for some
imbal-ance in the pTof the two jets improves the stability of the
NLO calculation [8].
The dijet mass is plotted in the allowed rapidity re-gion only above the minimum mass where it is no longer biased by the pTand rapidity cuts on the two leading jets.
The minimum unbiased mass depends on the |y|max bin,
which determines the maximum opening angle in rapid-ity allowed. The biased spectrum below this mass is not measured due to its particular sensitivity to the jet energy scale uncertainty through the jet pTcut.
The variable χ is plotted up to a maximum of 30, re-stricting the angular separation in rapidity to |y1− y2| <
ln(30). In the rotated coordinate system (y∗, yboost), where
y∗= 0.5 · (y1− y2), and yboost= 0.5 · (y1+ y2) is the boost
of the dijet system with respect to the laboratory frame, this restricts the acceptance to |y∗| < 0.5 ln(30). An or-thogonal acceptance cut |yboost| < 1.1 is then made on the
χ distribution in order to reject events in which both jets are boosted into the forward or backward direction. This reduces the sensitivity to parton density function (PDF) uncertainties at low x, where x is the fraction of the mo-mentum of the proton carried by the parton participating in the hard scattering, and in turn enhances sensitivity to differences that could arise from deviations from the matrix element predictions of pQCD. The χ spectrum is plotted only in mass bins above the minimum unbiased mass.
The kinematic constraints mean that the region of x probed by these measurements varies in the approximate range 5 × 10⁻⁴ < x < 0.4 for the inclusive jet measure-ments, and 1.4 × 10⁻² < x < 0.3 for the dijet measure-ments.
4 Monte Carlo Samples
Samples of simulated jet events in proton-proton colli-sions at √s = 7 TeV were produced using several Monte Carlo (MC) generators. The Pythia 6.421 [9] event gen-erator is used for the baseline comparisons and correc-tions. It implements leading-order (LO) pQCD matrix el-ements for 2 → 2 processes, pT-ordered parton showers
calculated in a leading-logarithmic approximation, an un-derlying event3 simulation using multiple-parton
interac-tions, and uses the Lund string model for hadronisation. For studies of systematic uncertainties, jet samples were produced using the Herwig 6 [10] generator, which also employs LO pQCD matrix elements, but uses an angle-ordered parton shower model and a cluster hadronisation model. The underlying event for the Herwig 6 samples is generated using the Jimmy [11] package using multiple-parton interactions. The Herwig++ [12], Alpgen [13], and Sherpa [14] programmes were also used for various cross-checks. The samples are QCD 2 → 2 scattering sam-ples created using a tuned set of parameters denoted as
3
The term underlying event is used to mean particles pro-duced in the same proton-proton collision, but not originating from the primary hard partonic scatter or its products.
ATLAS MC09 [15] with the MRST2007LO [16, 17] mod-ified leading-order PDFs, unless stated otherwise.
The generated samples are passed through a full sim-ulation [18] of the ATLAS detector and trigger based on Geant4 [19]. The Quark Gluon String model [20] was used for the fragmentation of the nucleus, and the Bertini cascade model [21] for the description of the interactions of the hadrons in the medium of the nucleus. The param-eters used in Geant4 are described in more detail else-where [22]. Test-beam measurements for single pions have shown that these simulation settings best describe the re-sponse and resolution in the barrel [23] and end-cap [24] calorimeters.
Finally, the events are reconstructed and selected using the same analysis chain as for the data with the same trigger, event selection, and jet selection criteria.
5 Theoretical Predictions
Several NLO pQCD calculations are available for jet pro-duction in proton-proton collisions. NLOJET++ 4.1.2 [25] was used to calculate the QCD 2 → 2 scattering process at NLO for comparison with data. JETRAD [26] was used for cross-checks. The CTEQ 6.6 [27] NLO parton densi-ties were used for the central value and uncertaindensi-ties, and the MSTW 2008 [16], NNPDF 2.0 [28] and HERAPDF 1.0 [29] parton density sets were used as cross-checks. The default renormalisation and factorisation scales (µR and
µF respectively) were defined to be equal to the pTof the
leading jet in the event. To estimate the potential impact of higher order terms not included in the calculation, µR
was varied from half to twice the default scale. To esti-mate the impact of the choice of the scale at which the PDF evolution is separated from the matrix element, µF
was similarly varied. These two scales were varied indepen-dently apart from a constraint that the ratio of the two scales be between 1/2 and 2, applied to avoid introducing large logarithms of the ratio of the scales. In addition, the effect of the uncertainty in the strong coupling constant, αs(MZ), was estimated by calculating the cross section
using αs(MZ) values within the uncertainty range, and
using PDFs fitted using these values. To efficiently calcu-late all these uncertainties, the Applgrid [30] program was used.
The NLO calculations predict partonic cross sections, which are unmeasurable. For comparison with data at the particle level, soft (non-perturbative) corrections must be applied. This was done using leading-logarithmic parton shower Monte Carlo programs, by evaluating the ratio of the cross section before and after hadronisation and under-lying event simulation and dividing the NLO theory distri-butions by this factor. The Pythia 6 and Herwig 6 mod-els described above were used, as well as a variety of alter-native tunes of Pythia 6 [31,32] as a cross-check. The cen-tral value used is that from the Pythia 6 MC09 sample, and the uncertainty is estimated as the maximum spread of the other models investigated. To calculate the parti-cle and parton-level theory distributions, the Rivet [33]
package was used. The soft QCD corrections depend sig-nificantly on the value of R (0.4 or 0.6), since wider jets are affected more by the underlying event, whereas narrower jets are more likely to lose particles due to hadronisation. The size of these effects, and their dependence on jet size, increases with decreasing pT. The corrections are within
5% of unity over most of the kinematic region, but drop to -10% for the lowest pT jets with R = 0.4, and rise to
about 15% for the lowest pT jets with R = 0.6.
6 Trigger Efficiency
The MBTS 1 trigger, which requires a single MBTS counter over threshold, was operational in the early data-taking period. It was used to trigger approximately 2% of the integrated luminosity of the data sample analysed. It has negligible inefficiency (as measured in randomly triggered events [4]) for the events considered in this analysis, which all contain several charged tracks. As the instantaneous luminosity increased, this trigger had a large prescale fac-tor applied. Consequently subsequent events – comprising approximately 98% of the data sample studied – were trig-gered by the jet trigger.
The lowest threshold L1 jet trigger, which is used in this analysis, employs a 0.4 × 0.4 window size in η − φ and requires a jet with pT > 5 GeV at the electromagnetic
scale (see Section 7). The inclusive jet trigger efficiency was measured with respect to the MBTS 1 trigger, which provides an unbiased reference as described above. Its effi-ciency is shown as a function of the final reconstructed pT
for single jets (R = 0.4 and 0.6) in Fig. 1. The efficiency is compared to that predicted from MC simulation, demon-strating that the modelling of the trigger efficiency curve is good. The trigger efficiency for jets with pT> 60 GeV
and |y| < 2.8 is above 99%. All events considered here contain at least one jet in this region.
7 Jet Energy Scale Calibration
The input objects to the jet algorithm in the data and in the detector-level simulation are topological energy clus-ters in the calorimeter [34]. These clusclus-ters are seeded by calorimeter cells with energy |Ecell| > 4σ above the noise,
where σ is the RMS of the noise. All directly neighbouring cells are added, then neighbours of neighbours are itera-tively added for all cells with signals above a secondary threshold |Ecell| > 2σ. Finally the energy in all further
im-mediate neighbours is added. Clusters are split or merged based on the position of local minima and maxima. The cell energies are summed to give the cluster energy, and the clusters are treated as massless. The baseline calibra-tion for these clusters corrects their energy to the elec-tromagnetic (EM) scale. The EM scale is established us-ing test-beam measurements for electrons and muons in the electromagnetic and hadronic calorimeters [35–37]. It provides a good estimate of the energy deposited in the
[GeV]
Tp
0
50
100
150
200
250
300
L1 Efficiency
0
0.2
0.4
0.6
0.8
1
1.2
Data PYTHIA 6 Data PYTHIA 6ATLAS
-1 dt = 7 nb L∫
= 7 TeV, s | < 2.8 y = 0.4, | R jets, t anti-k[GeV]
Tp
0
50
100
150
200
250
300
L1 Efficiency
0
0.2
0.4
0.6
0.8
1
1.2
[GeV]
Tp
0
50
100
150
200
250
300
L1 Efficiency
0
0.2
0.4
0.6
0.8
1
1.2
Data PYTHIA 6 Data PYTHIA 6ATLAS
-1 dt = 7 nb L∫
= 7 TeV, s | < 2.8 y = 0.6, | R jets, t anti-k[GeV]
Tp
0
50
100
150
200
250
300
L1 Efficiency
0
0.2
0.4
0.6
0.8
1
1.2
Fig. 1. Inclusive-jet L1 trigger efficiency as a function of
re-constructed jet pTfor jets identified using the anti-ktalgorithm
with (upper) R = 0.4 and (lower) R = 0.6.
calorimeter by photons and electrons, but does not cor-rect for detector effects on the calorimeter measurement, including:
– calorimeter non-compensation (the ATLAS calorime-ters’ response to hadrons is lower than their response to electrons of the same energy),
– energy losses in inactive regions of the detector (“dead material”),
– particles for which the shower is not totally contained in the calorimeter.
In addition, the baseline calibration does not correct for: – particles that are clustered into the truth jet but for
which the corresponding cluster is not in the recon-structed jet,
– inefficiencies in energy clustering and jet reconstruc-tion.
After a jet is identified, its energy is calibrated to account for these effects, as follows.
The jet energy calibration is carried out in 45 bins of η as a function of pT and is based upon MC simulation.
The simulation has been validated using test-beam and collision data. Jets with pseudorapidity up to 1.2 are con-sidered central, while jets with 1.2 < |η| < 2.8 belong to the end-cap region4.
The jet energy scale (JES) is obtained using recon-structed calorimeter jets matched to MC particle jets (truth jets, but excluding muons and neutrinos) within a cone of ∆R = 0.3. Each jet is required to be isolated, such that there are no other jets with pT> 7 GeV within
a cone of 2.5 × R around the jet axis. The distribution of the response of the calorimeter jets matched with MC particle-level jets, in bins of particle-level jet pTand η, is
used to determine the average jet energy response as the mean value of a Gaussian fit.
The correction is obtained by evaluating the transfer function between the energy of the particle-level and EM scale jets, inverting it, and refitting the resulting distri-bution in bins of reconstructed pT to obtain a correction
which can be applied in such bins. The JES correction is shown in Fig. 2 as a function of the jet pTat the EM scale,
for anti-ktjets with R = 0.6, for two of the rapidity bins.
The size of the overall correction to the pTof the jets is
below 75%, and for central jets with pT > 60 GeV it is
below 50%.
8 Uncertainty on the Jet Energy Scale
The JES systematic uncertainty is derived combining in-formation from test-beam data, LHC collision data and MC simulations.
The pseudorapidity bins used for the estimate of the jet energy scale uncertainty divide the detector in five |η| re-gions with boundaries at 0.0, 0.3, 0.8, 1.2, 2.1 and 2.8. This binning closely matches the binning in y used in the final cross section measurement, which follows the calorimeter geometry5.
Only jets with a particle-level jet pT> 20 GeV, and a
measured pT> 10 GeV after calibration, are considered.
No isolation requirement is imposed in the evaluation of the uncertainty in the JES.
4
The end-cap region includes the transition in the ATLAS detector between the barrel and the end-cap, which needs spe-cial treatment because of its geometry and material composi-tion.
5
For massless objects, rapidity and pseudorapidity are iden-tical. [GeV] EM T p 20 30 40 102 2×10² 103 A v e ra g e J E S c o rr e c ti o n 1.1 1.2 1.3 1.4 1.5 1.6 1.7 1.8 | < 0.8 η 0.3 < | | < 2.8 η 2.1 < | PYTHIA 6
ATLAS
=0.6 R jets, t anti-kFig. 2. Average jet energy scale correction, evaluated using Pythia 6, as a function of jet transverse momentum at the EM scale for jets in the central barrel (black circles) and
end-cap (red triangles) regions, shown in EM scale pT bins and η
regions.
8.1 Experimental Conditions and Calibration Method Several sources of uncertainty related to the detector and experimental conditions have been considered:
– Material and Geometry The effect of additional dead material on the jet energy scale has been eval-uated with a dedicated geometry model in the simula-tion, which includes the presence of additional material in front of the barrel calorimeters. Test-beam measure-ments [38] and comparisons of 900 GeV data to simula-tions [39] have been used to conservatively estimate the largest possible change in the amount of material. The contribution to the JES uncertainty from this source is around 2% of the jet energy.
– Noise Thresholds The uncertainty on the JES due to possible discrepancies between data and the descrip-tion of the calorimeter electronic noise in the Monte Carlo was evaluated using MC simulation samples re-constructed with signal-to-noise thresholds for topo-logical cluster seeds and cell neighbours modified to be 10% higher and 10% lower than their nominal values. The stability observed in the noise in special monitor-ing runs where calorimeter signals were studied in the absence of genuine signals, and the comparison of the noise distribution between data and MC simulation, indicate that this 10% variation provides a conserva-tive estimate of the uncertainty on the noise descrip-tion. The maximum contribution to the JES from this source occurs at low jet pT values, where it is around
3% of the jet energy.
– Beamspot The jet reconstruction for the JES calibra-tion uses (x, y, z) = (0, 0, 0) as a reference to calculate the direction and pT of the input jet constituents. If
the beamspot is shifted with respect to this position, and if this shift is not correctly modelled, the jet pT
could be biased. The variation of the JES from differ-ences in the beamspot position between data and MC
simulation is evaluated using a sample generated with a shifted beamspot of (x, y, z) = (1.5, 2.5, −9) mm. This shift covers the shift in the current average coor-dinates observed from data collected by ATLAS from LHC collisions: (x, y, z) = (−0.4, 0.62, −1.3) mm. The contribution to the JES uncertainty is below 1% of the jet energy.
– EM scale For the LAr calorimeters, the EM scale has been measured in test-beam studies, translating into a 3% uncertainty in the scale for in situ operation of the calorimeter [36, 38, 40].
For the tile calorimeter, the EM scale uncertainty of 4% is obtained by comparing test-beam muons, cosmic-ray muons and simulation [37].
These uncertainties are scaled according to the average fraction of jet energy deposited, respectively, in the electromagnetic and hadronic calorimeter as a function of pT, and combined to form the uncertainty on the EM
scale.
– Closure test of the JES calibration Any deviation from unity (non-closure) in pT and energy response
with respect to the particle jet after the application of the JES corrections to the nominal MC sample implies that the kinematics of the calibrated calorimeter jet are not restored to that of the corresponding particle jets. This can be caused by, for example, the fact that the JES calibration is derived using isolated jets, while the systematic uncertainty is estimated for inclusive jets.
The systematic uncertainty due to the non-closure of the calibration procedure in any given bin is taken as the largest deviation of the response from unity seen either in energy or pTin that bin. The contribution to
the uncertainty from this source is below 2% of the jet energy.
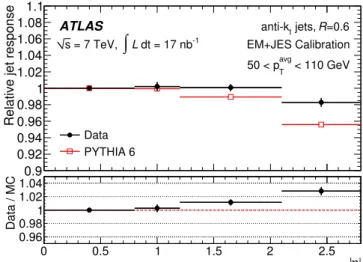
– JES uncertainty from dijet balance studies The JES uncertainty for the higher rapidity regions of the barrel and for the end-cap region is determined using the JES uncertainty for the central barrel region (0.3 < |η| < 0.8) as a baseline, and adding a contribution from the calibration of the jets with respect to it. This contribution is evaluated by measuring the relative pT
balance of forward jets in dijet events against reference central jets [41]. The η intercalibration uncertainty is determined for jets where the average pT(pavgT ) of the
two leading jets is between 50 GeV and 110 GeV and the resulting uncertainty is applied to all pT. Since
the main sources of uncertainty have been shown to decrease for higher pT and energy values than those
considered in the jet η-intercalibration study, this leads to a conservative estimate of the uncertainty in the end-cap region for most of the jets considered. The ratio of the calorimeter response between the ref-erence jet (lying in the region 0 < |η| < 0.8 ) and the probe jet, as a function of the probe jet η, is shown in Fig. 3 for both data and simulation. Two contribu-tions to the uncertainty are derived – that due to the difference between data and simulation, and that due to the deviation from unity in the data. The combined
Relative jet response
0.9 0.92 0.94 0.96 0.98 1 1.02 1.04 1.06 1.08 1.1 Data PYTHIA 6 ATLAS < 110 GeV avg T 50 < p =0.6 R jets, t anti-k EM+JES Calibration -1 dt = 17 nb L
∫
= 7 TeV, s | η | 0 0.5 1 1.5 2 2.5 Data / MC 0.96 0.98 1 1.02 1.04Fig. 3. Jet pTresponse (pjet,probeT /pjet,referenceT ) after the EM
scale plus JES (EM+JES) calibration against jets in the central
reference region (0 < |η| < 0.8), obtained by exploiting the pT
balance as a function of η in data and simulation. The lower plot indicates the ratio of the data to the simulation result.
contribution to the JES uncertainty from these sources is below 3% of the jet energy.
8.2 Hadronic Shower Model
The contributions to the JES uncertainty from the hadro-nic shower model are evaluated using two MC samples, one in which the Bertini nucleon cascade is not used, and one in which the Fritiof model [42] is used instead of the Quark Gluon String fragmentation model.
ATLAS test-beam data for single pions with energies ranging from 2 to 180 GeV have been compared to simu-lations using these two sets of parameters [43]. The mea-sured mean single pion response was shown to lie between these two descriptions over the whole pTrange of particles
in jets. These models lead to variations of within ±4% in the calorimeter response to hadrons. This is confirmed by studies comparing single isolated hadrons in collision data to MC simulation [44].
8.3 Event Generator Models
The contributions to the JES uncertainty from the frag-mentation and underlying event models and parameters of the MC event generator are obtained using samples generated with Alpgen + Herwig + Jimmy (which has a different matrix element, parton shower, hadronisation model and underlying event compared to the nominal sam-ple), the Pythia 6 MC09 tune modified to use Peru-gia0 fragmentation (which has a different underlying-event model with respect to the nominal sample [31]) and the Pythia 6 MC09 tune modified to use parameters tuned to LEP data using the Professor [32] software.
The observed deviations of the response from unity are smaller than 4%.
8.4 Pile-up
In data-taking periods with higher instantaneous luminos-ity, the effect of pile-up (multiple proton-proton interac-tions in the same bunch crossing) was small, but not negli-gible. The size of the effect was estimated by studying the dependence of the average energy density deposited in the calorimeters as a function of the number of reconstructed vertices per event. No correction is applied for this effect, but it is accounted for in the JES uncertainty. For jets with 20 < pT < 50 GeV, the pile-up fractional
system-atic uncertainty is about 1% in the barrel and 1-2% in the end-caps. For pT> 50 GeV, the pile-up uncertainty is
only significant for |η| > 2.1, and is smaller than 1%.
8.5 Effect of decorrelated JES uncertainty on dijet observables
Dijet observables, which in a single event can span the entire range in rapidity, with one jet in the central region and one in the end-cap region, are sensitive to decorrela-tions in the JES uncertainty as well as to its value at any given bin in rapidity. Based on results from dijet balance, a 3% positive shift in the jet energy scale was taken at |y| = 2.8 compared to that at |y| = 0, varying linearly in between and assumed to be symmetric in rapidity. This shift is interpreted as a 3% relative JES uncertainty and is added in quadrature to the other (absolute) sources of uncertainty for the dijet cross sections.
8.6 Combination of JES Uncertainties
Given that the JES uncertainty is applied to all com-ponents of the jet four-momentum, the largest deviation from unity in each bin derived from energy or pTresponse
is considered as the contribution to the final JES system-atic uncertainty for each specific systemsystem-atic effect.
All individual uncertainties are added in quadrature except that from the closure test, which is conservatively treated as fully correlated and added linearly.
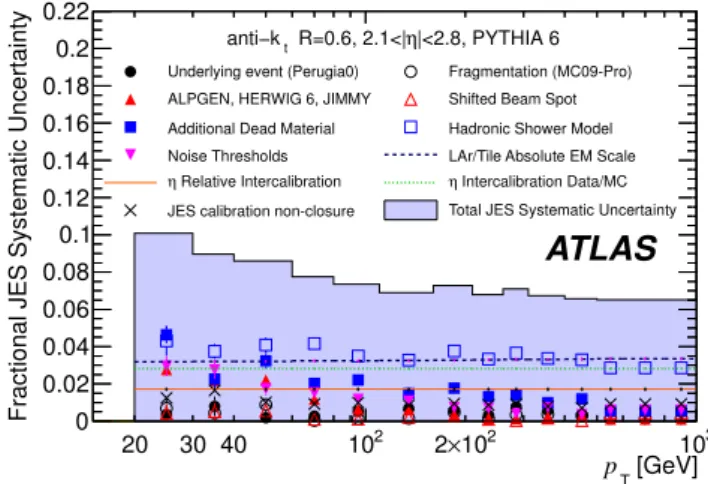
Figure 4 shows the final fractional JES systematic un-certainty as a function of jet pTfor an example central η
region. Figure 5 shows the forward region, where the con-tribution from intercalibration with the central region is also included. Both the total systematic uncertainty (light blue area) and the individual contributions are shown, with statistical errors from the fitting procedure if appli-cable. The pile-up uncertainty (see Section 8.4) and the dijet-specific relative uncertainty (see Section 8.5) are not included in these plots.
The maximum JES uncertainty in the central region amounts to approximately 9% for jets with 30 GeV < pT
< 60 GeV, and 7% for pT > 60 GeV. The uncertainty is
increased to up to 10% and 8% respectively for 30 GeV < pT < 60 GeV and pT> 60 GeV in the end-cap region,
where the central uncertainty is taken as a baseline and the uncertainty due to the intercalibration is added.
[GeV]
T
p
20 30 40 102 2×10² 103
Fractional JES Systematic Uncertainty 0
0.02 0.04 0.06 0.08 0.1 0.12 0.14 0.16 0.18
Underlying event (Perugia0) Fragmentation (MC09-Pro) ALPGEN, HERWIG 6, JIMMY Shifted Beam Spot Additional Dead Material Hadronic Shower Model Noise Thresholds LAr/Tile Absolute EM Scale JES calibration non-closure Total JES Systematic Uncertainty
|<0.8, PYTHIA 6 η R=0.6, 0.3<| t anti−k
ATLAS
Fig. 4. Fractional jet energy scale systematic uncertainty as
a function of pT for jets in the pseudorapidity region 0.3 <
|η| < 0.8 in the barrel calorimeter. The total systematic un-certainty is shown as the solid light blue area. The individual sources are also shown, with statistical errors if applicable.
[GeV]
T
p
20 30 40 102 2×10² 103
Fractional JES Systematic Uncertainty 0
0.02 0.04 0.06 0.08 0.1 0.12 0.14 0.16 0.18 0.2 0.22
Underlying event (Perugia0) Fragmentation (MC09-Pro) ALPGEN, HERWIG 6, JIMMY Shifted Beam Spot Additional Dead Material Hadronic Shower Model Noise Thresholds LAr/Tile Absolute EM Scale
Relative Intercalibration
η η Intercalibration Data/MC JES calibration non-closure Total JES Systematic Uncertainty
|<2.8, PYTHIA 6 η R=0.6, 2.1<| t anti−k
ATLAS
Fig. 5. Fractional jet energy scale systematic uncertainty as
a function of pT for jets in the pseudorapidity region 2.1 <
|η| < 2.8. The total uncertainty is shown as the solid light blue area. The JES uncertainty for the end-cap is extrapolated from the barrel uncertainty using dijet balance, with the con-tributions from the deviation from unity in the data (η relative intercalibration) and the deviation between data and simula-tion (η intercalibrasimula-tion Data/MC) shown separately. The other individual sources are also shown, with statistical errors if ap-plicable.
The dominant contributions to the uncertainty come from the hadronic shower model, the EM scale uncer-tainty, the detector material description, and the noise description.
The same study has been repeated for anti-ktjets with
resolution parameter R = 0.4, and the estimate of the JES uncertainty is comparable to anti-ktjets with R = 0.6,
al-beit slightly smaller because of the reduced effect of the dead material variation and the change in the noise contri-bution due to the smaller jet radius. The JES uncertainty for anti-ktjets with R = 0.4 is between ≈ 8% (9%) at low
jet pT and ≈ 6% (7%) for jets with pT > 60 GeV in the
central (end-cap) region.
The overall JES uncertainty is consistent with the re-sults of detailed comparisons between collision data and simulation [45].
9 Event Selection
The jet algorithm is run on energy clusters assuming that the event vertex is at the origin. The jet momenta are then corrected for the beamspot position. After calibration, all events are required to have at least one jet within the kine-matic region pT > 60 GeV, |y| < 2.8. Additional quality
criteria are also applied to ensure that jets are not pro-duced by noisy calorimeter cells or poorly-calibrated de-tector regions [46]. Events are required to have at least one vertex with at least five reconstructed tracks connected, within 10 cm in z of the beamspot. Simulated events are reweighted so that the z vertex distribution agrees with the data. Of the events passing the kinematic selection, 2.6% have more than one vertex. The overall efficiency of these selection cuts, evaluated in simulation using trig-gered events with truth jets in the kinematic region of the measurement, is above 99%, and has a small depen-dence on the kinematic variables. Background contribu-tions from non-pp-collision sources were evaluated using unpaired and empty bunches and found to be negligible.
After this selection, 56535 (77716) events remain, for R = 0.4 (0.6), with at least one jet passing the inclusive jet selection. Of these, 45621 (65739) events also pass the dijet selection.
10 Data Correction
The correction for trigger and detector efficiencies and res-olutions, other than the energy scale correction already applied, is performed in a single step using a bin-by-bin unfolding method evaluated using the MC samples. For each measured distribution, the corresponding MC cross section using truth jets (including muons and neutrinos) is evaluated in the relevant bins, along with the equivalent distributions after the detector simulation and analysis cuts. The ratio of the true to the simulated distributions provides a correction factor which is then applied to the data. Pythia 6 is used for the central correction. The un-certainty is estimated from the spread of the correction for the different generators, and also from artificially chang-ing the shape of the simulated distributions by reweightchang-ing the MC samples to account for possible biases caused by the input distribution.
This procedure is justified by the good modelling of the trigger efficiencies (Fig. 1) and the fact that the pT
and y distributions of the jets are reasonably well de-scribed by the simulation [45]. It is also important that the energy flow around the jet core is well understood, both as a validation of the QCD description contained in the event generators and as a cross check of the cal-ibration studies previously discussed, most of which are
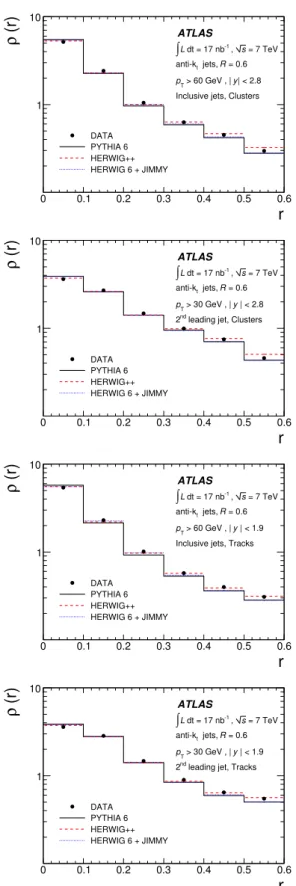
sensitive to the distribution of energy amongst particles, and within different angular regions, within the jet. The energy and momentum flow within jets can be expressed in terms of the differential jet shape, defined as the frac-tion, ρ(r) = pr
T/p R
T, where p R
Tis the transverse momentum
within a radius R of the jet centre, and pr
Tis the transverse
momentum contained within a ring of thickness ∆r = 0.1 at a radius r = p(∆y)2+ (∆φ)2 around the jet centre,
divided by ∆r. The jet shapes evaluated (without any correction for detector effects) using energy clusters and tracks are shown separately in Fig. 6 for anti-ktjets with
R = 0.6. The jets simulated by Pythia 6 are slightly narrower than the jets in the data, while the Herwig 6 + Jimmy and Herwig++ simulations provide a some-what better description. Overall the distribution of energy within the jets is reasonably well simulated. A similar level of agreement has been demonstrated for R = 0.4 jets. This gives further confidence in the calibrations and corrections applied.
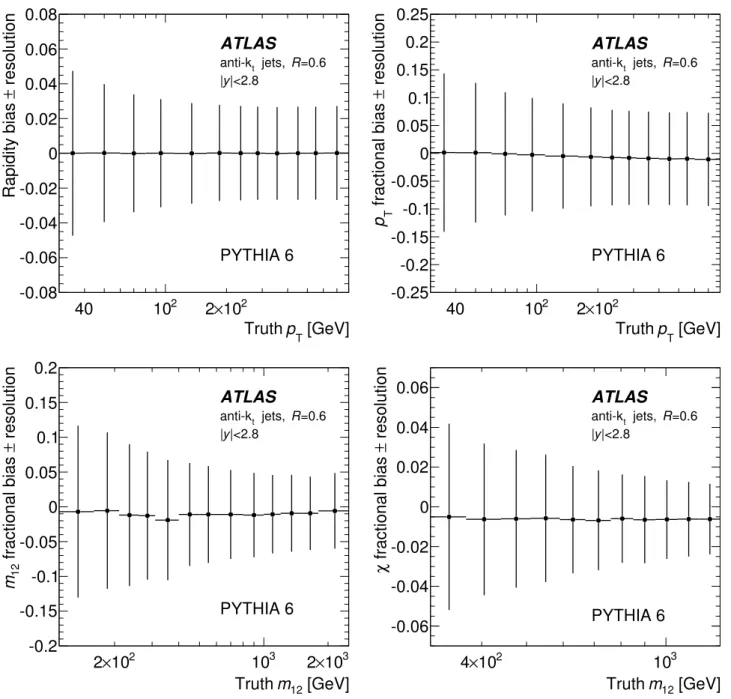
The resolutions in y, pT, dijet mass m12, and dijet χ
for anti-ktjets with R = 0.6 within |y| < 2.8, as obtained
using Pythia 6, are shown in Fig. 7. The present JES cal-ibration procedure applies an average correction to restore the jet response and does not attempt to optimise the jet energy resolution, which can be improved with more so-phisticated calibration techniques. From dijet balance and E/p studies of single hadrons, the pTresolution has been
verified to within a fractional uncertainty of ≈ 14% [47], though at a lower pT than most of the jets considered
here. The effect of varying the nominal pT resolution by
up to 15% of its nominal value is included in the system-atic uncertainty on the unfolding correction factors. The uncertainties due to the jet energy scale are also propa-gated to the final cross section through this unfolding pro-cedure, by applying variations to simulated samples. A fit is used to reduce statistical fluctuations in the systematic uncertainties from the jet energy scale for the dijet mass spectrum.
The overall correction factor for the pT spectrum is
below 20% throughout the kinematic region, and below 10% for central jets with pT> 60 GeV. As an example, the
correction factors for the pT spectrum with R = 0.6 are
shown along with their systematic uncertainties in Fig. 8 for two rapidity regions. For the dijet mass spectrum, the correction factors are generally within 15% while for χ they are less than 5%.
The integrated luminosities are calculated during runs6
by measuring interaction rates using several ATLAS de-vices at small angles to the beam direction, with the ab-solute calibration obtained from van der Meer scans. The uncertainty in the luminosity is estimated to be 11% [48]. The final systematic uncertainty in the cross section measurements is dominated by the jet energy scale uncer-tainty.
6
An ATLAS run is a period of continuous data-taking during an LHC proton fill.
r
0 0.1 0.2 0.3 0.4 0.5 0.6(r)ρ
1 10 ATLAS = 7 TeV s , -1 dt = 17 nb L ∫ DATA PYTHIA 6 HERWIG++ HERWIG 6 + JIMMY = 0.6 R jets, t anti-k | < 2.8 y > 60 GeV , | T pInclusive jets, Clusters
r
0 0.1 0.2 0.3 0.4 0.5 0.6(r)ρ
1 10 ATLAS = 7 TeV s , -1 dt = 17 nb L ∫ DATA PYTHIA 6 HERWIG++ HERWIG 6 + JIMMY = 0.6 R jets, t anti-k | < 2.8 y > 30 GeV , | T pleading jet, Clusters
nd 2
r
0 0.1 0.2 0.3 0.4 0.5 0.6(r)ρ
1 10 ATLAS = 7 TeV s , -1 dt = 17 nb L ∫ DATA PYTHIA 6 HERWIG++ HERWIG 6 + JIMMY = 0.6 R jets, t anti-k | < 1.9 y > 60 GeV , | T pInclusive jets, Tracks
r
0 0.1 0.2 0.3 0.4 0.5 0.6(r)ρ
1 10 ATLAS = 7 TeV s , -1 dt = 17 nb L ∫ DATA PYTHIA 6 HERWIG++ HERWIG 6 + JIMMY = 0.6 R jets, t anti-k | < 1.9 y > 30 GeV , | T pleading jet, Tracks
nd
2
Fig. 6. The uncorrected jet shape measured using energy
clusters (first two plots) and tracks (third and fourth plots) for
anti-ktjets with R = 0.6, compared to simulation, as a function
of the radial distance to the jet axis, r. The first and third
figures show the jet shapes for all jets with pT> 60 GeV, and
the second and fourth show the shape for the second highest
pTjet in dijet events.
11 Results and Discussion
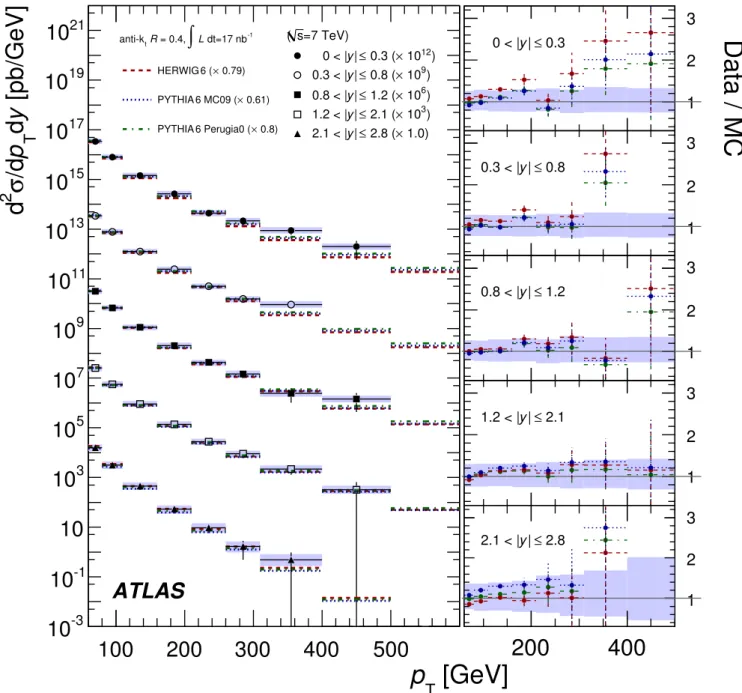
The cross sections from the parton-shower MC generators considered here are not reliable, since these calculations are performed at leading-order. However, many important kinematic terms are included in these calculations, and, unlike the NLO pQCD calculations, the predictions are made at the particle level. A comparison of the shapes of the distributions is therefore valuable. The expectations for the corrected pTand χ distributions from two different
Pythia 6 parameter tunes, as well as for Herwig 6 + Jimmy programs are compared to the data in Figs. 9-12. The normalisation of the simulation is to the inclusive jet cross section separately for each R value, and requires the factors shown in the legend7. In general the simulations
agree with the shapes of the data distributions.
The differential inclusive jet cross section in 7 TeV proton-proton collisions is shown in Fig. 13 and Fig. 14, as a function of jet pT, for anti-kt jets with R = 0.4 and
R = 0.6 respectively. The cross section extends from pT=
60 GeV up to around pT = 600 GeV, and falls by more
than four orders of magnitude over this range. The data are compared to NLO pQCD calculations corrected for non-perturbative effects. For both R = 0.4 and R = 0.6, data and theory are consistent.
Figures 15 and 16 show the double-differential cross section as a function of jet pTin several different regions
of rapidity. Tables 1–3 and 4–6 detail the same data. A selection of the same cross sections expressed as a function of rapidity in different pTranges is shown in Figs. 17 and
18. In Figs. 19 and 20 the ratio of the measurement to the theoretical prediction is shown for the double-differential distribution in jet pTfor R = 0.4 and R = 0.6 respectively.
The data are again compared to NLO pQCD predictions to which soft corrections have been applied, where the predictions are also given in the tables. In all regions, the theory is consistent with the data.
In Figs. 21 and 22, the double-differential dijet cross section is shown as a function of the dijet mass, for dif-ferent bins in |y|max. The cross section falls rapidly with
mass, and extends up to masses of nearly 2 TeV. Fig-ures 23 and 24 show the cross section as a function of the dijet angular variable χ for different ranges of the dijet mass m12. The data are compared to NLO pQCD
calcu-lations corrected for non-perturbative effects. The theory is consistent with the data. The dijet mass measurements and the theory predictions are also given in Tables 7-11 and 12-16 for R = 0.4 and R = 0.6 respectively. Those for χ are given in Tables 17-19 and 20-22.
In Figs. 25 and 26 the ratio of the measurement to the theoretical prediction is shown for the double-differential dijet cross sections for R = 0.4 and R = 0.6 respectively. The data are again compared to NLO pQCD predictions to which soft corrections have been applied, also included
7
If the R = 0.4 and R = 0.6 measurements are fitted simul-taneously, the factors are 0.91, 0.92 and 0.69 for Herwig + Jimmy, Pythia 6 Perugia0 tune and Pythia 6 MC09 respec-tively.
in the tables. In all regions, the theory is consistent with the data.
12 Conclusion
Inclusive and dijet cross sections have been measured for the first time in proton-proton collisions with the ATLAS detector, at a centre-of-mass energy of 7 TeV, using an integrated luminosity of 17 nb−1.
The cross sections have been measured with the anti-kt
algorithm using two different R parameters, with differ-ent sensitivity to soft QCD corrections. This is the first cross section measurement in hadron-hadron collisions us-ing this jet algorithm.
The cross sections extend into previously unmeasured kinematic regimes. For inclusive jets, the double-differen-tial cross section has been measured for jets with |y| < 2.8 and pT > 60 GeV. The pT distribution extends up
to 600 GeV. For dijet events, containing a jet with pT >
30 GeV in the same rapidity region, the cross section has been measured as a function of the dijet mass and of the angular variable χ. The dijet mass distribution extends up to nearly 2 TeV.
The dominant systematic uncertainty in these mea-surements comes from the jet energy response of the calo-rimeter. This scale uncertainty has been determined to be below 10% over the whole kinematic range of these measurements, and to be below 7% for central jets with pT> 60 GeV, leading to a systematic uncertainty in the
cross sections of around 40%.
The measurements use only 17 nb−1 of integrated lu-minosity, but the statistical errors are not the dominant contribution to the uncertainty below around 300 GeV in transverse momentum. Data already recorded by AT-LAS will extend the reach of subsequent measurements and their precision at high transverse momenta.
Leading-logarithmic parton-shower MC generators pro-vide a reasonable description of the energy flow around the jets, and of the shapes of the measured distributions.
The differential cross sections have been compared to NLO pQCD calculations corrected for non-perturbative effects. The inclusive jet measurements are sensitive to the combination of the QCD matrix element and parton densities within the proton, evolved from determinations made using measurements from previous experiments at lower energy scales. The dijet measurements have been made in a region where the sensitivity to the parton dis-tributions is reduced, and thus primarily test the struc-ture of the QCD matrix element. For both inclusive and dijet measurements, the theory agrees well with the data, validating this perturbative QCD approach in a new kine-matic regime.
Acknowledgements
We deeply thank everybody at CERN involved in oper-ating the LHC in such a superb way during this initial
high-energy data-taking period. We acknowledge equally warmly all the technical and administrative staff in the collaborating institutions without whom ATLAS could not be operated so efficiently.
We acknowledge the support of ANPCyT, Argentina; Yerevan Physics Institute, Armenia; ARC and DEST, Aus-tralia; Bundesministerium f¨ur Wissenschaft und Forschung, Austria; National Academy of Sciences of Azerbaijan; State Committee on Science & Technologies of the Republic of Belarus; CNPq and FINEP, Brazil; NSERC, NRC, and CFI, Canada; CERN; CONICYT, Chile; NSFC, China; COLCIENCIAS, Colombia; Ministry of Education, Youth and Sports of the Czech Republic, Ministry of Industry and Trade of the Czech Republic, and Committee for Col-laboration of the Czech Republic with CERN; DNRF, DNSRC and the Lundbeck Foundation, Denmark; Euro-pean Commission, through the ARTEMIS Research Train-ing Network; IN2P3-CNRS and CEA-DSM/IRFU, France; Georgian Academy of Sciences; BMBF, DFG, HGF and MPG, Germany; Ministry of Education and Religion, through the EPEAEK program PYTHAGORAS II and GSRT, Greece; ISF, MINERVA, GIF, DIP, and Benoziyo Cen-ter, Israel; INFN, Italy; MEXT, Japan; CNRST, Morocco; FOM and NWO, Netherlands; The Research Council of Norway; Ministry of Science and Higher Education, Poland; GRICES and FCT, Portugal; Ministry of Education and Research, Romania; Ministry of Education and Science of the Russian Federation and State Atomic Energy Cor-poration ROSATOM; JINR; Ministry of Science, Serbia; Department of International Science and Technology Co-operation, Ministry of Education of the Slovak Repub-lic; Slovenian Research Agency, Ministry of Higher Ed-ucation, Science and Technology, Slovenia; Ministerio de Educaci´on y Ciencia, Spain; The Swedish Research Coun-cil, The Knut and Alice Wallenberg Foundation, Sweden; State Secretariat for Education and Science, Swiss Na-tional Science Foundation, and Cantons of Bern and Geneva, Switzerland; National Science Council, Taiwan; TAEK, Turkey; The STFC, the Royal Society and The Lever-hulme Trust, United Kingdom; DOE and NSF, United States of America.
References
1. UA1 Collaboration, G. Arnison et al., Angular Distributions and Structure Functions from Two Jet
Events at the CERN SPS p¯p Collider , Phys. Lett. B136
(1984) 294.
UA2 Collaboration, J. Alitti et al., Inclusive jet
cross-section and a search for quark compositeness at the
CERN p¯p collider , Phys. Lett. B257 (1991) 232–240.
L3 Collaboration, B. Adeva et al., Determination of αs
from jet multiplicities measured on the Z resonance, Phys. Lett. B248 (1990) 464–472.
ZEUS Collaboration, S. Chekanov et al., Dijet photoproduction at HERA and the structure of the photon, Eur. Phys. J. C23 (2002) 615–631, arXiv:hep-ex/0112029.
ALEPH Collaboration, A. Heister et al., Measurements of the strong coupling constant and the QCD colour factors
using four-jet observables from hadronic Z decays, Eur. Phys. J. C27 (2003) 1–17.
ZEUS Collaboration, S. Chekanov et al., Inclusive jet cross sections in the Breit frame in neutral current deep
inelastic scattering at HERA and determination of αs,
Phys. Lett. B547 (2002) 164–180, arXiv:hep-ex/0208037.
DELPHI Collaboration, J. Abdallah et al., Measurement of the energy dependence of hadronic jet rates and the
strong coupling αs from the four-jet rate with the
DELPHI detector at LEP , Eur. Phys. J. C38 (2005) 413–426, arXiv:hep-ex/0410071.
OPAL Collaboration, G. Abbiendi et al., Measurement of
the strong coupling αsfrom four-jet observables in e+e−
annihilation, Eur. Phys. J. C47 (2006) 295–307, arXiv:hep-ex/0601048.
ZEUS Collaboration, S. Chekanov et al., An NLO QCD analysis of inclusive cross-section and jet- production data from the ZEUS experiment , Eur. Phys. J. C42 (2005) 1–16, arXiv:hep-ph/0503274.
CDF Collaboration, A. Abulencia et al., Measurement of
the inclusive jet cross section using the kT algorithm in
p¯p collisions at√s = 1.96 TeV with the CDF II detector ,
Phys. Rev. D75 (2007) 092006, hep-ex/0701051. OPAL Collaboration, G. Abbiendi et al., Inclusive Jet
Production in Photon-Photon Collisions at√seefrom
189 to 209 GeV , Phys. Lett. B658 (2008) 185–192, arXiv:0706.4382 [hep-ex].
D0 Collaboration, V. M. Abazov et al., Measurement of
the inclusive jet cross-section in p¯p collisions at√s
=1.96 TeV , Phys. Rev. Lett. 101 (2008) 062001, arXiv:0802.2400 [hep-ex].
CDF Collaboration, T. Aaltonen et al., Measurement of the Inclusive Jet Cross Section at the Fermilab Tevatron p-pbar Collider Using a Cone-Based Jet Algorithm, Phys. Rev. D78 (2008) 052006, arXiv:0807.2204 [hep-ex]. D0 Collaboration, V. M. Abazov et al., Determination of the strong coupling constant from the inclusive jet cross
section in ppbar collisions at √s = 1.96 TeV , Phys. Rev.
D80 (2009) 111107, arXiv:0911.2710 [hep-ex]. H1 Collaboration, F. D. Aaron et al., Jet Production in
ep Collisions at Low Q2 and Determination of αs, Eur.
Phys. J. C67 (2010) 1–24, arXiv:0911.5678 [hep-ex]. H1 Collaboration, F. D. Aaron et al., Jet production in ep
collisions at high Q2 and determination of α
s, Eur. Phys.
J. C (2009) , arXiv:0904.3870 [hep-ex]. DESY-09-032. D0 Collaboration, V. M. Abazov et al., Measurement of
dijet angular distributions at√s = 1.96 TeV and searches
for quark compositeness and extra spatial dimensions, Phys. Rev. Lett. 103 (2009) 191803, arXiv:0906.4819 [hep-ex].
ZEUS Collaboration, H. Abramowicz et al., Inclusive-jet cross sections in NC DIS at HERA and a comparison of
the kT, anti-kT and SIScone jet algorithms, Phys. Lett.
B691 (2010) 127–137, arXiv:1003.2923 [hep-ex]. D0 Collaboration, V. M. Abazov et al., Measurement of the dijet invariant mass cross section in pp collisions at √
s = 1.96 TeV , arXiv:1002.4594 [hep-ex]. Submitted to Phys. Lett. B.
2. ATLAS Collaboration, Search for New Particles in Two-Jet Final States in 7 TeV Proton-Proton Collisions with the ATLAS Detector at the LHC , arXiv:1008.2461 [hep-ex]. Accepted by Phys. Rev. Lett.
ATLAS Collaboration, Search for Quark Contact Interactions in Dijet Angular Distributions in pp
Collisions at√s = 7 TeV Measured with the ATLAS
Detector , arXiv:1009.5069 [hep-ex]. Submitted to Phys. Lett. B.
3. ATLAS Collaboration, The ATLAS Experiment at the CERN Large Hadron Collider , JINST 3 (2008) S08003. 4. ATLAS Collaboration, Charged-particle multiplicities in
pp interactions at √s = 900 GeV measured with the
ATLAS detector at the LHC , Phys. Lett. B688 (2010) 21–42, arXiv:1003.3124 [hep-ex].
5. M. Cacciari, G. Salam, and G. Soyez, The anti-kt jet
clustering algorithm, JHEP 0804 (2008) 063, arXiv:0802.1189.
6. M. Cacciari and G. P. Salam, Dispelling the N3 myth for
the ktjet-finder , Phys. Lett. B641 (2006) 57–61,
hep-ph/0512210.
G. P. Salam, M. Cacciari, and G. Soyez.
http://www.lpthe.jussieu.fr/~salam/fastjet/. 7. C. Buttar et al., Standard Model Handles and Candles
Working Group: Tools and Jets Summary Report , arXiv:arXiv:0803.0678 [hep-ph].
8. S. Frixione and G. Ridolfi, Jet photoproduction at HERA, Nucl. Phys. B507 (1997) 315–333,
arXiv:hep-ph/9707345.
9. T. Sj¨ostrand, S. Mrenna, and P. Skands, PYTHIA 6.4
physics and manual , JHEP 05 (2006) 026, hep-ph/0603175.
10. G. Corcella et al., HERWIG 6: An event generator for hadron emission reactions with interfering gluons (including supersymmetric processes), JHEP 01 (2001) 010, hep-ph/0011363.
11. J. M. Butterworth, J. R. Forshaw, and M. H. Seymour, Multiparton interactions in photoproduction at HERA, Z. Phys. C72 (1996) 637–646, arXiv:hep-ph/9601371. 12. M. Bahr et al., Herwig++ Physics and Manual , Eur.
Phys. J. C58 (2008) 639–707, arXiv:0803.0883 [hep-ph].
13. M. L. Mangano, M. Moretti, F. Piccinini, R. Pittau, and A. D. Polosa, ALPGEN, a generator for hard multiparton processes in hadronic collisions, JHEP 07 (2003) 001, hep-ph/0206293.
14. T. Gleisberg et al., Event generation with SHERPA 1.1 , JHEP 02 (2009) 007, arXiv:0811.4622 [hep-ph]. 15. ATLAS Collaboration, ATLAS Monte Carlo tunes for
MC09 , ATL-PHYS-PUB-2010-002, 2010.
16. A. D. Martin, W. J. Stirling, R. S. Thorne, and G. Watt, Parton distributions for the LHC , Eur. Phys. J. C63 (2009) 189–285, arXiv:0901.0002 [hep-ph].
17. A. Sherstnev and R. S. Thorne, Parton Distributions for LO Generators, Eur. Phys. J. C55 (2008) 553–575, arXiv:0711.2473 [hep-ph].
18. ATLAS Collaboration, The ATLAS Simulation Infrastructure, arXiv:1005.4568. Accepted by Eur. Phys. J.
19. GEANT4 Collaboration, S. Agostinelli et al., GEANT4: A simulation toolkit , Nucl. Instrum. Meth. A506 (2003) 250–303.
20. G. Folger and J. P. Wellisch, String parton models in Geant4 , arXiv:nucl-th/0306007.
21. H. Bertini, Intranuclear Cascade Calculation of the Secondary Nucleon Spectra from Nucleon Nucleus Interactions in the Energy Range 340 to 2900 MeV and
Comparisons with Experiment , Phys. Rev. 188 (1969) 1711–1730.
22. A. Ribon et al., Status of Geant4 hadronic physics for the simulation of LHC experiments at the LHC physics program, Tech. Rep. CERN-LCGAPP-2010-02, CERN, Geneva, May, 2010.
23. E. Abat et al., Response and Shower Topology of 2 to 180 GeV Pions Measured with the ATLAS Barrel Calorimeter at the CERN Test-beam and Comparison to Monte Carlo Simulations, Tech. Rep. ATL-CAL-PUB-2010-001, CERN, Geneva, May, 2010.
P. Adragna et al., Measurement of Pion and Proton Response and Longitudinal Shower Profiles up to 20 Nuclear Interaction Lengths with the ATLAS Tile Calorimeter , CERN-PH-EP-2009-019.
ATL-TILECAL-PUB-2009-009, 2009.
E. Abat et al., Study of the response of the ATLAS central calorimeter to pions of energies from 3 to 9 GeV , Nucl. Instrum. Meth. A607 (2009) 372–386.
E. Abat et al., Study of energy response and resolution of the ATLAS barrel calorimeter to hadrons of energies from 20 to 350 GeV , Nuclear Instruments and Methods in Physics Research A 621 (2010) 134–150.
24. J. Pinfold et al., Performance of the ATLAS liquid argon endcap calorimeter in the pseudorapidity region 2.5 to 4.0 in beam tests, Nucl. Instrum. Meth. A593 (2008) 324–342.
D. M. Gingrich et al., Construction, assembly and testing of the ATLAS hadronic end-cap calorimeter , J. Inst. 2 (2007) no. 05, P05005.
25. Z. Nagy, Next-to-leading order calculation of three jet observables in hadron hadron collision, Phys. Rev. D68 (2003) 094002, arXiv:hep-ph/0307268.
26. W. T. Giele, E. W. N. Glover, and D. A. Kosower, Higher order corrections to jet cross-sections in hadron colliders, Nucl. Phys. B403 (1993) 633–670, hep-ph/9302225. 27. P. M. Nadolsky et al., Implications of CTEQ global
analysis for collider observables, Phys. Rev. D78 (2008) 013004, arXiv:0802.0007 [hep-ph].
28. NNPDF Collaboration, R. D. Ball et al., A determination of parton distributions with faithful uncertainty
estimation, Nucl. Phys. B809 (2009) 1–63, arXiv:0808.1231 [hep-ph].
29. The H1 and ZEUS Collaborations, Combined
Measurement and QCD Analysis of the Inclusive e±p
Scattering Cross Sections at HERA, JHEP (2010) , arXiv:0911.0884 [hep-ex].
30. T. Carli et al., A posteriori inclusion of parton density functions in NLO QCD final-state calculations at hadron colliders: The APPLGRID Project , Eur. Phys. J. C66 (2010) 503–524, arXiv:0911.2985 [hep-ph].
31. P. Z. Skands, The Perugia Tunes, arXiv:0905.3418 [hep-ph].
32. A. Buckley, H. Hoeth, H. Lacker, H. Schulz, and J. E. von Seggern, Systematic event generator tuning for the LHC , Eur. Phys. J. C65 (2010) 331–357,
arXiv:0907.2973 [hep-ph].
33. A. Buckley et al., Rivet user manual , arXiv:1003.0694 [hep-ph].
34. W. Lampl et al., Calorimeter Clustering algorithms: Description and Performance, Tech. Rep.
ATLAS-LARG-PUB-2008-002, CERN, Geneva, December, 2008.
35. M. Aleksa et al., ATLAS Combined Testbeam:
Computation and Validation of the Electronic Calibration Constants for the Electromagnetic Calorimeter ,
ATL-LARG-PUB-2006-003, 2006.
36. ATLAS Collaboration, M. Aharrouche et al., Readiness of the ATLAS Liquid Argon Calorimeter for LHC Collisions, arXiv:0912.2642.
37. M. Aharrouche et al., Readiness of the ATLAS Tile Calorimeter for LHC collisions, arXiv:1007.5423 [physics.ins-det].
ATLAS-TCAL-2010-01-006,CERN-PH-EP-2010-024. 38. M. Aharrouche et al., Measurement of the response of the
ATLAS liquid argon barrel calorimeter to electrons at the 2004 combined test- beam, Nucl. Instrum. Meth. A614 (2010) 400–432.
39. ATLAS Collaboration, Performance of the ATLAS Detector using First Collision Data, arXiv:1005.5254 [hep-ex].
40. M. Aharrouche et al., Time resolution of the ATLAS barrel liquid argon electromagnetic calorimeter , Nucl. Instrum. Meth. A597 (2008) 178–188.
41. ATLAS Collaboration, In-situ pseudo-rapidity
inter-calibration to evaluate jet energy scale uncertainty and calorimeter performance in the forward region, ATLAS-CONF-2010-055, 2010.
42. B. Andersson, G. Gustafson, and B. Nilsson-Almqvist, A model for low-pT hadronic reactions with generalizations to hadron-nucleus and nucleus-nucleus collisions, Nucl. Phys. B 281 (1987) no. 1-2, 289 – 309.
43. E. Abat et al., Response and Shower Topology of 2 to 180 GeV Pions Measured with the ATLAS Barrel Calorimeter at the CERN Test-beam and Comparison to Monte Carlo Simulations, ATL-CAL-PUB-2010-001, 2010.
44. ATLAS Collaboration, ATLAS Calorimeter Response to Single Isolated Hadrons and Estimation of the
Calorimeter Jet Scale Uncertainty , ATLAS-CONF-2010-052, 2010.
45. ATLAS Collaboration, Properties of Jets and Inputs to Jet Reconstruction and Calibration with the ATLAS
Detector Using Proton-Proton Collisions at√s = 7 TeV ,
ATLAS-CONF-2010-053, 2010.
46. ATLAS Collaboration, Data-Quality Requirements and Event Cleaning for Jets and Missing Transverse Energy Reconstruction with the ATLAS Detector in
Proton-Proton Collisions at a Center-of-Mass Energy of √
s = 7 TeV , ATLAS-CONF-2010-038, 2010. 47. ATLAS Collaboration, Jet Energy Resolution and
Selection Efficiency Relative to Track Jets from In-situ Techniques with the ATLAS Detector Using
Proton-Proton Collisions at a Center of Mass Energy √
s = 7 TeV , ATLAS-CONF-2010-054, 2010.
48. ATLAS Collaboration, Luminosity Determination Using the ATLAS Detector , ATLAS-CONF-2010-060, 2010.
[GeV]
Tp
Truth
40
10
22
×
10
2resolution
±
Rapidity bias
-0.08
-0.06
-0.04
-0.02
0
0.02
0.04
0.06
0.08
ATLAS
=0.6 R jets, t anti-k |<2.8 y |PYTHIA 6
[GeV]
Tp
Truth
40
10
22
×
10
2resolution
±
fractional bias
Tp
-0.25
-0.2
-0.15
-0.1
-0.05
0
0.05
0.1
0.15
0.2
0.25
ATLAS
=0.6 R jets, t anti-k |<2.8 y |PYTHIA 6
[GeV]
12m
Truth
210
×
2
10
32
×
10
3resolution
±
fractional bias
12m
-0.2
-0.15
-0.1
-0.05
0
0.05
0.1
0.15
0.2
ATLAS
=0.6 R jets, t anti-k |<2.8 y |PYTHIA 6
[GeV]
12m
Truth
210
×
4
10
3resolution
±
fractional bias
χ
-0.06
-0.04
-0.02
0
0.02
0.04
0.06
ATLAS
=0.6 R jets, t anti-k |<2.8 y |PYTHIA 6
Fig. 7. The upper two plots show the absolute (fractional) resolution and bias in jet y (pT) as a function of true pT. The
bottom two plots show the fractional resolution and bias in dijet mass m12and angular variable χ as a function of truth m12
computed from the two leading truth jets. These are shown for all jets identified using the anti-kt algorithm with R = 0.6 in
events passing the final kinematic selection, as predicted by Pythia 6. The error bar indicates the resolution and the central value indicates the bias.
[GeV]
Tp
100 200 300 400 500 600 700 800
Unfolding factor
0
0.2
0.4
0.6
0.8
1
1.2
= 7 TeV s PYTHIA 6,Unc. from shape (x10)
resol. (x10) E Unc. from resol. (x10) y Unc. from | < 0.8 y 0.3 < | =0.6 R jets, t anti-k
ATLAS
[GeV]
Tp
50
100 150 200 250 300 350 400
Unfolding factor
0
0.2
0.4
0.6
0.8
1
1.2
= 7 TeV s PYTHIA 6,Unc. from shape (x10)
resol. (x10) E Unc. from resol. (x10) y Unc. from | < 2.8 y 2.1 < | =0.6 R jets, t anti-k
ATLAS
Fig. 8. Correction factors for the inclusive jet pTspectrum in the rapidity bins 0.3 < |y| < 0.8 (left) and 2.1 < |y| < 2.8 (right),
along with systematic uncertainties due to uncertainties in the jet pT spectrum shape, jet energy resolution, and jet angular
100
200
300
400
500
600
[pb/GeV]
y
d
T
p
/dσ
2
d
-310
-110
10
310
510
710
910
1110
1310
1510
1710
1910
2110
ATLAS
-1 dt=17 nb L∫
= 0.4, R t anti-k 0.79) × 6 ( HERWIG 0.61) × 6 MC09 ( PYTHIA 0.8) × 6 Perugia0 ( PYTHIA =7 TeV) s ( ) 12 10 × 0.3 ( ≤ | y 0 < | ) 9 10 × 0.8 ( ≤ | y 0.3 < | ) 6 10 × 1.2 ( ≤ | y 0.8 < | ) 3 10 × 2.1 ( ≤ | y 1.2 < | 1.0) × 2.8 ( ≤ | y 2.1 < |1
2
3
0.3 ≤ | y 0 < |1
2
3
0.8 ≤ | y 0.3 < |1
2
3
1.2 ≤ | y 0.8 < |1
2
3
2.1 ≤ | y 1.2 < |200
400
1
2
3
2.8 ≤ | y 2.1 < |Data / MC
[GeV]
T
p
Fig. 9. Inclusive jet double-differential cross section as a function of pT, for different bins of rapidity y. The results are shown
for jets identified using the anti-kt algorithm with R = 0.4. The data are compared to leading-logarithmic parton-shower MC
simulations, normalised to the measured cross section by the factors shown in the legend, fixed to give the best normalisation to the inclusive jet measurements. The bands indicate the total systematic uncertainty on the data. The error bars indicate
the statistical uncertainty, which is calculated as 1/√N , where N is the number of entries in a given bin. The insets along the
100
200
300
400
500
600
[pb/GeV]
y
d
T
p
/dσ
2
d
-310
-110
10
310
510
710
910
1110
1310
1510
1710
1910
2110
ATLAS
-1 dt=17 nb L∫
= 0.6, R t anti-k 1.0) × 6 Perugia0 ( PYTHIA 0.78) × 6 MC09 ( PYTHIA 1.0) × 6 ( HERWIG =7 TeV) s ( ) 12 10 × 0.3 ( ≤ | y 0 < | ) 9 10 × 0.8 ( ≤ | y 0.3 < | ) 6 10 × 1.2 ( ≤ | y 0.8 < | ) 3 10 × 2.1 ( ≤ | y 1.2 < | 1.0) × 2.8 ( ≤ | y 2.1 < |1
2
3
0.3 ≤ | y 0 < |1
2
3
0.8 ≤ | y 0.3 < |1
2
3
1.2 ≤ | y 0.8 < |1
2
3
2.1 ≤ | y 1.2 < |200
400
1
2
3
2.8 ≤ | y 2.1 < |Data / MC
[GeV]
T
p
Fig. 10. Inclusive jet double-differential cross section as a function of pT, for different bins of rapidity y. The results are shown
for jets identified using the anti-kt algorithm with R = 0.6. The data are compared to leading-logarithmic parton-shower MC
simulations, normalised to the measured cross section by the factors shown in the legend, fixed to give the best normalisation to the inclusive jet measurements. The bands indicate the total systematic uncertainty on the data. The error bars indicate
the statistical uncertainty, which is calculated as 1/√N , where N is the number of entries in a given bin. The insets along the
[pb/GeV]
12md
χ
/dσ
2d
10
20
30
10
20
30
10
20
30
10
20
30
ATLAS
2 4 6 2 4 6 2 4 6 2 4 6 (s=7 TeV) < 520 GeV 12 m 340 < < 800 GeV 12 m 520 < < 1200 GeV 12 m 800 <1
10
0.2 0.4 0.61
10
0.2 0.4 0.61
10
0.2 0.4 0.61
10
0.2 0.4 0.6 -1 dt=17 nb L∫
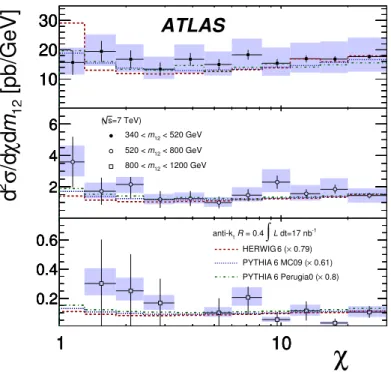
= 0.4 R t anti-k 0.79) × 6 ( HERWIG 0.61) × 6 MC09 ( PYTHIA 0.8) × 6 Perugia0 ( PYTHIAχ
Fig. 11. Dijet double-differential cross section as a function of angular variable χ in different regions of dijet mass m12, for
jets identified using the anti-kt algorithm with R = 0.4. The data are compared to leading-logarithmic parton-shower MC
simulations, normalised to the measured cross section by the factors shown in the legend, fixed to give the best normalisation to the inclusive jet measurements. The bands indicate the total systematic uncertainty on the data. The error bars indicate the
statistical uncertainty, which is calculated as 1/√N , where N is the number of entries in a given bin.
[pb/GeV]
12md
χ
/dσ
2d
20
40
20
40
20
40
20
40
ATLAS
2 4 6 2 4 6 2 4 6 2 4 6 (s=7 TeV) < 520 GeV 12 m 340 < < 800 GeV 12 m 520 < < 1200 GeV 12 m 800 <1
10
0.5 11
10
0.5 11
10
0.5 11
10
0.5 1 anti-ktR = 0.6∫
L dt=17 nb-1 1.0) × 6 Perugia0 ( PYTHIA 0.78) × 6 MC09 ( PYTHIA 1.0) × 6 ( HERWIGχ
Fig. 12. Dijet double-differential cross section as a function of angular variable χ in different regions of dijet mass m12, for
jets identified using the anti-kt algorithm with R = 0.6. The data are compared to leading-logarithmic parton-shower MC
simulations, normalised to the measured cross section by the factors shown in the legend, fixed to give the best normalisation to the inclusive jet measurements. The bands indicate the total systematic uncertainty on the data. The error bars indicate the