HAL Id: insu-02919091
https://hal-insu.archives-ouvertes.fr/insu-02919091
Submitted on 21 Aug 2020
HAL is a multi-disciplinary open access
archive for the deposit and dissemination of
sci-entific research documents, whether they are
pub-lished or not. The documents may come from
teaching and research institutions in France or
abroad, or from public or private research centers.
L’archive ouverte pluridisciplinaire HAL, est
destinée au dépôt et à la diffusion de documents
scientifiques de niveau recherche, publiés ou non,
émanant des établissements d’enseignement et de
recherche français ou étrangers, des laboratoires
publics ou privés.
Tracer analysis of transport from the boundary layer to
the free troposphere
Johanna Kowol-Santen, Matthias Beekmann, S. Schmitgen, K. Dewey
To cite this version:
Johanna Kowol-Santen, Matthias Beekmann, S. Schmitgen, K. Dewey. Tracer analysis of transport
from the boundary layer to the free troposphere. Geophysical Research Letters, American Geophysical
Union, 2001, 28 (15), pp.2907-2910. �10.1029/2001GL012908�. �insu-02919091�
GEOPHYSICAL RESEARCH LETTERS, VOL. 28, NO. 15, PAGES 2907-2910, AUGUST 1,2001
Tracer analysis of transport from the boundary layer to
the free troposphere
J. Kowol-Santen
1 M Beekmann
1 S Schmitgen
Service d'A6ronomie du CNRS, Paris
2 and K. Dewey
3
Abstract. A mesoscale meteorological model with pas- sive tracers is applied in order to analyze transport from the atmospheric boundary layer to the free troposphere. The validation of the model against aircraft measure- ments indicates that the model adequately simulates
the tracer distributions in the free troposphere as well
as in the boundary layer. Budget calculations of passive tracers are performed in order to estimate the amount
of transport in the area of a frontal system. The results show a very effective uplift associated in particular with a WCB transporting up to --• 70% of a passive tracer initialized in the boundary layer to the free troposphere within 3 days.
1. Introduction
In order to explain the variability of chemical species in the free troposphere it is necessary to analyze not
only the chemistry but also the transport of anthro- pogenic pollutants and to understand the dynamical
processes responsible for the vertical uplifting of air- masses from the atmospheric boundary layer {ABL) to the free troposphere (FT). Three major processes are re-
sponsible
for high vertical uplifting (some
kilometers):
frontal systems, deep convection and orographically in- duced vertical motions. The processes of vertical uplift- ing are not well understood yet and in particular poorly quantified. They are very important for the transport of pollutants to the FT where they can affect the ozone and radical budget due to e.g. the ozone production ef- ficiency per unit NOz, which is approximately 5-10 ppb
O3 / ppb NOz in the continental ABL and 20-100 ppb
O3 /ppb NOz in the FT [Liu et al., 1987]. Measure-
ments of trace gases in frontal systems gave clear evi- dence of strong uplifting of airmasses from the ABL to the FT associated with WCBs over western Europe, which are defined as streams of warm air which propa-
gate along and ahead of a cold front typically ascending [e.g. Bethan et al., 1998].
Some studies have already been carried out on the con-
tinental scale in order to estimate the amount of pollu- tant transport from the ABL to the FT [e.g. Liang e!
al., 1998]. The most
popular
approach
for the analy-
sis of vertical transport
is the use of trajectory
models
[e.g Wernli
and Davies,
1997;
$tohl,
2001]. However,
continental
scale
and trajectory
models
tend to rely on
data sets with coarse spatial and temporal resolution often insufficient to resolve mesoscale features of verti-
cal transport
(including
convection)
related to frontal
systems.
In the present study passive
tracers are transported
online in a mesoscale
model with high horizontal
and
in particular high vertical resolution in order to ana-
lyze and quantify the vertical transport associated with a frontal system. The tracer transport is validated
against aircraft measurements.
2. Measurements and meteorological
context
On August 5, 1999 measurements of primary pol- lutants, photooxidants and intermediate products in-
cluding radical species were performed on board of the
Met. Research Flight C-130 aircraft. In this paper we
concentrate on the CO and specific humidity measure- ments. CO is a good tracer of continental emissions
due to its lifetime of several weeks. It was measured
with the resonance fluorescence method with a tempo- ral resolution of 1 s and an accuracy of 4% [•erbig et al. , 1999].
The meteorological situation at the beginning of August
1999 was characterized by a depression located west of Ireland which slowly moved south-eastward. On Au-
gust 5, 1999 the associated cold front extended over
England and France towards northern Spain and moved
slowly eastward. The warm front extended over Eng-
land and northern France while the occlusion turned
over Ireland (Fig. 1).
•Service d'A6ronomie du CNRS, Universitd Paris 6
2Institut ffir Chemie und Dynamik der Geosphaere, For-
schungszentrum J iilich
3Met Research Flight, Farnborough
Copyright 2001 by the American Geophysical Union.
Paper number 2001GL012908. 0094-8276/01/2001GL012908505.00
3. Model description
The mesoscale model (M6so-NH) applied for the anal-
ysis of this flight is a non-hydrostatic anelastic equation model developed by M6t6o France and Centre National
de la Recherche
Scientifique
[Lafore et al, 1998]. Key
parameterizations used for the presented case study in- clude a mass conserving multidimensional positive der-
20O.O 180.0
170.0
160.0----•
150.0
----•
140.0
.• 130 0 110.0 90.0 80.0 1700Figure 1. The CO passive tracer field [ppb] at • 3 km
and the position of the frontal system on August 3, 1999
at 12 UTC (upper frame) and August 5, 1999 at 12 UTC (lower frame). Upper frame: The white box marks the area of the WCB (see text). Lower frame: The black
line indicates the flight track, the white rectangles the
positions of the CO maxima (see text).
72 h backward trajectories, arrival ' 05/08/99, 10 UTC
40
• • • '
•,•,•,•,•,.
30 •, •, •z •c • •c
...
...
I0 20 • 40 50 60 400 hPa 1010 hPaFigure 3. Ensemble of backward trajectories released
on August 5, 1999 at 10 UTC in the area of the CO
maximum. Large frame: horizontal displacement and pressure. Small frame: pressure as function of time. The shaded area corresponds to August 4 from 1 to
12 UTC.
tion was initialized on August 1, 1999 at 0 UTC and car-
ried out with a horizontal resolution of 60 km on 62 x 62 grid points centered at 0 ø and 51øN (Fig. 1). In the ver-
tical a terrain-following coordinate system is used with 71 unequally spaced levels from the surface up to 16 km. A high vertical resolution of 40-80 m is applied for the ABL and ,-0 300 m for the lower and free troposphere. For initial and boundary conditions ECMWF analyses
inite transport algorithm ILarore et al, 1998]. The convection parameterization is based on the Ix'ain and Fritsch [1993] scheme and the turbulence scheme follows Bougeault and Lacarr•re [1989]. The presented simula-
0.012
•"•'•'-, '•-•
0.010•
i• 0.008
vertical cross section at y = 15.03/08/12 UT 240.0 E 0,006 I
•2o.o = 0.004 ' 200.0 '•o
.,,..•,•o
,80.0
0.002
/•• / // /•, ,,oo
/ ? •
h
time
[mini
8O.O[Je
• •
• •'
!40
•
I
' '
•ction
at
y = 40,
05/08/12
UT
2• 0
• 120
220.0 I,o.
,o.o
•• •
600
700
time [min]800
900
8.vertical cross section at y = 40, 05/08/12 UT
• 140.0
ß •---112o.o
•
100.0
2 •"i'ø
80.0
O. 60.0
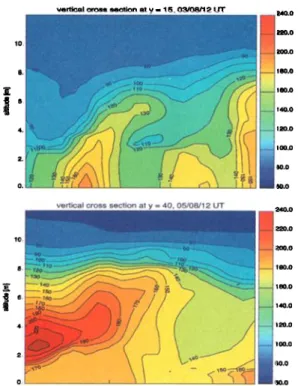
Figure 2. Vertical cross sections of the CO tracer [ppb]
along the white lines marked in Fig. 1.
10
Figure 4. Comparison between specific humidity (up- per frame) and CO (lower frame) measured along the flight track (blue) and specific humidity and CO passive tracer as calculated by the model (red). The black line
KOWOL-SANTEN ET AL' VERTICAL TRANSPORT IN THE TROPOSPHERE 2909
with the spectral resolution T213 and 50 hybrid levels are used.
In order to analyze the vertical transport from the ABL to the FT a CO-like passive tracer and an ABL tracer were implemented into the Mdso-NH model. The CO
tracer distribution was calculated using as initial back-
ground and as boundary conditions monthly means for August 1999 calculated by the global model MOZART
[Hauglustaine
et al., 1998] and EMEP CO emissions
[Berge et al., 1997] with a temporal resolution of 1 h.
For the analysis of the impact of CO emissions on the
FT a CO emission tracer (initialized to zero at the beginning) was transported separately. The boundary layer tracer was initialized to a constant value through- out the ABL. The ABL height was defined as the height
at which the Richardson number was smaller than 0.05.
As a second tool for the analysis of transport pro- cesses and the interpretation of the measurements, three- dimensional trajectory calculations were performed us- ing the wind fields from Mdso-NH with a temporal res-
olution of 1 h.
4. Model results and trajectory analysis
Figure 1 shows as an example the horizontal distri- bution of the CO passive tracer at --• 3 km on August 3 at 12 UTC and August 5 at 12 UTC. Figure 2 dis-
plays two vertical cross sections at the same dates. The
tracer field reveals on August 3 an uplifting of western
European emissions (Fig. 2, upper panel) and a north-
ward transport ahead of and along the cold front to-
wards central UK and the Atlantic (Fig. 1). At the same time central and eastern European emissions are transported north-westwards (Fig. 1). Ensembles of
four day 3D backward trajectories terminating in the morning hours of August 5 in the FT between 6.5 and 7.5 km in the area of the southern part of the flight track all indicate rapid ascent of up to 6500 m dur- ing the previous 48 to 60 hours along and ahead of the
cold front (Fig. 3). As shown by meteosat images, this
ascent occurred within a cloud system extending over north-western Spain and the Bay of Biscay. As a result of this uplifting of polluted airmasses within the WCB
the vertical cross section of the CO tracer reveals over
central UK on August 5 a polluted layer between 1.5 and 6 km altitude with a maximum exceeding 220 ppb
between 2 and 4 km (Fig. 2, lower panel).
Table 1. Percentages of the ABL passive tracer in
the FT, above 4 km and above 6 km in the area of the WCB. day / hour FT [%] > 4 km [%] > 6 km [%] 3/8, 00 UTC 21.4 3.4 1.5 3/8, 12 UTC 30.4 10.3 4.7 4/8, 00 UTC 49.7 21.4 9.8 4/8, 12 UTC 70.1 45.2 26.5 5/8, 00 UTC 66.3 41.3 21.2 5/8, 12 UTC 64.2 38.9 18.4 lOO 8o • 6o o o 40 2o
free
trc
poshere
> 4 km
..,
!...,,.,.,_.
..,'
03/12 UTC 04/12 UTC 05/12 UTC
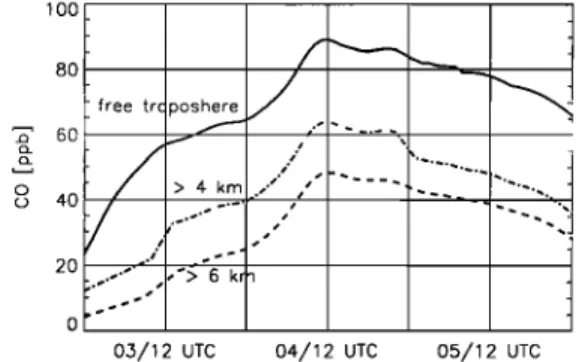
Figure 5. Temporal
evolution
of the mean
mixing
ratio
of the CO emission tracer in the free troposphere from August 3, 1999 at 0 UTC to August 5, 1999 at 18 UTC.
As an example
of the model validation
the compari-
son between
measured
and modeled
values
of specific
humidity
and CO are displayed
in Figure 4. The spe-
cific humidity
shows
an excellent
agreement
between
the
main features at all flight altitudes, in particular in the
FT between 4 and 7 km altitude.
Four peaks of CO exceeding 140 ppb were observed at
different
altitudes
along
the flight track and well repro-
duced by the model (Fig. 4). In this paper we con-
centrate on the first maximum, which was measured
north of Wales in the FT at an altitude of --• 6.7 km
(Fig. 1). The strong northeastward
ascent,
the me-
teosat pictures, the tracer flow and the position of the cold front lead to the conclusion that the WCB is the mechanism responsible for the uplifting of pollutants to-
wards the FT over central and western UK. The three
other maxima of CO were observed within the central
and eastern European plume north-west of Scotland at
altitudes
of--• 1.7 km, 1.3 km and 2.2 km (Fig. 1). The
temporal shift of --• 10 min between the first measured
and modeled
CO maximum (Fig. 4) corresponds
to a
horizontal distance of --• 50 km which is smaller than
one grid box and therefore within the uncertainty of the model resolution. We conclude that the spatial and
temporal resolution of the model is appropriate for this
case study since the model reproduces remarkably well the observed features at all flight levels. These results give an overall confidence in the model's performance in
simulating meteorological parameters and tracer trans-
port in the ABL as well as in the FT.
5. Tracer budget calculations
In order to estimate the amount of exchange between
the FT and the ABL and to understand to what ex-
tent the tracer distribution in the FT is governed by
dynamics independent of the spatial and temporal vari- ation of emissions a boundary layer tracer was initial- ized on August 2, 1999 at 12 UTC in addition to the
CO tracer. The initialisation time was chosen accord-
ing to the time when the backward trajectories shown in
Figure 3 reached the ABL. The tracer was transported
2910 KOWOL-SANTEN ET AL.: VERTICAL TRANSPORT IN THE TROPOSPHERE
(• 4 x10⁶km
2, Fig. 1) was determined
calculating
3D
trajectories [Wernli and Davies, 1997; Stohl, 2001]. It
covers the region of the frontal system where the trajec-
tories reveal an ascent from the ABL to the FT of more
than 3000 m. In this area the fluxes out of the ABL
were summed up and corrected by the in- and outflow of this domain, integrated since the initialisation time and compared to the initial tracer mass in the ABL
(Tab. 1). The temporal evolution shows a maximum of • 70% on August 4 at 12 UTC. This corresponds to the
time of strongest uplifting also evident from trajectory
calculations (Fig. 3). About 45% of the ABL tracer are
transported above 4 km, 27% above 6 km.
In order to analyze the impact of emissions on the FT budget calculations of the CO emission tracer were car- ried out. Figure 5 shows the mean mixing ratio of
the CO emission tracer in the FT in the area of the
WCB as function of simulation time. The strongest in- crease occurred from August 3 at 0 UTC to August 4 at 12 UTC due to the upward and northward transport of the Spanish emissions, the northwestward transport of the French emissions and the upward transport of
the British emissions. These calculations result in an increase in the mean concentration of the CO emission
tracer in the FT from an initial value of 0 ppb to a max- imum of of • 90 ppb on August 4 at 12 UTC. Above
6 km the emission tracer reaches a maximum mean con-
centration of 50 ppb, which amounts to • 50%-70% of the background CO concentration.
6. Conclusions and perspectives
In this work we present a first attempt of evalua- tion of vertical tracer transport in a mesoscale model associated with a frontal system. The CO and humid- ity structures observed along the flight track are well reproduced by the model allowing to use the passive tracer for budget studies. The results show that verti- cal uplifting of boundary layer air is very important for the budget of chemical species in the FT. In the pre- sented case study up to •0 70% of the ABL tracer are transported from the ABL to the FT in the area of the WCB. As a result of this uplifting the CO mixing ratio increases in the FT by • 70%-100% in this case study
simulation.
A question which deserves further investigation con- cerns the representativity of this study. It is necessary to analyze more cases in order to achieve statistically significant results. This work opens the possibility to
use mesoscale models as a benchmark for the validation of larger scale models (GCMs) which then in turn could
be used for climatological studies.
Acknowledgments. The EC DG 12 is acknowledged
for funding this project in the frame of the IV frame-
work program (ENV4-CT97-0525). We are grateful to the
MAXOX consortium for providing the measurements and in particular to the mission and aircraft scientists of this flight S. Penkerr, P.H. Plantevin and A. Kaye.
References
Berge, E., MSC-W Status Report 1997, Emissions, disper- sion and trends of acidifying and eutrophying agents, Nor- wegian Meteorol. Instit., Oslo, Norway, 1997.
Bethan, S., G. Vaughan, C. Gerbig, A. Volz-Thomas, H. Richer, and D. Tiddeman, Chemical air mass differ- ences near front, J. Geophys. Res., 103, 13,413-13,434,
1998.
Bougeault, P., P. Lacarrare, Parameterization of orogra- phy induced turbulence in a mesobeta-scale model. Mon.
Weather Rev., 117, 1872-1890, 1989.
Hauglustaine, D.A., G.P. Brasseur, S. Walters, P.J. Rasch,
J.-F. Muller, C. Granier, X.-X. Tie: MOZART: a global
chemical transport model for ozone and related chemi- cal species, A. Model results and evaluation. J. Geophys. Res., 103, 28,291-28,335, 1998.
Gerbig, C., S. Schmitgen, D. Kley, A. Volz-Thomas, K. Dewey, Haaks, An improved fast-response vacuum- UV resonance fluorescence CO instrument. J. Geophys. Res., 104, 1699-1704, 1999.
Kain, J.S., and J.M. Fritsch, Convective parameterization
for mesoscale models: The Kain-Fritsch scheme. Meteor.
Monographs, 46, 165-170, 1993.
Lafore, J.P., J. Stein, N. Asenico, P. Bougeault, V. Ducrocq,
J. Duron, C. Fischer, P. Hdreil, P. Mascart, V. Masson, J. P. Pinty, J. L. Redelsperger, E. Richard, J. Vila-Guerau de Arellano, The Meso-NH Atmospheric Simulation Sys-
tem. Part I: adiabatic formulation and control simula-
tions. Ann. Geophys., 16, 90-109, 1998.
Liang, J., L. W.. Horowitz, D. J. Jacob, Y. Wang, A.M. Fiore, J. A. Logan, G. M. Gardner, J. W. Munger, Seasonal budgets of reactive nitrogen species and ozone over United States and export fluxes to the global atmo- sphere. J. Geophys. Res., 103, 13435-13450, 1998. Liu, S.C., M. Trainer, F.C. Fehsenfeld, D.D. Parrish, E.J.
Williams, D.W. Fahey, G. Hfibler, P.C. Murphy, Ozone production in the rural troposphere and the implications
for regional and global ozone distributions. J. Geophys.
Res., 92, 4191-4207, 1987.
Stohl, A., A one-year Lagrangian "climatology" of
airstreams in the northern hemisphere troposphere and lowermost stratosphere. J. Geophys. Res., 106, 7263-7279,
2001.
Wernli, H. and H. C. Davies, A Lagrangian-based analysis of extratropical cyclones. I: The method and some appli- cations. Q. J. R. Meteorol. $oc., 123, 467-489, 1997. J. Kowol-Santen and M. Beekmann, Service d'Adronomie
(UMR 7620), Universit• Pierre et Marie Curie, Tour 15 -
5•me •tage, case 102, 4 Place Jussieu, 75252 Paris Cedex 05,
France. (e-mail: [email protected], [email protected]) (Received January 24, 2001; revised May 11, 2001;