HAL Id: hal-00304160
https://hal.archives-ouvertes.fr/hal-00304160
Submitted on 19 May 2008HAL is a multi-disciplinary open access
archive for the deposit and dissemination of sci-entific research documents, whether they are pub-lished or not. The documents may come from teaching and research institutions in France or abroad, or from public or private research centers.
L’archive ouverte pluridisciplinaire HAL, est destinée au dépôt et à la diffusion de documents scientifiques de niveau recherche, publiés ou non, émanant des établissements d’enseignement et de recherche français ou étrangers, des laboratoires publics ou privés.
Observations of mesoscale and boundary-layer
circulations affecting dust uplift and transport in the
Saharan boundary layer
J. H. Marsham, D. J. Parker, C. M. Grams, W. M. F. Grey, B. T. Johnson
To cite this version:
J. H. Marsham, D. J. Parker, C. M. Grams, W. M. F. Grey, B. T. Johnson. Observations of mesoscale and boundary-layer circulations affecting dust uplift and transport in the Saharan boundary layer. Atmospheric Chemistry and Physics Discussions, European Geosciences Union, 2008, 8 (3), pp.8817-8846. �hal-00304160�
ACPD
8, 8817–8846, 2008 Observed boundary-layer/mesoscale impacts on Saharan dust J. H. Marsham et al. Title Page Abstract Introduction Conclusions References Tables Figures ◭ ◮ ◭ ◮ Back Close Full Screen / EscPrinter-friendly Version Interactive Discussion Atmos. Chem. Phys. Discuss., 8, 8817–8846, 2008
www.atmos-chem-phys-discuss.net/8/8817/2008/ © Author(s) 2008. This work is licensed
under a Creative Commons License.
Atmospheric Chemistry and Physics Discussions
Observations of mesoscale and
boundary-layer circulations affecting dust
uplift and transport in the Saharan
boundary layer
J. H. Marsham1, D. J. Parker1, C. M. Grams2, W. M. F. Grey3, and B. T. Johnson4
1
School of Earth and Enviroment, University of Leeds, Leeds, UK 2
Institut f ¨ur Meteorologie und Klimaforschung, Universit ¨at Karlsruhe (TH), 76128 Karlsruhe, Germany
3
Climate and Land Surface Systems Interaction Centre, School of the Environment and Society, Swansea, SA2 8PP, UK
4
The Met Office, Fitzroy Road, Exeter, EX1 3PB, UK
Received: 16 November 2007 – Accepted: 7 April 2008 – Published: 19 May 2008 Correspondence to: J. H. Marsham ([email protected])
ACPD
8, 8817–8846, 2008 Observed boundary-layer/mesoscale impacts on Saharan dust J. H. Marsham et al. Title Page Abstract Introduction Conclusions References Tables Figures ◭ ◮ ◭ ◮ Back Close Full Screen / EscPrinter-friendly Version Interactive Discussion
Abstract
Observations of the Saharan boundary layer, made during the GERBILS field cam-paign, show that mesoscale land surface temperature variations (which were related to albedo variations) induced mesoscale circulations, and that mesoscale and boundary-layer circulations affected dust uplift and transport. These processes are
unrepre-5
sented in many climate models, but may have significant impacts on the vertical trans-port and uplift of desert dust. Mesoscale effects in particular tend to be difficult to parameterise.
With weak winds along the aircraft track, land surface temperature anomalies with scales of greater than 10 km are shown to significantly affect boundary-layer
temper-10
atures and winds. Such anomalies are expected to affect the vertical mixing of the dusty and weakly stratified Saharan Air Layer (SAL). Mesoscale variations in winds are also shown to affect dust loadings in the boundary-layer. In a region of local uplift, with strong along-track winds, boundary-layer rolls are shown to lead to warm moist dusty updraughts in the boundary layer. Large eddy model (LEM) simulations suggest that
15
these rolls increased uplift by approximately 30%. The modelled effects of boundary-layer convection on uplift is shown to be larger when the boundary-boundary-layer wind is de-creased, and most significant when the mean wind is below the threshold for dust uplift and the boundary-layer convection leads to uplift which would not otherwise occur.
1 Introduction
20
Mineral dust uplifted from deserts is an important component of Earth’s climate system. The dust has a direct effect on the radiation budget (e.g.Haywood et al.,2005), and this affects atmospheric dynamics (Tompkins et al.,2005;Jones et al.,2004;Perez et al., 2006). Dust provides nuclei for ice formation in clouds (Field et al.,2006), can affect cloud organisation (Stephens et al.,2004), and provides iron essential for
phytoplank-25
ton (Mahowald et al.,2005). Efforts to model the transport of desert dust in regional 8818
ACPD
8, 8817–8846, 2008 Observed boundary-layer/mesoscale impacts on Saharan dust J. H. Marsham et al. Title Page Abstract Introduction Conclusions References Tables Figures ◭ ◮ ◭ ◮ Back Close Full Screen / EscPrinter-friendly Version Interactive Discussion and global models are, however, still in their infancy (Woodward,2001;Cakmur et al.,
2006;Mahowald et al.,2006;Zakey et al.,2006).
The Sahara desert is the largest source of mineral dust in the atmosphere (approx-imately 60%, Tanaka and Chiba,2006), but is a very poorly observed region. Over the Sahara, large surface sensible heat fluxes and deep dry convection can result in a
5
summertime boundary layer that is up to 6 km deep (Gammo,1996). However, profiles from the Sahara in summer typically show a shallower active boundary layer, with the near neutrally stratified Saharan air layer (SAL) between this and a strong inversion at approximately 5.5 km. As discussed by (Parker et al., 2005), the SAL itself often contains distinct layers with different water vapour contents. The deep dry SAL layer
10
allows much of the Saharan dust plume to avoid rain-out over the Atlantic, allowing the dust to be transported globally.
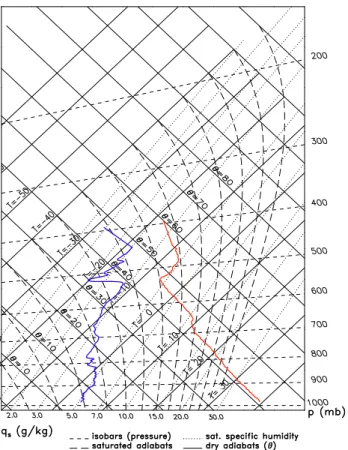
Figure 1 shows an example of the stratification of the SAL. The profile shows five distinct layers below the lid at 520 hPa, each essentially internally well mixed with a different water vapour mixing ratio (WVMR). Layers are separated by inversions, many
15
of which are very weak (less than 1 K), and the strongest of which is 3 K (at ≃650 hPa). This weak stratification of the SAL means that even small anomalies in the surface heating may significantly affect the growth of the active boundary layer into the SAL. We expect land surface variations in desert regions to affect surface fluxes and induce mesoscale circulations (Segal and Arritt,1992). These may therefore affect the vertical
20
transport, and perhaps uplift, of desert dust.
Observations of convective plumes and vortices from Arizona, USA (Koch and Renno, 2005) and large eddy modelling of the Gobi desert (Takemi et al., 2006) suggest that boundary-layer convection uplifts significant quantities of desert dust. Washington et al.(2006) also showed that during the morning in the Bodele
depres-25
sion boundary-layer convection mixes momentum from the nocturnal jet downwards, which results in dust uplift.Cakmur et al.(2004) showed that allowing the sub-grid fluc-tuations in the boundary layer implicit in a global model to affect dust uplift improved the modelled dust distribution and using Meteosat Second Generation observations
ACPD
8, 8817–8846, 2008 Observed boundary-layer/mesoscale impacts on Saharan dust J. H. Marsham et al. Title Page Abstract Introduction Conclusions References Tables Figures ◭ ◮ ◭ ◮ Back Close Full Screen / EscPrinter-friendly Version Interactive Discussion Chaboureau et al.(2007) observed a diurnal cycle in dust coverage over the Sahara,
with its maximum at 15:00 UTC, which they linked to boundary-layer activity. These re-sults all show that small scale variations in boundary-layer winds are important for dust uplift and transport. However, such mesoscale and boundary-layer processes are not resolved, and often not represented, in climate models. In addition, there are very few
5
published observations of these processes, and perhaps none in the western Sahara. The GERBILS (GERB Intercomparison of Longwave and Shortwave radiation) field campaign, which took place in June 2007, aimed to understand the differences between modelled and observed outgoing radiative fluxes in the western Sahara (Haywood et al.,2005). Seven flights took place between Niamey (Niger) and
Nouak-10
chott (Mauretania), providing significant amounts of data, from this poorly observed region. Stratifications in dust loadings in the SAL (similar to the stratification in WVMR shown in Fig.1) were often observed during the campaign.
Two flights from GERBILS provided long legs within the Saharan boundary layer; these were on the 27th and 28th June 2007 (B301 and B302). The objective of this
15
paper is to show the impacts of land surface variations on the boundary layer and boundary-layer convection on dust loadings, which were observed during these flights. Section2 describes the data, models and methods used and Sects. 3.1 and 3.2 de-scribe the observations from B302 and B301 respectively.
2 Data, model and methods used
20
2.1 Observations
A large array of instruments was present on the FAAM BAe146 aircraft during GER-BILS. In addition to standard meteorological parameters of temperature, humidity and winds, this paper makes use of measurements of: (i) downwelling and upwelling solar radiation (allowing solar albedo to be calculated), (ii) nephelometer scattering, and (iii)
25
upwelling infrared radiation measured using a broadband Heimann radiometer. Neph-8820
ACPD
8, 8817–8846, 2008 Observed boundary-layer/mesoscale impacts on Saharan dust J. H. Marsham et al. Title Page Abstract Introduction Conclusions References Tables Figures ◭ ◮ ◭ ◮ Back Close Full Screen / EscPrinter-friendly Version Interactive Discussion elometer scattering was dominated by dust, and was observed at red, green and blue
wavelengths. In this paper the nephelometer data are used as an indicator of dust loadings, and only blue data are shown, since differences between the three chan-nels were small. The nephelometer measures aerosol scattering coefficient, i.e. the scattering cross-sectional area of the aerosols per unit volume of air.
5
All the Heimann radiometer data discussed in this paper were from low-level flights at constant altitudes, where variations in atmospheric absorption are expected to have small effects, and be slowly varying. The remaining variations in brightness temper-atures (BTs) from the Heimann radiometer are from variations in land surface tem-peratures (LSTs) and emissivities. Heimann BTs were significantly anticorrelated with
10
albedo (Sect. 3.1). This shows that a significant component of the BT signal is from variability in LSTs (since in the cloud-free conditions discusssed darker surfaces are expected to lead to increased LSTs). Furthermore, in this paper boundary-layer virtual potential temperatures are shown to be coherently related to Heimann BTs. Any vari-ations in land emissivity will have tended to mask rather than generate this coherency,
15
so in such cases the Heimann BTs are assumed to relate to LSTs.
Low level legs during GERBILS were flown at constant pressure levels. The low level leg from B302 was at 600 to 700 m above mean sea level (MSL), or 300 to 500 m above the ground level (AGL). Aircraft profiles and the COSMO simulations showed that the top of the boundary layer was between 900 and 1400 m above MSL, so the flight was
20
in the lower half of the boundary layer. Therefore we expect to observe convergence in the boundary-layer winds over warm surface anomalies. The low level leg from B301 was near the top of the boundary-layer; the flight was 950 m above MSL and the COSMO model showed the top of the boundary layer at approximately 1200 m (aircraft profiles on this day were affected by either the monsoon or the cold pool outflows).
25
2.2 The COSMO and LEM models
Version 3.19 of the COSMO (Consortium for Small-scale Modeling) model (Doms and Sch ¨attler,2002), from the Deutscher Wetterdienst (DWD), was run over a domain
ACPD
8, 8817–8846, 2008 Observed boundary-layer/mesoscale impacts on Saharan dust J. H. Marsham et al. Title Page Abstract Introduction Conclusions References Tables Figures ◭ ◮ ◭ ◮ Back Close Full Screen / EscPrinter-friendly Version Interactive Discussion tending from 17◦W to 2◦E and 13◦N to 23◦N. COSMO is a non-hydrostatic model, and
the model equations for fully compressible flow in a moist atmosphere are formulated in rotated geographical coordinates and a generalised terrain following height coordinate. The horizontal grid-spacing was 0.0625◦(approximately 7 km) and 35 levels were used in the vertical (grid-spacing of approximately 10 m at the lowest model levels). Land
5
use data, from DWD, were on the same 0.0625◦ grid as the model. The model was initialised using operational analyses from the ECMWF (European Centre for Medium Range Weather Forecasts) global model, which has a 0.25◦ horizontal grid-spacing, and lateral boundaries were taken 3 hourly from the ECMWF operational forecasts.
Version 2.4 of the Met Office large eddy model (LEM,Gray et al.,2001) was used to
10
simulate the convection within the Saharan boundary layer for B301. Since in the region of interest the aircraft was at low-level no observed profiles were available, and the LEM was initialised with a profile from the COSMO simulation (12:00 UTC, 18◦N 7.5◦W). Small perturbations were added to the model to allow boundary-layer convection to develop, surface fluxes from the COSMO model were applied, and the mean wind
15
profile was relaxed towards the profile from the COSMO model (to account for large scale forcings). A three-dimensional 20 km by 20 km by 20 km domain was used with horizontal grid-spacings of 200 m, and vertical grid-spacings of 50 m in the boundary-layer. Gravity wave damping was applied above 13 km and the model uses a rigid base and lid and periodic lateral boundary conditions.
20
2.3 Cospectral analysis
The significance of the coherences between observed variables was determined as a function of spatial scale using spectral analysis (e.g.Matthews and Madden,2000; Taylor et al.,2007). The coherency between two Fourier transforms can be described as a spectral version of the correlation function, and is based on the product of one
25
spectrum with the complex conjugate of the other. In order to infer significance, it is necessary to smooth this product over a range of wavenumbers (the bandwidth); here a running mean has been employed. A larger bandwidth increases the spectral sampling
ACPD
8, 8817–8846, 2008 Observed boundary-layer/mesoscale impacts on Saharan dust J. H. Marsham et al. Title Page Abstract Introduction Conclusions References Tables Figures ◭ ◮ ◭ ◮ Back Close Full Screen / EscPrinter-friendly Version Interactive Discussion but reduces the resolution at which wavenumber-dependent effects can be identified.
The result is normalised by the smoothed amplitudes of the original spectra to deduce the coherency, which takes values between zero (not coherent) and one (coherent). Statistical significance can be inferred from the coherency by considering the expected coherency of white-noise signals as a simple function of bandwidth (Julian,1975). The
5
technique also allows the phase difference for this coherency to be determined, as well as the “gain” i.e. the variation in one variable as a function of variations in another with which it is coherently related.
3 Results
Figure2shows the power spectra of variables observed during B301 and B302. These
10
are plotted askE (k), where k is the wavenumber, so that the area under the curve is
proportional to the variance and a peak in the curve shows a significant contribution to the variance at that wavenumber (Jonker et al.,1999). For B302 the main peak in the power spectrum of vertical winds occurs at a scale of approximately 2 km, which, as expected, is of the order of the boundary-layer depth. Variations in virtual potential
15
temperature (θv) and WVMR are dominated by larger scale contributions, particularly for WVMRs. For these variables the contributions on the scales of boundary-layer processes are still significant however, and a spectral-gap (Van der Hoven, 1957) is observed at approximately 20 km, between these boundary-layer scales and the larger scales.
20
The spectra for B301 are similar to those from B302, except that there are much more significant mesoscale contributions to the power spectrum of vertical winds (there are peaks at approximately 2, 3.5 and 9 km), and the boundary-layer scale contributions to variance in WVMR are much more significant (the peak at 9 km is also clear in the WVMR spectrum). As discussed in Sect. 3, this greater contribution for B301 at
25
scales between 1000 m and 20 km is thought to be due to the flight-path being oriented approximately along the axes of boundary-layer rolls.
ACPD
8, 8817–8846, 2008 Observed boundary-layer/mesoscale impacts on Saharan dust J. H. Marsham et al. Title Page Abstract Introduction Conclusions References Tables Figures ◭ ◮ ◭ ◮ Back Close Full Screen / EscPrinter-friendly Version Interactive Discussion 3.1 Flight B302, 28th June 2007
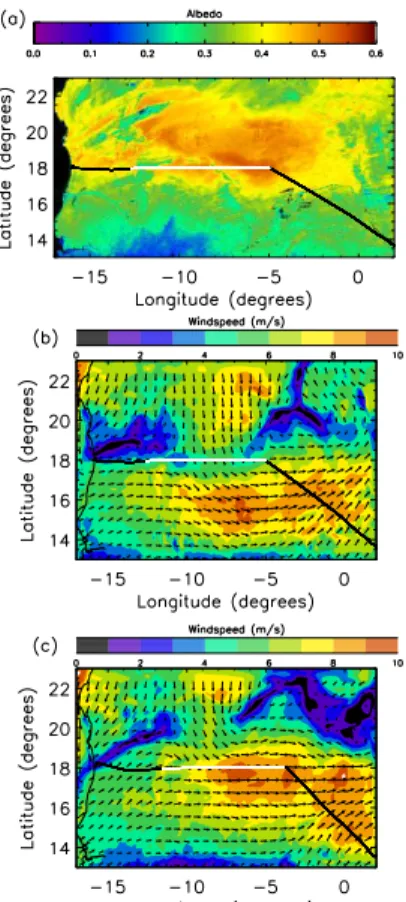
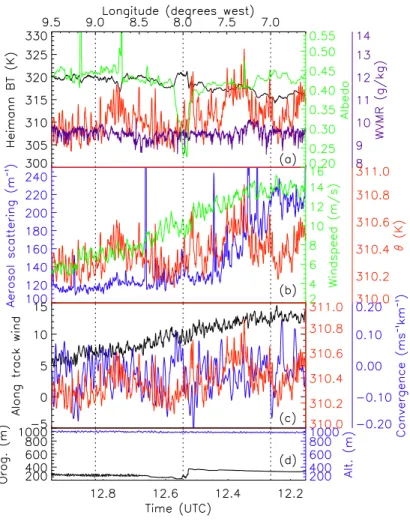
Figure3a shows the low level transect of B302 and surface albedo derived from MODIS satellite data (Gao et al.,2005and Houldcroft et al., 20081). This shows that the flight crossed an area with a variety of albedo features, which is typical of the western Sa-hara. One particular albedo feature, at 8◦W, stands out in the aircraft data (Fig. 4a,
5
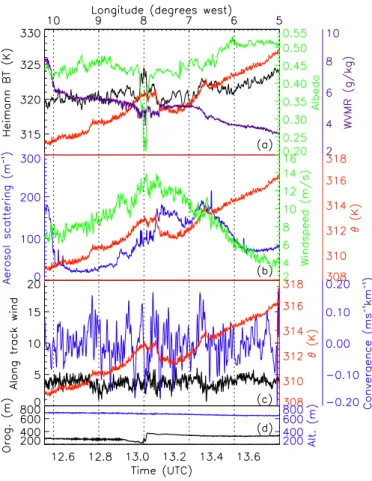
green line). This can be seen in the MODIS data (Fig.3a) and was from a rocky val-ley and escarpment, with a minimum albedo of approximately 0.2, compared with the surrounding sandy desert with an albedo of 0.45 (Fig.4a, green line). An increase in brightness temperature (BT) measured by the Heimann radiometer was also observed at 8◦W (Fig.4a, black line). This can be assumed to correspond to an increase in land
10
surface temperature (LST), which is consistent with the albedo anomaly. This high LST appears to have locally increased the potential temperature of the boundary layer at this location by approximately 2 K (Figs.4a, b and c, red lines).
This 2 K perturbation in boundary-layer potential temperature has the potential to significantly affect the vertical mixing of the SAL, since the SAL is weakly stratified
15
(e.g. Fig.1). Other similar, but smaller, albedo features can also be seen in Fig. 4a, for example at 6.7, 7.7 and 9.2◦W. For these features there is some evidence of con-vergence in the along track winds (Fig.4c, blue line). The effects of these land surface variations on the boundary layer are investigated more quantitatively using spectral analysis (below).
20
West of 9.5◦W the air is moist and dusty (Figs. 4a and b, purple and blue lines). Simulations performed using the COSMO model showed this was from the monsoon flow (Fig.3b). Between 6◦ and 9◦W the nephelometer data (Fig.4b, blue line) shows an area of increased dust loadings. This peak in low-level dust loadings is east of the position of the local maximum in windspeed. The maximum low-level winds upstream
25
1
Houldcroft, C. J., Grey, W. M. F., Barnsley, M. J., Taylor, C. M., and Los, S. O.: “New Vegetation Albedo Parameters and Global Fields of background Albedo derived from MODIS for use in a climate model”, submitted, J. Hydromet., 2008.
ACPD
8, 8817–8846, 2008 Observed boundary-layer/mesoscale impacts on Saharan dust J. H. Marsham et al. Title Page Abstract Introduction Conclusions References Tables Figures ◭ ◮ ◭ ◮ Back Close Full Screen / EscPrinter-friendly Version Interactive Discussion of the flight track lie to the east of the maximum at the latitude of the flight track (Fig.3b).
This suggests that the dust observed is a result of these high windspeeds upstream. However, there appears to be some correlation between observed peaks in windspeed and observed peaks in dust loadings, for example at 8.5, 7.9, 7.7 and 6.7◦W (Fig.4b). This suggests the possibility of significant dust uplift occurring close to the flight track,
5
which is again investigated using spectral analysis.
In order to investigate the effects of the land-atmosphere coupling in the Sahara, data from west of 9.5◦W were rejected, since they were affected by the monsoon flow. For the remaining data cospectral analysis showed that there was a significant relationship between albedo and LST for all scales discussed (i.e. greater than 2.5 km, not shown).
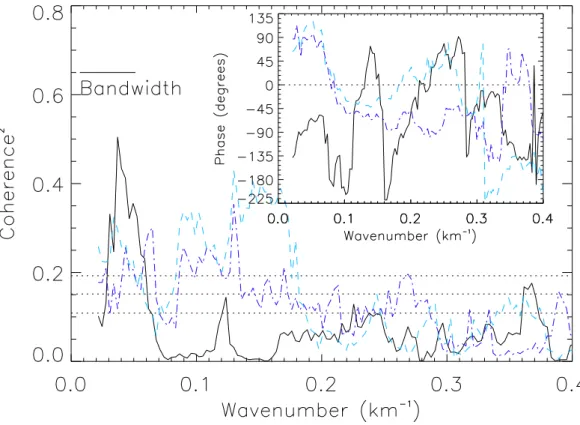
10
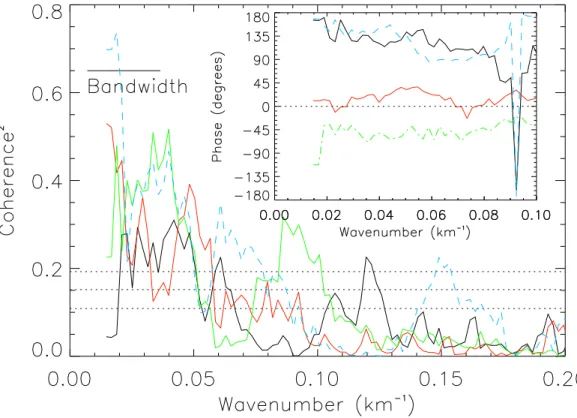
Figure5shows that at scales greater than approximately 10 km (k<0.1 km−1) there is a significant relationship between LST and boundary-layer virtual potential tempera-ture (θv), with the LST anomalies approximately 20◦out of phase with the θv, which is consistent with the along-track winds (≃4 ms−1) resulting in the high buoyancy air being located downstream of the high LSTs. Figure5also shows that there is also a
coher-15
ent relationship between along-track winds andθv at these scales, with convergence towards regions of highθv (a phase difference of approximately 90◦). Analysis also showed a similar coherent relationship between along-track winds and LSTs at these scales (not shown). The derived gains showed LST anomalies affecting along-track winds by 0.25 to 0.5 ms−1K−1(not shown).
20
Figure 5 shows that on these scales (greater than 10 km) the high θv regions are
dry. This may be from increased entrainment of dry air in such regions, or an increased Bowen ratio, or both. Windspeeds were also coherently related toθv on scales greater than 10 km, with their maximum downstream of theθv maximum (approximately −45
◦
out of phase); across-track winds were greater than the along-track winds, so it is
25
possible for the phase of the along-track winds and windspeed to be of opposite signs. The analysis was then restricted to west of 6◦W, restricting the track analysed to the data in the dust plume where local windspeeds were greater than 6 ms−1 and where local uplift is likely to be more significant. Figure8shows that for this region mesoscale
ACPD
8, 8817–8846, 2008 Observed boundary-layer/mesoscale impacts on Saharan dust J. H. Marsham et al. Title Page Abstract Introduction Conclusions References Tables Figures ◭ ◮ ◭ ◮ Back Close Full Screen / EscPrinter-friendly Version Interactive Discussion variations in dust loadings depended on mesoscale variations in windspeed, for scales
greater than 10 km (k<0.1 km−1). If data from 5◦ to 6◦W were included then this rela-tionship was still significant, but less clear. Restricting the analysis to west of 6◦W also showed that on scales of greater than 20 km regions of increased θv were also less dusty (not shown), possibly from entrainment of less dusty drier air in these regions, or
5
from reduced dust uplift over darker rockier surfaces. It was not possible to unambigu-ously relate dust and LSTs, however; this is unsurprising given that the maximum dust uplift occurred upstream of the flight track, and the effects of land-surface itself on the potential for dust uplift.
3.2 Flight B301, 27th June 2007
10
B301 provided another long leg through the Saharan boundary layer, following a very similar path to B302 (Fig. 3), but the monsoon affected regions east of 6.6◦W and west of 9.5◦W. Along-track winds were higher during B301 than B302 (approximately 10 ms−1 compared with 4 ms−1) and this is expected to decrease the effects of LST anomalies on boundary-layer temperatures and winds (Segal and Arritt,1992).
15
Figure7shows windspeeds (which are dominated by the along-track winds) increas-ing from west to east, which is consistent with the COSMO simulation (Fig.3c). Dust loadings west of 8.8◦W were low, but are observed to increase towards the east with the increasing windspeeds (Fig. 7b). Since windspeeds upstream were lower than those at the point of observation, the observed dust must be from local uplift. The low
20
albedo escarpment at 8.0◦W again led to an increased Heimann BT (Fig.7a), and ef-fects on the BT from low albedo features can be seen at 8.7 and 7.0◦W. Figure8shows the details of the observations from 8.0◦W. A region of high buoyancy (θv, red line) is observed downstream of the LST anomaly (this is further downstream than shown for B302 due to the larger along-track winds, Figs.4and8). This corresponds to a region
25
of divergence in along-track winds (Fig.8c, expected since the flight was near the top of the boundary layer). The magnitude of the perturbation to the boundary-layer po-tential temperature (≃0.5 K) again has the popo-tential to significantly affect the vertical
ACPD
8, 8817–8846, 2008 Observed boundary-layer/mesoscale impacts on Saharan dust J. H. Marsham et al. Title Page Abstract Introduction Conclusions References Tables Figures ◭ ◮ ◭ ◮ Back Close Full Screen / EscPrinter-friendly Version Interactive Discussion mixing of the weakly stratified SAL (Fig.1), but is smaller than observed during B302
(as expected from the greater along-track winds on this day).
Although for B301 there was some statistical significance to the coherency between LSTs,θv and along-track winds in the boundary layer (not shown) this effect was much
less distinct than for B302, as expected from the faster along-track winds. Figure 9
5
does show divergence in the along-track winds associated with high values ofθv on scales larger than 20 km however (B301 was near the top of the boundary layer).
There is a significant relationship between dust and θv on scales larger than
ap-proximately 4 km (k<0.25 km−1), with dust between ±60◦out of phase (Fig.9). WVMR is also related to θv on scales greater than 5 km, and in phase with θv (and vertical
10
winds are significantly related and in phase with θv on all scales). Therefore, Fig. 9
shows moist dusty buoyant updrafts on scales larger than 4 km, which includes the scales of boundary-layer eddies as well as the meoscale (Fig.2). Given the strong along-track winds and the significant mesoscale contribution to the power spectrum of vertical winds on this day this is suggestive of boundary-layer rolls.
15
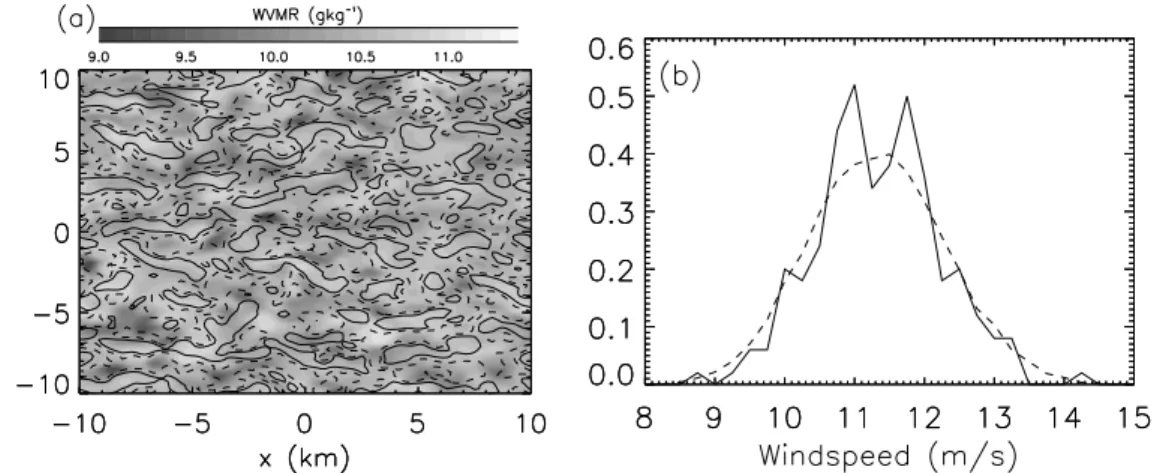
Figure10shows results for the LEM simulation for this day, and confirms that we ex-pect linear boundary-layer structures (i.e. rolls) to form in this strongly sheared bound-ary layer. The roll-spacing of approximately 2.5 km is well resolved by the LEM grid-spacing of 200 m. The rolls are relatively disorganised, but are aligned approximately west-east, approximately along the mean boundary-layer wind, and also along the flight
20
track. If the horizontal mean of the LEM potential temperature profile was relaxed towards that of the COSMO model these rolls became much more linear, but their alignment was unchanged. These rolls explain the significant mesoscale (≃10 km) contributions to the power spectrum of vertical winds for B301 (Fig.2).
Due to the latent heat fluxes moistening the boundary layer at the surface and drying
25
it at its top, updrafts in such rolls are moist (Fig. 10a). The data also show that the updrafts are dusty (Fig.9), consistent with dust uplift at the surface and entrainment of cleaner air above the boundary layer (the Met Office dust forecast model (Woodward, 2001) showed dust loadings decreasing above the boundary layer, and aircraft profiles
ACPD
8, 8817–8846, 2008 Observed boundary-layer/mesoscale impacts on Saharan dust J. H. Marsham et al. Title Page Abstract Introduction Conclusions References Tables Figures ◭ ◮ ◭ ◮ Back Close Full Screen / EscPrinter-friendly Version Interactive Discussion also showed this, although they were affected by cold-pools or the monsoon flow).
During B302 boundary-layer winds were more north-westerly, so the flight would have been across any rolls, and the uplift was more upstream than local (peak windspeeds in the COSMO simulation were upstream); these two factors are expected to make the detection of any roll effects in data from B302 more difficult.
5
Variations in windspeed in the LEM were very similar to those observed (Fig.10b), with a standard deviation of 0.97 ms−1for LEM and 0.87 ms−1for the observations. At 13:00 UTC the windspeeds at the lowest level in the LEM (33 m a.g.l.) varied from 5.4 to 15.8 ms−1, with a mean of 9.9 ms−1. Dust uplift (F) can be parameterised as a function of friction velocity (u∗
) cubed with a threshold friction velocity (u∗
T).Marticorena
10
and Bergametti (1997) Eq. (5) gives,
F α u∗3(1 −R)(1 + R2), (1) whereR=u∗
T/u
∗
.Cakmur et al.(2004) uses the simpler formula,
F α u∗2(u∗
−u∗
T), (2)
foru∗
≥u∗T. In the LEM, for a convective boundary layer,
15
u∗
= k.u1/(l og(z/z0) −ψ)), (3)
whereu1is the wind velocity at the lowest model level (z1),z0is the roughness length
of the surface, k is the von Karman constant, and ψ accounts for the stability (Gray et al.,2001). Therefore, for a constant surface roughness, neglecting effects from any spatial variations in the stability (which are expected to be significantly smaller than
20
the effects from the spatial variations in the wind) u∗ is proportional tou1 (as used by
Cakmur et al., 2004). We can therefore obtain an estimate of the effects of the roll circulations on dust uplift by comparing the rates calculated using the LEM winds from the lowest model level, and rates calculated from the windspeed derived from the mean wind velocities in the lowest model level (using Eqs.1and2).
25
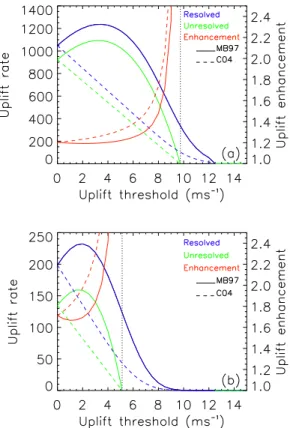
Cakmur et al. (2004) suggests that 10 m windspeed thresholds for dust uplift in the Sahara are typically 8 to 10 ms−1. For B301, Fig. 11a shows that the modelled
ACPD
8, 8817–8846, 2008 Observed boundary-layer/mesoscale impacts on Saharan dust J. H. Marsham et al. Title Page Abstract Introduction Conclusions References Tables Figures ◭ ◮ ◭ ◮ Back Close Full Screen / EscPrinter-friendly Version Interactive Discussion boundary-layer rolls increase dust uplift by approximately 14% for a zero threshold and
this increases as the threshold increases, with the details depending on whether the uplift parametrisation ofMarticorena and Bergametti(1997) orCakmur et al.(2004) is used. An uplift threshold of 8 ms−1(Cakmur et al.,2004) results in an enhancement of 30%. The enhancement of uplift is greatest when the mean wind is just less than the
5
threshold and the rolls give significant uplift that would not otherwise occur. If the mean horizontal winds in the LEM are decreased by a factor of two, the uplift enhancement is increased, with a minimum enhancement of 70% (Fig.11b). This occurs since the windspeed variations from boundary-layer convection become more significant as the speed of the mean boundary-layer wind is decreased. These effects of boundary-layer
10
circulations on dust uplift are not included in any global model where modelled dust uplift is a function ofu∗
, andu∗
depends on the resolved wind so thatu∗
tends to zero as the resolved wind tends to zero.
It is not clear to what extent parametrisations and thresholds used byCakmur et al. (2004) andMarticorena and Bergametti(1997) are applicable on the small spatial and
15
temporal scales resolved by the LEM. Therefore the quantitative details of the enhance-ment discussed above remain somewhat uncertain. In addition, scales smaller than those by the LEM may be significant for dust uplift. However, despite these uncer-tainties, the observations of moist dusty updraughts in boundary-layer rolls, and the estimated enhancement of uplift, support the other existing evidence that
boundary-20
layer convection plays a significant role in driving dust uplift (Cakmur et al.,2004;Koch and Renno,2005;Takemi et al.,2006).
4 Conclusions
Results from low level flights made during the GERBILS field campaign have been used to demonstrate the effects of: (i) mesoscale land surface temperature (LST) anomalies
25
(which were related to albedo anomalies) on the virtual potential temperatures and winds in the boundary layer, (ii) mesoscale wind variations on dust loadings, and (iii)
ACPD
8, 8817–8846, 2008 Observed boundary-layer/mesoscale impacts on Saharan dust J. H. Marsham et al. Title Page Abstract Introduction Conclusions References Tables Figures ◭ ◮ ◭ ◮ Back Close Full Screen / EscPrinter-friendly Version Interactive Discussion boundary-layer circulations (linear rolls) on dust uplift and transport. Figure12shows
a schematic of the mesoscale processes observed.
These boundary-layer and mesoscale processes are unrepresented in many climate models, but are expected to have significant impacts on the uplift and vertical transport of desert dust. Mesoscale effects in particular are difficult to parametrise such models
5
(for example,Zheng and Pielke,1995).
On a day with high windspeeds (≃10 ms−1), but relatively weak along-track winds (≃4 ms−1), land surface albedo and temperature anomalies of scales greater than 10 km generated significant perturbations in buoyancy in the boundary layer (up to ap-proximately 2 K). These anomalies were shown to lead to convergence in the
boundary-10
layer winds on these scales, and are expected to affect vertical mixing of the SAL, and so dust transport. This is consistent with the observed anti-correlation between WVMRs and θv on these scales, which may be from increased entrainment drying of the boundary layer, or an increased Bowen ratio of the land surface. Mesoscale (greater than 10 km) variations in boundary-layer dust loadings were also shown to
15
depend on variations in windspeed on these scales. This was most significant where observed windspeeds exceeded 6 ms−1, which presumably allowed dust uplift to occur locally.
On a day with greater along-track windspeeds (≃10 ms−1) and more local dust uplift, the effects of LST anomalies were not as significant. LEM simulations showed that we
20
expect the flight track on this day to have been almost along the axes of boundary-layer rolls, and power spectra of observed vertical winds showed significant mesoscale scale contributions (at approximately 10 km scales) consistent with this. Observations showed warm moist dusty updraughts occurring on scales between 4 and 50 km on this day i.e. on boundary-layer as well as meso-scales. Therefore, these observations
25
show vertical transport of dust by rolls. Assuming an uplift threshold of 8 ms−1, the LEM results showed that the the rolls are expected to have increased dust uplift by approximately 30%, compared with uplift calculated using the mean wind. This en-hancement of uplift by boundary-layer convection is larger for lower boundary-layer
ACPD
8, 8817–8846, 2008 Observed boundary-layer/mesoscale impacts on Saharan dust J. H. Marsham et al. Title Page Abstract Introduction Conclusions References Tables Figures ◭ ◮ ◭ ◮ Back Close Full Screen / EscPrinter-friendly Version Interactive Discussion windspeeds, and most significant when the mean wind is below the threshold for dust
uplift and the convection leads to uplift that would not otherwise occur. The applica-bilities of dust uplift parametrisations and thresholds in the literature to small spatial and temporal scales are not clear, which increases the uncertainty in the details of these enhancement effects. We recommend that the range of the applicability of such
5
parametrisations should be investigated.
Dust loadings in the Saharan Air Layer (SAL) have important effects on climate. For dust to get into the SAL it must be uplifted from the surface and then transported vertically out of the boundary layer. The SAL is only weakly stratified however, so even small (≃1 K) perturbations to boundary-layer temperatures may significantly affect the
10
vertical mixing. These observations show that such variations can be induced by land surface anomalies, but any effects within the SAL could not be evaluated due to an absence of suitable data from between 1 km and the top of the SAL. In addition, no observations were available from days with light winds, when we expect the effects of the mesoscale (Segal and Arritt,1992) and boundary-layer circulations to be increased.
15
We therefore suggest that the impacts of these processes on dust uplift and transport are investigated using numerical modelling, or using observational data not available to us.
Acknowledgements. This project was funded by the Natural Environment Research Council
(NERC: NER/O/S/2002/00971) and AMMA-EU/UK. We would like to thank Jim Haywood (Met
20
Office, UK) for organising the GERBILS field campaign; the staff of FAAM, whose hard work allowed the GERBILS field campaign to run so smoothly; the UK Met Office, for access to dust forecasts from their Crisis Area Model (CAM) and for for providing access to the ECMWF data; Conny Schwierz (University of Leeds, UK) for facilitating access to this ECMWF data, Sarah Jones (Universit ¨at Karlsruhe and Forschungszentrum Karlsruhe, Germany) for enabling use of
25
the COSMO model; Chris Taylor for providing the MODIS soil albedo dataset and finally Ian Brooks and Andrew Ross for useful discussions on boundary-layer dynamics.
ACPD
8, 8817–8846, 2008 Observed boundary-layer/mesoscale impacts on Saharan dust J. H. Marsham et al. Title Page Abstract Introduction Conclusions References Tables Figures ◭ ◮ ◭ ◮ Back Close Full Screen / EscPrinter-friendly Version Interactive Discussion
References
Cakmur, R. V., Miller, R. L., and Torres, O.: Incorporating the effect of small-scale circulations upon dust emission in an atmospheric general circulation model, J. Geophys. Res.-Atmos., 109, D07201, doi:10.1029/2003JD004067, 2004. 8819,8828,8829
Cakmur, R. V., Miller, R. L., Perlwitz, J., Geogdzhayev, I. V., Ginoux, P., Koch, D., Kohfeld,
5
K. E., Tegen, I., and Zender, C. S.: Constraining the magnitude of the global dust cycle by minimizing the difference between a model and observations, J. Geophys. Res.-Atmos., 111, D06207, doi:10.1029/2005JD005791, 2006. 8819
Chaboureau, J. P., Tulet, P., and Mari, C.: Diurnal cycle of dust and cirrus over West Africa as seen from Meteosat Second Generation satellite and a regional forecast model, Geophys.
10
Res. Lett., 34, L02822, doi:10.1029/2006GL027771, 2007. 8820
Doms, G. and Sch ¨attler, U.: A description of the nonhydrostatic Regional Model LM. Part I: Dynamics and Numerics., Consortium for Small-Scale Modelling (COSMO), download at
http://www.cosmo-model.org, 2002. 8821
Field, P. R., Mohler, O., Connolly, P., Kramer, M., Cotton, R., Heymsfield, A. J., Saathoff, H.,
15
and Schnaiter, M.: Some ice nucleation characteristics of Asian and Saharan desert dust, Atmos. Chem. Phys., 6, 2991–3006, 2006, http://www.atmos-chem-phys.net/6/2991/2006/.
8818
Gammo, M.: Thickness of the dry convection and large-scale subsidence above deserts, Bound.-Lay. Meteorol., 79, 265–278, 1996. 8819
20
Gao, F. C., Schaaf, A., Strahler, A., Roesch, A., Lucht, W., and Dickinson, R.: MODIS bidirectional reflectance distribution function and albedo Climate Modeling Grid prod-ucts and variability of albedo for major global vegetation types, J. Geophys. Res., 110, doi:10.1029/2004JD005190, 2005. 8824
Gray, M. E. B., Petch, J., Derbyshire, S. H., Brown, A. R., Lock, A. P., and Swann, H. A.: Version
25
2.3 of the Met. Office large eddy model, The Met. Office, Exeter, UK, 2001. 8822,8828
Haywood, J. M., Allan, R. P., Culverwell, I., Slingo, T., Milton, S., Edwards, J., and Clerbaux, N.: Can desert dust explain the outgoing longwave radiation anomaly over the Sahara during July 2003?, J. Geophys. Res., 110, D05105, doi:10.1029/2004JD005232, 2005. 8818,8820
Jones, C., Mahowald, N., and Luo, C.: Observational evidence of African desert dust
inten-30
sification of easterly waves, Geophys. Res. Lett., 31, L17208, doi:10.1029/2004GL020107, 2004. 8818
ACPD
8, 8817–8846, 2008 Observed boundary-layer/mesoscale impacts on Saharan dust J. H. Marsham et al. Title Page Abstract Introduction Conclusions References Tables Figures ◭ ◮ ◭ ◮ Back Close Full Screen / EscPrinter-friendly Version Interactive Discussion Jonker, H. J. J., Duynkerke, P. G., and Cuijpers, J. W. M.: Mesoscale fluctuations in scalars
generated by boundary layer convection, J. Atmos. Sci., 56, 801–808, 1999. 8823
Julian, P. R.: Comments on the determination of significance levels of the coherency statistic, J. Atmos. Sci., 32, 836–837, 1975.8823
Koch, J. and Renno, N. O.: The role of convective plumes and vortices on the global aerosol
5
budget, Geophys. Res. Lett., 32, L18806L, doi:10.1029/2005GL023420, 2005.8819,8829
Mahowald, N. M., Baker, A. R., Bergametti, G., Brooks, N., Jickells, T. D., Duce, R. A., Kubilay, N., Prospero, J. M., and Tegen, I.: Atmospheric global dust cycle and iron inputs to the ocean, Global Biogeochem. Cy., 19, GB4025, doi:10.1029/2004GB002402, 2005.8818
Mahowald, N. M., Muhs, D. R., Levis, S., Rasch, P. J., Yoshioka, M., Zender, C. S., and Luo,
10
C.: Change in atmospheric mineral aerosols in response to climate: Last glacial period, preindustrial, modern, and doubled carbon dioxide climates, J. Geophys. Res.-Atmos., 111, D10202, doi:10.1029/2005JD006653, 2006. 8819
Marticorena, B. and Bergametti, G.: Modelling of the atmospheric dust cycle 2. Simulation of Saharan dust sources, J. Geophys. Res.-Atmos., 102, 4387–4404, 1997. 8828,8829
15
Matthews, A. J. and Madden, R. A.: Observed propogation and structure of the 33-h atmo-spheric Kelvin wave, J. Atmos. Sci., 57, 3488–3497, 2000. 8822
Parker, D. J., Burton, R. R., Diongue-Niang, A., Ellis, R. J., Felton, M., Taylor, C. M., Thorncroft, C. D., Bessemoulin, P., and Tompkins, A. M.: The diurnal cycle of the West African monsoon circulation, Q. J. R. Meteor. Soc., 131, 2839–2860, 2005. 8819
20
Perez, C., Nickovic, S., Pejanovic, G., Baldasano, J. M., and Ozsoy, E.: Interactive dust-radiation modeling: A step to improve weather forecasts, J. Geophys. Res.-Atmos., 111, D16206, doi:10.1029/2005JD006717, 2006. 8818
Segal, M. and Arritt, R. W.: Nonclassical mesoscale circulations caused by surface sensible heat-flux gradients, Bull. Am. Met. Soc., 73, 1593–1604, 1992. 8819,8826,8831
25
Stephens, G. L., Wood, N. B., and Pakula, L. A.: On the radiative effects of dust on tropical convection, Geophys. Res. Lett., 31, L23112, doi:10.1029/2004GL021342, 2004.8818
Takemi, T., Yasui, M., Zhou, J. X., and Liu, L. C.: Role of boundary layer and cumulus convection on dust emission and transport over a midlatitude desert area, J. Geophys. Res.-Atmos., 111, D11203, doi:10.1029/2005JD006666, 2006. 8819,8829
30
Tanaka, T. Y. and Chiba, M.: A numerical study of the contributions of dust source regions to the global dust budget, Global Planet. Change, 52, 88–104, 2006. 8819
Taylor, C. M., Parker, D. J., and Harris, P. P.: An observational case study of 8833
ACPD
8, 8817–8846, 2008 Observed boundary-layer/mesoscale impacts on Saharan dust J. H. Marsham et al. Title Page Abstract Introduction Conclusions References Tables Figures ◭ ◮ ◭ ◮ Back Close Full Screen / EscPrinter-friendly Version Interactive Discussion mesoscale atmospheric circulations induced by soil moisture, Geophys. Res. Lett., 34,
doi:10.1029/2007GL030572, 2007. 8822
Tompkins, A. M., Cardinali, C., Morcrette, J. J., and Rodwell, M.: Influence of aerosol climatology on forecasts of the African Easterly Jet, Geophys. Res. Lett., 32, L10801, doi:10.1029/2004GL022189, 2005. 8818
5
Van der Hoven, I.: Power spectrum of horizontal wind speed in the frequency range from 0.0007 to 900 cycles per hour, J. Meteor., 14, 160–164, 1957. 8823
Washington, R., Todd, M. C., Engelstaedter, S., Mabainayel, S., and Mitchell, F.: Dust and the low-level circulation over the Bodele Depression, Chad, Observations from BoDEx 2005, J. Geophys. Res., 111, D03201, doi:10.1029/2005JD006502, 2006. 8819
10
Woodward, S.: Modeling the atmospheric life cycle and radiative impact of mineral dust in the Hadley Centre climate model, J. Geophys. Res.-Atmos., 106, 18 155–18 166, 2001. 8819,
8827
Zakey, A. S., Solmon, F., and Giorgi, F.: Implementation and testing of a desert dust module in a regional climate model, Atmos. Chem. Phys., 6, 4687–4704, 2006,
15
http://www.atmos-chem-phys.net/6/4687/2006/. 8819
Zheng, X. and Pielke, R. A.: Landscape-induced atmospheric flow and its parameterization in large-scale numerical models, J. Climate, 8, 1156–1177, 1995.8830
ACPD
8, 8817–8846, 2008 Observed boundary-layer/mesoscale impacts on Saharan dust J. H. Marsham et al. Title Page Abstract Introduction Conclusions References Tables Figures ◭ ◮ ◭ ◮ Back Close Full Screen / EscPrinter-friendly Version Interactive Discussion Fig. 1. Tephigram plot of a dropsonde profile from the Sahara (18◦N, 8.25◦W) taken during the
GERBILS field campaign (12:39 UTC on the 24th June 2007).
ACPD
8, 8817–8846, 2008 Observed boundary-layer/mesoscale impacts on Saharan dust J. H. Marsham et al. Title Page Abstract Introduction Conclusions References Tables Figures ◭ ◮ ◭ ◮ Back Close Full Screen / EscPrinter-friendly Version Interactive Discussion EGU ✁✄✂ ✁✆☎ ✝✆✞ ✟ ✠ ✟ ✠ ✝✟✞ ✟ ✠ ✟✡✠ ✝✆✞ ✝✆✞ ✟ ✠
Fig. 2. Power spectra of vertical winds (w, left), virtual potential temperature (θv, middle) and water vapour mixing ratio (WVMR, right), from B302 (top) and B301 (bottom).
ACPD
8, 8817–8846, 2008 Observed boundary-layer/mesoscale impacts on Saharan dust J. H. Marsham et al. Title Page Abstract Introduction Conclusions References Tables Figures ◭ ◮ ◭ ◮ Back Close Full Screen / EscPrinter-friendly Version Interactive Discussion ✁ ☎ ✝✆✞ ✟✠ ✝✆✞ ✝✆✞ ✟ ✠ ✟✠
Fig. 3. Flight tracks of: (a) B302 (west to east) and albedo derived from MODIS satellite data, (b) B302 (west to east) and low-level winds from the COSMO simulation, (c) B301 (east to west) and low-level winds from the COSMO simulation. Flights were between Niamey (13.5◦N and 2.1◦
E, not shown) and Nouakchott (18◦
N and 16◦
W). White lines show low-level legs.
ACPD
8, 8817–8846, 2008 Observed boundary-layer/mesoscale impacts on Saharan dust J. H. Marsham et al. Title Page Abstract Introduction Conclusions References Tables Figures ◭ ◮ ◭ ◮ Back Close Full Screen / EscPrinter-friendly Version Interactive Discussion EGU ✟ ✠ ✁ ☎ ✝✆✞ ✟ ✠
Fig. 4. Time smoothed data from the low-level transect of B302. “Albedo” was derived from observed upwelling and downwelling solar radiances. “Aerosol scattering” shows the aerosol scattering coefficient from the nephelometer in the blue channel. “Convergence” was calculated along the aircraft track. “Orog.” shows the height of the orography, derived from the aircraft GPS and radar altitudes, “Alt.” shows the aircraft GPS altitude.
ACPD
8, 8817–8846, 2008 Observed boundary-layer/mesoscale impacts on Saharan dust J. H. Marsham et al. Title Page Abstract Introduction Conclusions References Tables Figures ◭ ◮ ◭ ◮ Back Close Full Screen / EscPrinter-friendly Version Interactive Discussion EGU ✁ ✂ ✝✆✞ ✝✟✞ ✝✆✞ ✝✆✞ ✁ ✁ ✂ ✄✆☎ ✁✞✝ ☎✠✟☛✡✌☞ ✞ ☎✠✟✎✍✏☞✒✑ ✞✞✓ ☞✕✔ ✁ ✂✗✖ ✁ ✄✆☎ ✁ ✑ ☎ ✁ ✡ ✁ ✂ ✞✘✓ ✁✚✙ ✁ ✂ ✁ ✔ ✁✜✛ ✞ ✖ ☎✣✢✣✤✦✥ ☎✣✧ ✖ ✧✦★ ✞✩✡✫✪ ✞ ✞✘✓ ✞ ✧ ✞ ✧ ★ ✁
Fig. 5. The coherence and phase of relationships of Heimann BT (red line), along-track wind (black line), windspeed (green line), WVMR (pale blue dashed line) withθv for B302. Horizontal black dashed lines show 80, 90 and 95% significance thresholds respectively.
ACPD
8, 8817–8846, 2008 Observed boundary-layer/mesoscale impacts on Saharan dust J. H. Marsham et al. Title Page Abstract Introduction Conclusions References Tables Figures ◭ ◮ ◭ ◮ Back Close Full Screen / EscPrinter-friendly Version Interactive Discussion EGU ✝✆✞ ✝✟✞ ✝✆✞ ✝✆✞ ✁ ✁ ✂ ✄✆☎ ✁✞✝ ☎✠✟☛✡✌☞ ✞ ☎✠✟✎✍✏☞✒✑ ✞✞✓ ☞✕✔ ✁ ✂✗✖ ✁ ✄✆☎ ✁ ✑ ☎ ✁ ✡ ✁ ✂ ✞✘✓ ✁✚✙ ✁ ✂ ✁ ✔ ✁✜✛ ✞ ✖ ☎✣✢✣✤✦✥ ☎✣✧ ✖ ✧✦★ ✞✩✡✫✪ ✞ ✞✘✓ ✞ ✧ ✞ ✧ ★ ✁
Fig. 6. As Fig.5but the relationship of dust (blue dash-dot line) with windspeed west of 6◦ W.
ACPD
8, 8817–8846, 2008 Observed boundary-layer/mesoscale impacts on Saharan dust J. H. Marsham et al. Title Page Abstract Introduction Conclusions References Tables Figures ◭ ◮ ◭ ◮ Back Close Full Screen / EscPrinter-friendly Version Interactive Discussion EGU ✁ ✞ ✝✟✞
Fig. 7. As Fig.4, but for B301, for the portion of the low level flight unaffected by convectively generated cold pools or the monsoon flow.
ACPD
8, 8817–8846, 2008 Observed boundary-layer/mesoscale impacts on Saharan dust J. H. Marsham et al. Title Page Abstract Introduction Conclusions References Tables Figures ◭ ◮ ◭ ◮ Back Close Full Screen / EscPrinter-friendly Version Interactive Discussion
EGU Fig. 8. As Fig.7 but showing details of the effects of the rocky escarpment at 8.0◦W on the
boundary-layer.
ACPD
8, 8817–8846, 2008 Observed boundary-layer/mesoscale impacts on Saharan dust J. H. Marsham et al. Title Page Abstract Introduction Conclusions References Tables Figures ◭ ◮ ◭ ◮ Back Close Full Screen / EscPrinter-friendly Version Interactive Discussion EGU ✁ ✂ ✝✆✞ ✝✟✞ ✟✡✠ ✝✟✞ ✁ ✂ ✝✆✞
Fig. 9. As Figs.5and6, but for B301 and showing relationships of dust (dark blue, dash-dot line) and WVMR (pale blue, dashed line) withθv.
ACPD
8, 8817–8846, 2008 Observed boundary-layer/mesoscale impacts on Saharan dust J. H. Marsham et al. Title Page Abstract Introduction Conclusions References Tables Figures ◭ ◮ ◭ ◮ Back Close Full Screen / EscPrinter-friendly Version Interactive Discussion EGU ✁ ✂ ✝✆✞ ✝✟✞ ✟✡✠ ✝✟✞ ✁ ✂ ✝✆✞ ✁ ✂ ✝✆✞ ✝✟✞ ✟✡✠ ✝✟✞ ✝✆✞ ✁ ✂ ✝✆✞
Fig. 10. Results from LEM simulations of the B301 boundary layer at 13:00 UTC from 627 m above the ground: (a) WVMR (greyscaled) and vertical velocities (line contours at ±1 ms−1, dashed are negative). (b) Probability density functions of windspeed from the LEM (dashed line), and observations from 7.65±0.1◦
W (solid line).
ACPD
8, 8817–8846, 2008 Observed boundary-layer/mesoscale impacts on Saharan dust J. H. Marsham et al. Title Page Abstract Introduction Conclusions References Tables Figures ◭ ◮ ◭ ◮ Back Close Full Screen / EscPrinter-friendly Version Interactive Discussion
✁ ✂
Fig. 11. Dust “uplift rates” (actually windspeeds cubed) from Eqs. (1) (“MB97”, thick lines) and (2) (“C04”, dashed lines) using the LEM winds (blue lines, “resolved” winds) and the mean wind in the LEM (green lines, “unresolved” wind). “Enhancement” factors i.e. the fractional increases in uplift from using the “resolved” winds are also shown (red lines). (a) Results from the standard LEM run. (b) Results from an LEM run with the mean wind in the model reduced by a factor of two.
ACPD
8, 8817–8846, 2008 Observed boundary-layer/mesoscale impacts on Saharan dust J. H. Marsham et al. Title Page Abstract Introduction Conclusions References Tables Figures ◭ ◮ ◭ ◮ Back Close Full Screen / EscPrinter-friendly Version Interactive Discussion
Saharan Air Layer (SAL)
Weak lid Weak lid
(weakly stratified)
Saharan boundary layer plume High θv Convergence
Free troposphere
Divergence Sand SandUnobserved effect
on mixing of SAL.
DUST? DUST?(Elevated) dark rock
(See caption) (See caption)
✁ ✂
Fig. 12. Schematic of the effects of an albedo anomaly on the boundary layer. Note that observations show statistically significant links between: (i) mesoscale variations in LSTs,θv
and winds and (ii) windspeeds and dust, but do not show significant links between LSTs and dust.