Understanding the kinetics of the ClO dimer cycle
41
0
0
Texte intégral
Figure
+4
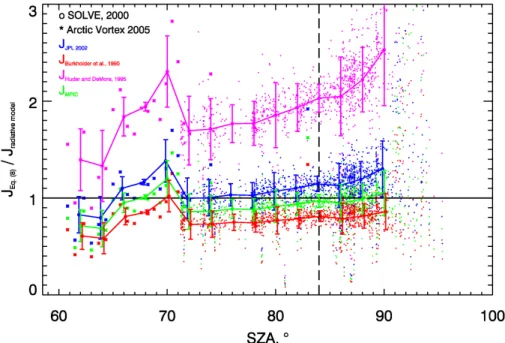
![Fig. 6. Comparison of J derived from the simulated abundances of [ClO] and [Cl 2 O 2 ] using Eq](https://thumb-eu.123doks.com/thumbv2/123doknet/14775614.593530/38.918.49.706.96.521/fig-comparison-derived-simulated-abundances-clo-cl-using.webp)
Documents relatifs