HAL Id: insu-03052658
https://hal-insu.archives-ouvertes.fr/insu-03052658
Submitted on 2 Feb 2021
HAL is a multi-disciplinary open access
archive for the deposit and dissemination of
sci-entific research documents, whether they are
pub-lished or not. The documents may come from
teaching and research institutions in France or
abroad, or from public or private research centers.
L’archive ouverte pluridisciplinaire HAL, est
destinée au dépôt et à la diffusion de documents
scientifiques de niveau recherche, publiés ou non,
émanant des établissements d’enseignement et de
recherche français ou étrangers, des laboratoires
publics ou privés.
Polar stratospheric cloud observations over the
Antarctic continent at Dumont d’Urville
Leopoldo Stefanutti, Marco Morandi, Massimo del Guasta, Sophie Godin,
Gérard Mégie, Jacques Brechet, Jacques Piquard
To cite this version:
Leopoldo Stefanutti, Marco Morandi, Massimo del Guasta, Sophie Godin, Gérard Mégie, et al..
Po-lar stratospheric cloud observations over the Antarctic continent at Dumont d’Urville. Journal of
Geophysical Research: Atmospheres, American Geophysical Union, 1991, 96 (D7), pp.12975-12987.
�10.1029/91JD00776�. �insu-03052658�
JOURNAL OF GEOPHYSICAL RESEARCH, VOL. 96, NO. D7, PAGES 12,975-12,987, JULY 20, 1991
POLAR STRATOSPHERIC CLOUD OBSERVATIONS OVER THE ANTARCTIC CONTINENT AT DUMONT D' URVILLE
L. Stefanuttt, M. Morandt, and M. Del Guasta Istttuto di Ricerca sulle Onde Electromagnetiche
Constglto Naztonale della Rtcerche, Ftrenze, Italy
S. Godin and G. Megte
Service d'A•ronomie du Centre National de la Recherche Scientifique,
Universit• Pierre et Marie Curie, Paris, France
J. Brechet and J. Piquard
Expeditions Polaires Francatses, Paris, France
Abstract. The Istituto di Ricerca sulle Onde radiation are collected. Thus the depolartzation Electromagnetiche (IROE) two-channel elastic induced by nonspherical particles, such as ice backscattering lidar [Sacco et al., 1989], crystals, may be measured.
suitable for depolarization measurements, has Analog detection of the time-resolved signal is been operated since January 8, 1989, at the performed by means of a 12-btt, 5-MHz transient
French Antarctic base of Dumont d'Urville digitizer. Stratospheric ltdar profiles are
(66ø40•S, 140ø01'E). A continuous monitoring of stored in a suitable way on an Olivetti M 380 the stratosphere was performed, which permitted computer and then transmitted by means of measurement of the evolution of the background electronic link via INMARSAT to the BITNET knot stratospheric aerosols and of polar stratospheric of Singapore, and further transmitted to
clouds
(PSC) throughout the year.
The data
Instituto di Ricerca sulle Onde Electromagnetiche
reported in this article correspond to the first
in Italy
and to the Service d'A•ronomie in
year of measurements. Depolarization of the lidar France.signals was measured in
order
to
obtain
The system was first tested at the Italian base
information on the type of clouds observed and on
of
Terra Nova Bay (74ø41•42"S, 164ø07'23"E)
their particle size distribution.
Both low (<10%)
during the summer of 1987-1988 [Sacco et al.,
and high
(>10%) depolarization
ratios
were
1989].
It
was
then transported
to Dumont
detected, permitting discrimination between types
d'Urville
in December
1988 and started
operation
Ia, Ib, and II PSC according to the in January 1989.
classification given by Toon et al. (1990).
Temporal continuity and high time resolution
of
2. Methodology
the lidar measurements are evidence for altitude
decreases in the PSC layers over periods of a few
Backscattering Coefficient and Scattering Ratio
hours. These motions, if linked to sedimentation
processes,
led to values of velocity (•10 cm s'1) .
compatible with large particles.1. Polar Ozone Ltdar Experiment (POLE)
The POLE Experiment is organized under an
For each channel, the scattering ratio is defined as
R•=
(1)
Italian-French cooperation program for Antarctic
where $mi and •ai
are the Rayleigh and Mie
research, in the frame of the Italian National backscattering coefficient in the i-polarizationProgram for Antarctic
Research (PNRA) and the
plane, respectively. Channel 1 corresponds to the
Territotres des Terres Australes et Antarctiques p-polarization plane and channel 2 to the s- Fran•aises (TAAF). The first step of this program polarization plane.is the implementation at Dumont
d'Urvtlle of an
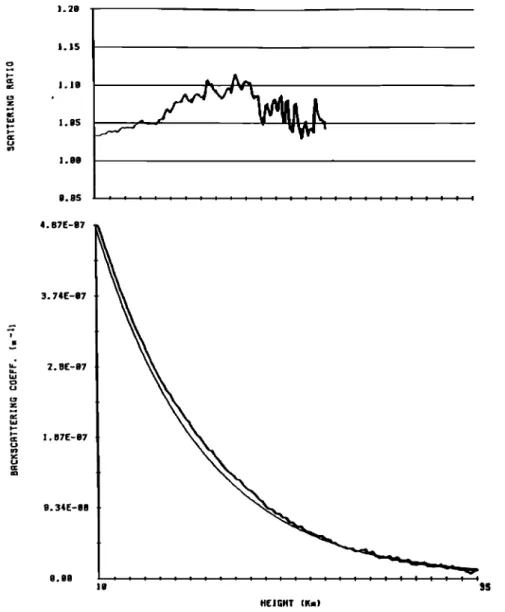
Figure 1 shows a typical ltdar profile of
elastic backscattering 1tdar designed for both
backscattering coefficient and scattering ratio
tropospheric cloud and statospheric aerosol
for
the p-polarization plane. The reference
measurements.
The system, which has been
molecular atmosphere represented in this figure
previously described [Sacco et
al.,
1989]
is
obtained by averaging all
radiosoundings
operates at 0.53 •m, with a linearly polarized
temperature and pressure data obtained in January
laser pulse and a repetition rate of 4 Hz.
1988, for heights up to 25 km and using an
Signals on both the parallel and perpendicularly
exponential approximation above.
polarized planes relative to the emitted laser
The backscattering ratio
is calculated by
Copyright 1991 by the American Geophysical Union.Paper number 91JD00776. 0148-0227/91/91JD-00776505.00
normalizing the lidar signature to the molecular atmosphere at heights between 28 and 32 km. It is then corrected for aerosol extinction between 10 and 25 km, using an average backscatter to extinction ratio value of 0.05 in the presence of PSC and/or cirrus clouds, as revealed by strong
12,976 Stefanutti et al. 'Polar Stratospheric Clouds at Dumont d'Urville ].2e 1.15 4. $7E-87 3.74E-•7 u. 2.8E-g7 • 1.87E-e7 9.34E-e8 8.80 HEIGHT
Fig. 1. Scattering ratio and backscattering coefficient altitude profiles as observed with the lidar system for background aerosol conditions. The integrated backscatter
coefficient between 10 and 25 km is 1.5 x 10 '4
backscattering structures, and 0.025 for 2. For the winter period, an atmospheric
background aerosols [McCormick and Swissler, density profile was derived from the SAM II data
1989]. obtained during the last week of July 1989 [M.P.
All through the year the ancillary temperature McCormick, private communication, 1989]. These and density data were only available up to an data were used up to the end of September. average altitude of 15 km due to the launching Assumptions on the molecular atmosphere have an technique of the radiosondes which could not effect on the retrieved value of the scattering prevent explosion of the balloon when exposed to ratio. In the case of background aerosols (see very low temperatures in the lower stratosphere. Figure 1) the bias on the scattering ratio is on From September on, a n•w method of operation was the order 0.03 around 10 km. Such a value can be adopted which allowed the balloon to reach much neglected when compared to the higher values of higher altitudes. However, because of the lack of the scattering ratio obtained in the case of PSC.
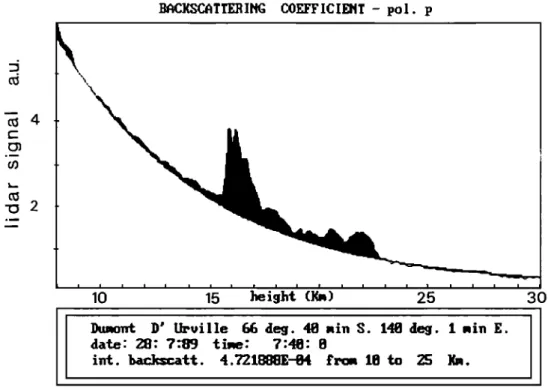
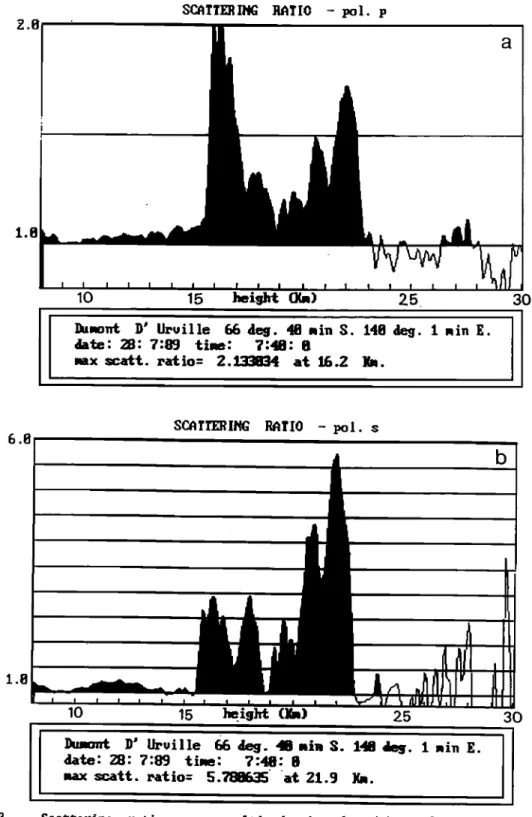
a complete temperature data set, the following Figure 2 shows a typical example of PSC signature
ancillary data were used in the analysis: as seen by lidar for the p-polarization, while
1. For the summer period, the molecular Figures 3a and 3b show the related scattering backscattering profile was evaluated by averaging ratios on the p- and s-polarization planes, the number density profiles obtained from respectively.
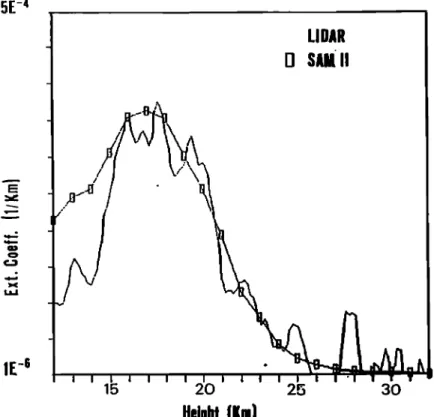
radiosoundings at Dumont d'Urville during three In order to validate the lidar measurements, a
antarctic summers: 1987-1988, 1988-1989, and comparison in terms of aerosol extinction profile
1989-1990. It was used for a first data analysis was performed between the lidar and SAM II
up to the end of July, when the cooling of the satellite measurements. The results are shown on
Stefanutti et al.'Polar Stratospheric Clouds at Dumont d'Urville 12,977
BmqCI($CATTERING COEFFICIENT - pol. p
10 15 hei9ht (]0.) 25
Du•n't D' titville 66 deg. 48 •in •. 148 deg. 1 •in E.
date' 28' 7:89 t i•e' 7'48' 0
int. ba•tt. 4.721888E-84 fr• 18 to 25 R•.
3O
Fig. 2. Backscattering coefficient in the p-polarization plane as measured with the lidar system in the presence of polar stratospheric clouds.
are plotted as measured on February 8, 1988, when by the system. These formula are obtained the lidar was still in Terra Nova Bay. For this assuming that the emitted laser beam is fully comparison, the lidar data at 532 nm were polarized and that the s-component induced on converted into extinction data at 1000 nm, the channel 1 by the receiving system is negligible measurement wavelength of SAM II, using typical compared to the p-component induced on channel 2.
values of 0.025 for the backscatter to extinction After correction of the system depolarization
ratio and 1 for the Angstrom coefficient factor, the depolarization ratio can be defined [McCormick and Swissler, 1989]. This analysis in two different ways, depending on whether the shows that, even with relatively low aerosol depolarizatœon induced by Rayleigh scattering
loading, the lidar data and the SAM II data are included or not. The most widely used definitions in good agreement. This comparison has been in lidar experiments express the depolarization carried out with the data obtained for the p- ratio as a function of the lidar signals received polarization plane only, as the signal obtained on each of the two polarization channels. We on the s-polarization plane in the case of define the depolarization ratio as
background aerosol loading is substantially
negligible.
• •
fi•s+fias
(4)
Depolarization
Ratio
fimP
+fiap+fims+fias
Depolarization
of the laser beam
is induced by
while in other experiments
[Poole et al., 1990;
Rayleigh and Mie scattering and by reflection in
Browell et al.,
1990], the depolarization ratio
the optical receiving
system. Let 11 and 12 be
is simply
defined
as the ratio of the components
the range and transmission corrected lidar
relative to each channel:
signals, received in the p- and s-polarization
•'= (fims+fias)/(fimp+fia
-)'
planes,
respectively'
The
parameter
• ismcalculated
from the signal
received on each channel (equations (2) and (3)),
I1• G1KI0[Tp(1-D)(fimp+r,p)
]
(2) provided
calibration
factors
are known.
I2• G•KI0[TpD(rmp+•,p)+Ts(rms+r,s
)]
(3)
I2g(l_D) _ I1D
• • (5)
where
for each
channel
(i) I 0 is the laser power
I2g(1-D)
- II(1/T-D
)
(emitted in the p-polarization plane), G
i is the
amplification factor of the electronic system
where g is the ratio G1/G
2 and T is the ratio
including
the photomultiplier
tube,
K is the Tp•.
calibration factor common to the two channels, T ratio g is measured by exchanging on a
and
T
s are the transmission
factors specific
t% clear day, and on the shortest
possible
time
the p- and s-polarization planes rm rims ras
interval
the
electronic
channels
and
and r ap are the molecular and aerosol photomultiplier tubes ß T has to be determinedbackscattering coefficients for each polarization from the system's specifications, assuming that plane, and D is the depolarization factor induced the system is correctly aligned so that the p-
12,978 Stefanutti et al.'Polar Stratospheric Clouds at Dumont d'Urville
a
1.8
10
15
heisht Oln)
25
•U•on• D' I•rville
66 de•. 48 •in S. 140 de•. i •in E.
•ate' 28' ?:89 ti•e' ?'48' 8.ax •ca•t.
•atio= ' 2. •
at 1fi.2
3O
6.8
1.8
SC••IH•
P•?IO - pol. s
10
15
]•. igk[ (]In)
25
30
l)m•nt D' lb-ville 66 a•j. 48 •i• •. 148 aes. 1 •in g.
•!ate' 28' 7'89 ti•e' ?:48' 8
•ax scarf. ratio=
5.788635' 'at 21.9
•.
Fig. 3.
Scattering ratio versus altitude in the (a) p-polarization and (b) s-
polarization planes for PSC
observations
as represented in Figure 2.
component of the electric field of the laser beam
lies in the plane of incidence of the 45 ø forward
mirror used to direct the received signal into
the polarizer and the photomultiplier tube. The sum of the system and the Rayleigh depolartzattonfactors (D and Dm, respectively) can be estimated
on a clear day in atmophertc regions where the
aerosol scattering contribution is assumed to be
negligible with respect to molecular scattering;
for example, at altitude levels around 8 km,
D + D
m gI2/11
(6)l+gI2/I 1
with D
m defined as
Dm (7)
Throughout 1988, the system depolarization factor never exceeded a few percent (D + D
Stefanuttt et al. :Polar Stratospheric Clouds at Dumont d'Urville i2,979
5E-4
LIDAR
SAM
II
_ _ !• ' •_1 _ o _iE-6
I I i I I I I I I I I I I I I 'I 1' ? ? 15 20 25 30Height
(Km)
Fig. 4. Comparison
between Mie extinction coefficients as measured
with the lidar and
the SAM II instrument.
3.6%), while it reached values of about 7% during shows the histogram of the measurements performed
the 1989 winter. The increase of D during this throughout the year. From mid-February to the end
period was in fact due to a degradation of the
of
March,
technical
problems
prevented
alignment of the laser transmitter after a strong
stratospheric measurements. In September
1989,
catabatic wind event in early March 1989.
the sky was usually overcast, and only few
In
order
to
perform comparisons with
measurements
could be performed.
theoretical models based on the Mie scattering Typically during the polar night, averaging was
theory, it is
preferable to
use another
performed
over 500 shots (2.5 min.), while 2000
definition of the depolarization ratio which does
shots (10 min.) were necessary during daytime
not take into account the Rayleigh component:
conditions.
From the beginning of June on,
stratospheric lidar measurements were performed
daily, when meteorological conditions were
•a = •as
(8) favorable.
On
some
occasions,
typically
once
per
•as+•aP
week
when
PSC
were present,
a long
sequence
of
Here, 6
a is deduced
from 6 by the following measurements
was carried out, with an average
relationship:
profile every 10-15 min. and measurements
lasting
up to 10 hours. The corresponding dates are
•R - D
m
marked
by an asterisk in Table
1. This was
done
fa =
(9)
in order to follow the PSC evolution and to
R - 1
monitor
possible vertical
motions. Polar
where R is the total backscattering ratio related
stratospheric clouds were detected from June
to the sum of the s- and p-components.
R is
until the second
part of September
1989. A first
obtained from the backscattering ratio
R
analysis of
the observations is
reported
calculated
from
the signal
received
on channel
t
hereafter.
by
I - D
m
(lO)
R=R1 1- 6
3. Operational Mode
4. Experimental Results: Discussion
The signatures of three types of scattering layers can be observed on the ltdar data in the altitude range from 8 to 25 km: background
aerosols between 10 and 25 km, cirrus clouds at
lower altitudes, and polar stratrosphertc clouds
The system was operated twice a week until
the
which are expected to be formed over the whole
end of April for stratosphertc measurements. The
altitude
range between 10 and 25 km. In the
frequency of
these measurements was then
absence of clouds, the signature of the aerosols
increased throughout the winter
and spring
is clearly seen. It corresponds to an integrated
period
in order to provide an appropriate
backscatter coefficient between 12 and 25 km of
12,980 Stefanutti et al. :Polar Stratospheric Clouds at Dumont d'Urville
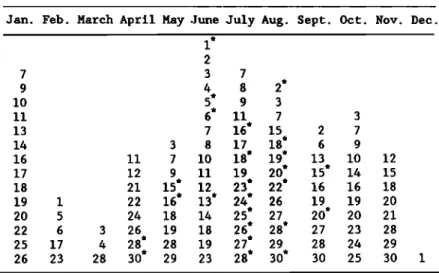
TABLE 1. Days of PSC Measurements, 1989
Jan. Feb. March April May June July Aug. Sept. Oct. Nov. Dec.
7 9 10 11 13 14 16 17 18 19 1 2O 5 22 6 25 17 , 2 3 7 4 8 2* 5* 9 3 6* 11 7 3 7 16' 15 2 7 3 8 17 18' 6 9 11 7 10 18' 19' 13 10 12 12 9 11 19 20* 15' 14 15 21 15' 12 23* 22* 16 16 18 22 16' 13' 24* 26 19 19 20 24 18 14 25* 27 20* 20 21 3 26 19 18 26' 28* 27 23 28 4 28* 28 19 27* 29 28 24 29 26 23 28 30* 29 23 28* 30* 30 25 30 1
* indicates when long periods of measurements were performed.
the scattering ratio R of 1.1 at a peak altitude are potentially detectable from ltdar signatures
of 17 ñ 1 km. Such values have been observed [Browell et al., 1990].
throughout the year and are representative of Type II PSC are water ice clouds with particle background aerosol content in the lower sizes in the 2 •m to 10 •m range. This leads to stratosphere. larger values of the depolartzatton ratios
Cirrus clouds are generally observed in the ranging from 20% to 50% [Toon et al., 1990]. Such range from 6 to 12 km in relation to variations values, which might also indicate the presence of
in the tropopause height. They correspond to nonspherical paticles, are similar to the one
higher values of the scattering ratio, generally expected from ice crystals in cirrus clouds.
above 2, and depolarization ratios above 30%. Consideration of the altitude dependence of the These signatures are similar to the one expected three variables, i.e., temperature (from from some types of polar stratospheric clouds, radiosonde data, if available, or meteorological which potentially leads to difficulties in the charts from satellite data), backscatter
data interpretation, especially at lower coefficients, and depolarizatton ratios from altitudes, where both type of clouds could be ltdar sounding, might then allow us to present. Two criteria can be used to distinguish distinguish between cirrus clouds and PSC, and between cirrus clouds and PSC. The first one between the various types of PSC. The temperature
relates to the temperature observed at the variations in the troposphere and lower altitude of the cloud, as PSC will only be stratosphere, as determined from the radiosonde observed if the temperature drops below 195 K date obtained over Dumont d'Urvtlle throughout
(type I) or 187 K (type II), for average values the year 1989, are represented in Figure 5.
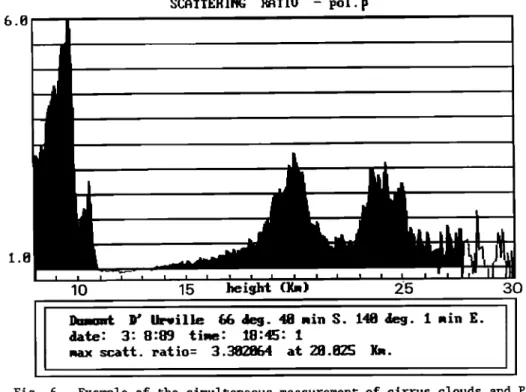
of water vapor and nitric acid partial pressure. Examples of simultaneous detection of cirrus
The second criterion is based on lidar clouds and PSC are given in Figure 6, which observations of the depolarization ratio. Type I corresponds to measurements taken on August 3, PSC are made of relatively small particles (=1 1989. A cirrus cloud is observed between 7 and •m) of nitric acid trihydrate [Toon et al., 10.5 km with a baskscattering ratio of 6 and 1986]. Toon [1990] introduces a further large depolarization ratios between 35% and 40%. distinction of type I PSC by considering the Two stratospheric clouds are also detected at shape and size of the particles, the ratio higher altitudes between 18 and 20.5 km and 23 between the numbers of cloud particles, and and 25 km, respectively. In this particular case condensation nuclei per unit volume. These the altitude location of the clouds is sufficient characteristics, as summarized in Table 2, lead for data interpretation. This is confirmed by the to different values of the depolarization and temperature measurements which indicate
scattering ratios for type Ia and type Ib PSC and temperature in the range 230 K to 205 K between 7
TABLE 2. Characteristics of Type I Polar Stratospheric Cloud
[from Toon, 1990]
Type I a Type Ib
Particle shape aspherical spherical
Particle size >1 •m 0.5 •m
Cloud particles/CN <<1 1
Depolartzation ratio >10% <10%
Stefanutti et al. :Polar Stratospheric Clouds at Dumont d'Urville 12,981
10
i 10
J F M A M J J A $ 0 N D
Fig.
5.
Temperature field
cross section as measured by radiosondes over Dumont
d'Urville during the year 1989.
and 10.5 km, well above the temperature threshold
below 196 K, reaching a lower value of 191.2 K,
for PSC formation, taking into account typical
compatible with the formation of type IPSC.
water vapor mixing ratios observed
in the arctic
Consideration of the depo!arization ratios
stratosphere [Murphy et al.,
1990]. Although might then give further indication of the nature
temperature
measurements
are not available above of the two observed
PSC (Figure 7). The lower PSC
19 km on this particular
day, the observed
cloud corresponds
to a backscatter ratio
of 3.5
temperature between 17 and 19 km has dropped and very low depolarization ratio, characteristic
6.8
SC•Tl'ERI!•
P•TIO - pol.p
1.8
10
15
he i•ht (:]•)
25
30
ikueont D' titville
f• •e9. 48 sin S. 148 •le•j. I nin œ.
date: 3:8:89 fine: 18:4•: 1
•ax scarf. •atio= 3.3• at 28.1•S ]•.
12,982 Stefanutti et al.'Polar Stratosphertc Clouds at Dumont d'Urville
100x - ZE-87
- pm
0
l)u•ont D' U•uille
66 •mj. 4ll nin S. 148 de9. I nin E.
date' 3' 8:89 tine' 18:45' 1D : l)e•olauization Ratio
p• : {lie ]{ackscatterin9
Fig. 7. Depolarization ratio (dotted line) and Mie backscattering coefficient (solid
].ine) versus altitude as measured on August 3, 1989.
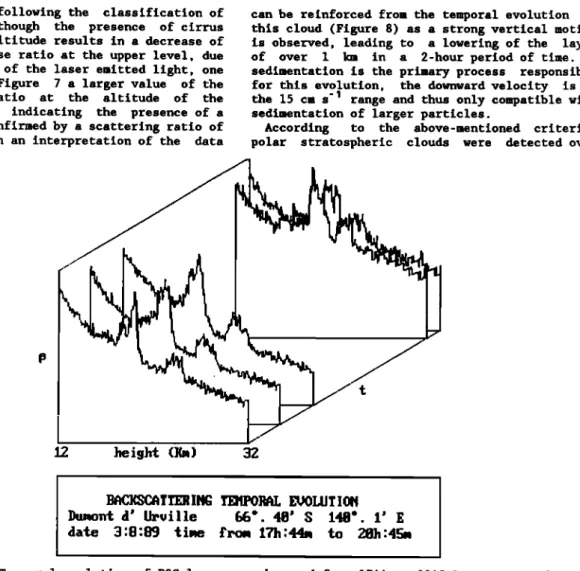
of type lb PSC following the classification of
can be reinforced from the temporal evolution of
Toon [1990]. Although the presence of cirrus
this cloud (Figure 8) as a strong vertical motion
clouds at lower altitude results in a decrease
of
is observed,
leading to a lowering of the layer
the signal to noise ratio at the upper level, due
of over 1 km in a 2-hour period of time. If
to the extinction of the laser emitted light, one
sedimentation is the primary process responsible
can observe from Figure 7 a larger value of the
for this evolution, the downward
velocity is in
depolarization ratio at the altitude of the the 15 cm s '1 range and thus only compatible with
uppermost cloud, indicating the presence of a
sedimentation of larger particles.
type II PSC as confirmed by a scattering ratio of
According to the above-mentioned criteria,
3 (Figure 6). Such an interpretation of the data
polar stratospheric clouds were detected over
12. he i9ht (](n) 32
B•C](SC. qTI3•RIHU 13•RgLL •UOLUTIOH
Dupont d' IJ•uille 66'. 48' S 148'. 1' E
date 3'8:89 ti•e œ•o• 17h'44• te 28h:49•
Fig. 8. Temporal evolution of PSC layers as observed from 1744 to 2045 LT on August 3,
Stefanutti et al. :Polar Stratospheric Clouds at Dumont d'Urville 12,983
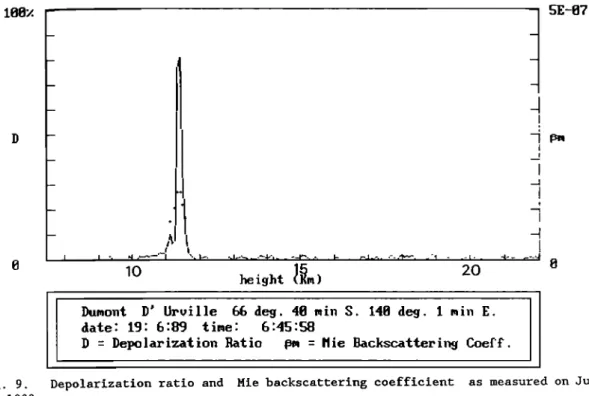
5E-87
Dupont D' Urville 66 de9. 48 •in S. 148 de9. 1 •in E.
da•e: 19:6:89 •i•e: 6:45:58
D - Depolarization Ratio • - •ie Bachscattering Coef'œ.
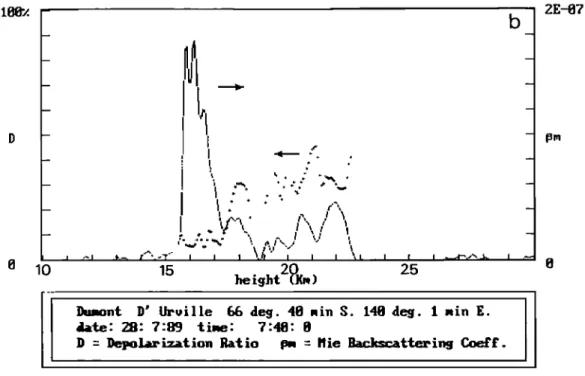
Fig. 9.
Depolarization ratio and Mie backscattering coefficient
as measured
on June
19, 1989.
Dumont d'Urville starting in late June 1989. The observed at 10.8 km with a temperature value of
first detection occurred on June 19 and was 196 K. The measured depolarization ratio of 25%
followed by PSC observations on July 27 and 28,
is likely to be compatible with the presence of a
August 2,
3, 18, 19, 28, 29, and 30, and
type Ia PSC, as the scattering
ratio does not
September 2, 9, 15, 16, and 19. No PSC were exceed 2.2.clearly
detected after
this
latter
date. The
On July 27 and 28 the temporal evolution of the
observations performed on June 19 give an example PSC has been recorded over an extended period of of the interest of depolarization measurements time (Figure 10a). Several PSC are observed for the identification of PSC (Figure 9). On this between 15 and 23 km in a layered structure with particular day, the tropopause height was scattering ratios as high as 3. The corresponding8 heigh•
t•CRSC•TTHBI• TEHPOERL Et}OLHTIO•4
Dumont d' Orville 66'. 48' S 148'. 1' E
date 27:7:89 ti•e œro• 21h:2• to 7h:48•
Fig. 10a. Temporal evolution of the backscattering coefficient as observed on July 27
12,984 Stefanutti et al.'Polar Stratospheric Clouds at Dumont d'Urville
o lO
b
l•nt D' Uruille 6• deg. 48 ain 8. 148 de•. Iain œ.
•te' ZB: 7:89 ti•e' 7:41]' 8
D - l)epo•i•tion Ratio • : I•ie Ba _c•__at•in• Co•œ.
2E-•7
•M
Fig. 10b. Depolarization ratio and Hie backscattering coefficient versus altitude for
the same time period.
depolarization ratio ranges between 10% and 40% pm to 10 pm range, typical of type II or type Ia (Figure 10b), indicating the presence of rather PSC. Consideration of the temperature values large particles. Temperature charts obtained from (above 190 K), depolarization ratios (above 10% the European Centre for Medium-Range Weather and reaching 30% at the uppermost levels), and Forecasts, indicate a minimum temperature value scattering ratios (from 1.2 to 2; Figure 10c) of 193 K up to 25 km. As for the case of August might indicate for the presence of a type Ia PSC. 3, a descending motion is observed in the various During the second part of August and September, layers which corresponds to a downward motion of PSC were observed at lower altitudes between 12
4 cm s '1 . According
to Toon et al.
[1989], such
and 17 km. Figures 11a and 11b represent the
velocities are characteristic of nonspherical scattering ratio for the p-polarization and the large particles with equivalent radius in the 5 depolarization ratio, respectively, according to3.8
SC•TTERI• B•tT I0 - •1. •
1.8
10 15 height ½](1•) 25
Dumont D' Uruille 66 deg. 40 nin S. 148 de9. I nin E.
date' 28' 7'89 t i•e' 7'48' 0 max scarf. ratio= 2.839861 at 15.9
3O
Stefanutti et al.'Polar Stratospheric Clouds at Dumont d'Urville 12,985
B•CgSC•TTE•I•G COEFFICIENT- pol. p
a
ight
Dunont D' Broille
66 des. 4• •in S. 144] de9. I •in E.
date' 3{i' 8:89 fine' 17:21'58
iwt. •a•tt. 4.8831•-84 œ•on 18 •o 2S
b
lO 15
he ight (•n)
Dunowk D' Ilvoille 66 des. 48 nin S. 148 de9. Iain œ.
da•e' 3•' 8:89 tine' 17:21'58
D = llel•larization Patio • = •lie Ba•%terin9 •f.
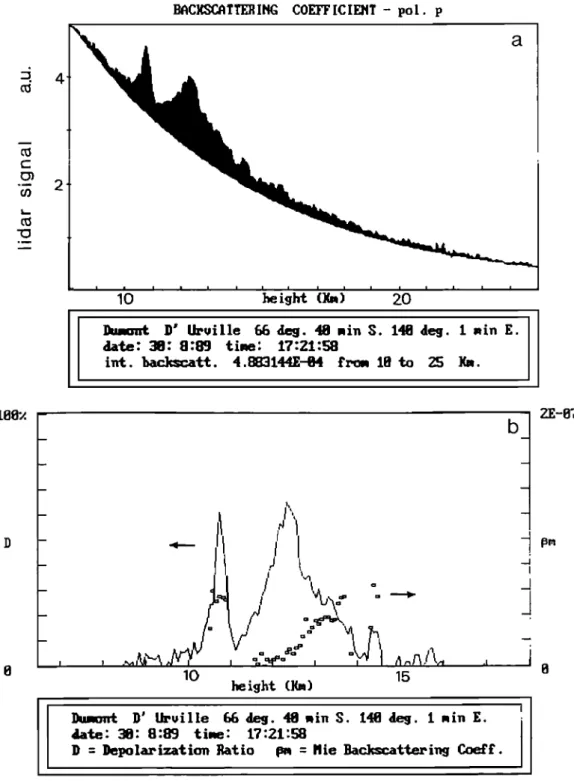
Fig. 11. (a) Backscattering coefficient in the p-polarization plane versus altitude as
measured on August 30, 1989. (b) Depolarizatton ratio versus altitude.
equation (9), for August 30. The tropopause level 20%. This seems to show evidence for PSC of type on that day was 12 km with temperatures of the Ib at the cloud base and of type Ia at the cloud order of 195 K. Here again the simultaneous top.
presence of a thin cirrus at 11 km, and a PSC The increased presence of cirrus clouds during
layer, just above, was observed. The cirrus this time period substantially prevented
presents a depolarization ratio of the order of observation of PSC, although type IPSC were
25%, while for the PSC, two layers can be still detected on September 19 between 16 and 17 distinguished. The lower layer presents a very km, which could be classified as type Ib PSC low depolarization ratio (•5%) with a scattering according to criteria indicated above (Figures ratio of 1.5 at 12.3 km, and the higher layer a 12a and 12b). One may notice, from Figure 12a, somewhat lower scattering ratio of 1.25, with a the very large extension of the cirrus cloud from much higher depolarization ratio, of the order of 9 to 13 km, which in the absence of
12,986 Stefanutti et al. 'Polar Stratospheric Clouds at Dumont d'Urville
BACXS•ATI'I•I•IG COEFFICIEII1• - pol. p
a•
lO heisht
Dumont D' Ur,.,ille
66 deg. 4• ,rain S. 14• 8eg. 1 ,rain K.
•lai. e' 19' 9'89 time' 1' 5'31
int. bac•tt. 6.193969E-BS œr• 14 in 28 {(n.
18•/. , I 15 20 height
b
9E-if?Dumont D' Uruille
66 de9. 4H nin •. 14B deg. I rain E.
date' 19' 9:89 time' 1' 5.11
I) = l•larization Ratio pn - {•ie Backscaiterin• Co•œ.
Fig. 12. (a) Backscattering coefficient in the p-polarization plane versus altitude as
measured on September 19, 1989. (b) Depolarizatton ratio versus altitude.
depolarization and temperature data, could lead French POLE experiment, have confirmed the to misinterpretations. At the cloud base, the ability of such active techniques to monitor with temperature on that day was of the order of 220 a high temporal and vertical resolution the K, and only above 13 km the stratosphere was cold vertical distribution of polar stratospheric enough (•195 K) for PSC formation. As already clouds. The use of two polarization channels mentioned, no PSC were further detected after allows us to distinguish between various types of this date. clouds and provided further development of the inversion techniques accounting for the expected 5. Conclusion relationship between particle sizes and depola-
rtzation effects [Flesia, 1991]. The further
Ltdar measurements performed throughout the implementation of a DIAL lidar to simultaneously year 1989 at the French Antarctic base in Dumont provide the vertical distribution of ozone in the d'Urville, in the frame of the joint Italian- troposphere and stratosphere [Pelon and M•gie,
Stefanuttt et al.'Polar Stratospheric Clouds at Dumont d'Urville i2,987
1982; Godin et al., 1989], presently planned for Poole, L.R., G.S. Kent, M.P. McCormick, W.H.
December 1990, will complement this monitoring Hunt, M.T. Osborn, S. Schaffner, and M.C.
activity.
Pitts,
Dual-polarization
airborne 1idar
observations of polar stratosphertc cloud
Acknowledgments.
_The authors wish to thank the
evolution, Geophys. Res. Lett.,
vol. 17(4),
entire French team at Dumont d'Urvtlle, who made 389, 1990.it possible for this experiment
to be successful.
Sacco,
V.M., F. Castagnolt, M. Morandt, and L.
A special thanks
to Enrico Palchettt and Ltonello
Stefanuttt, Elastic baskscattering
lidar system
Zuccagnolt
of IROE-CNR,
who brought, assembled,
for atmospheric
measurements
in Antarctica,
and tested the system
in Dumont
d'Urville. This
Opt. and Quantum
Electron., 21, 215, 1989.
work has been supported by the Italian PNRA and
Toon, O.B., Polar stratosphertc clouds, paper
the French TAAF
and Exp•dttions Polatres.
presented at the International Workshop on
References
Browell, E.V., C.F. Butler, S. Ismatl, P.A.
Robtnette, A.F. Carter, N.S. Htgdon, O.B. Toon, M.R. Shoeberl, and A.F. Tuck, Airborne ltdar
observations in the wintertime arctic
stratosphere: Polar stratosphertc clouds,
Geophys. Res. Lett., 17(4), 385, 1990.
Flesia, C., A stochastic method for lidar
Stratosphertc Aerosol: Measurements, Properties, Effects, NASA-ARC, Moffett Field,
Calif., March 27-30, 1990.
Toon, O.B., P. Hamill, R.P. Turco, and J. Pinto,
Condensation of HN03 and HC1 in the winter
polar stratosphere, Geophys. Res. Lett., 13,
1284, 1986.
Toon, O.B., R.P. Turco, J. Jordan, J. Goodman,
and G. Ferry, Physical processes in polar strato-spheric clouds, J. Geophys. Res.,
inversion
equation-Application
for cloud size
94(D9),
11, 359, 1989.
distribution
measurements,
Proceedings
of the Toon, O.B., E.V. Browell,
S. Kinne, and 3.
2nd
Italian National
Workshop
on the Antarctic Jordan,
An analysis
of lidar observations
of
Atmosphere,
Italian Physical
Society,
in press
polar stratospheric
clouds, Geophys.
Res.
1991.
'
Lett., 17(4), 393, 1990.
Godin, S., G. M•gie, and J. Pelon, Systematic
ltdar measurement of the stratosphertc ozone
vertical
distribution,
Geophys. Res. Lett.,
J. Brechet and J.
Piquard,
Expeditions
16(6), 547, 1989.
Polaires Fran•aises,
47 Avenue du Mar•chal
McCormick, M.P., and T.J. Swissler, Atmospheric Fayolle, 75116, Paris, France.
effects,
in Global Volcanism 1975-85, chap.
M. Del Guasta, M. Morandi, and L. Stefanutti,
19, pp. 604-605, edited by L. Mc Clelland,
IROE-CNR, Via Panciatichi 64, 50127 Firenze,
Smithsonian Institution, Washington D.C., 1989. Italy.
Murphy, D.M., K.K. Kelly, A.F. Tuck, and M.H.
S. Godin and G. M•gie, Service d'A•ronomie du
Proffitt,
Ice saturation at the tropopause
Centre National de la Recherche
Scienttfique,
observed from the ER-2 aircraft, Geophys. Res.
Universit•
Pierre et Marie
Curie, 4 Place
Lett., 17(4), 353, 1990.
Jussieu, 75231, Paris Cedex 05, France.
Pelon, J., and G. M•gie, Ozone monitoring in the