Does Compliance Pay? Social Standards and Firm-Level Trade
The MIT Faculty has made this article openly available. Please share
how this access benefits you. Your story matters.
Citation Distelhorst, Greg, and Richard M. Locke. “Does Compliance Pay? Social Standards and Firm-Level Trade.” American Journal of Political Science 62, 3 (June 2018): 695–711 © 2018 Midwest Political Science Association
As Published http://dx.doi.org/10.1111/AJPS.12372
Publisher Wiley Blackwell
Version Original manuscript
Citable link http://hdl.handle.net/1721.1/120804
Terms of Use Creative Commons Attribution-Noncommercial-Share Alike Detailed Terms http://creativecommons.org/licenses/by-nc-sa/4.0/
Does Compliance Pay?
Social Standards and Firm-level Trade
Greg Distelhorst
Richard M. Locke
December 30, 2017
American Journal of Political Science
Running title: Does Compliance Pay?
Keywords: political economy, trade, labor, regulation, global supply chains. Contact information:
Greg Distelhorst (corresponding author), Assistant Professor of Global Economics and Management, MIT Sloan School of Management, 77 Massachusetts Avenue E62-425, Cambridge, MA 02139, [email protected].
Richard M. Locke, Provost and Professor of Political Science and Public and Interna-tional Affairs, Brown University, Box 1862, Providence, RI 02912, richard [email protected].
We are grateful to our collaborators at the sourcing agency and several manufacturing estab-lishments for providing access to administrative data and participating in interviews for this re-search. Thanks to Matthew Amengual, Vincent Arel-Bundock, Stephanie Barrientos, Cristina Bodea, Rafael Gomez, Rebecca Henderson, Mitchell Hoffman, Alexander Kuo, Simon Johnson, Thomas Kochan, Daniel Mattingly, Layna Mosley, Khalid Nadvi, Kelly Pike, Dennis Quinn, Chuck Sabel, Andrew Schrank, Michael Toffel, Kristin Vekasi, Christopher Woodruff and seminar par-ticipants at the International Political Economy Society, Association for Research on Corporate Sustainability, Canadian Industrial Relations Association, the Labor and Employment Relations Association, Brown University, University of Edinburgh, University of Manchester, MIT, and Uni-versity of Toronto for helpful feedback on this study. We wish to thank the MIT Sloan School of Management Dean’s Innovation Fund for providing travel and research support.
Abstract
What is the relationship between trade and social institutions in the developing world? The research literature is conflicted: importing firms may demand that trading partners observe higher labor and environmental standards, or they may penalize higher standards that raise costs. This study uses new data on retailers and manufacturers to analyze how firm-level trade responds to information about social standards. Contrary to the “race to the bottom” hypothesis, it finds that retail importers reward exporters for complying with social standards. In difference-in-differences estimates from over two thousand manufacturing establishments in 36 countries, achieving compliance is associated with a 4% [1%, 7%] average increase in annual purchasing. The effect is driven largely by the apparel industry—a longterm target of anti-sweatshop social movements—suggesting that activist campaigns can shape patterns of global trade.
Replication materials. The data, code, and any additional materials required to replicate all analyses in this article are available on the American Journal of Political Science Dataverse within the Harvard Dataverse Network, at:
http://dx.doi.org/10.7910/DVN/2E2M9Z Word count: 9,109
International trade shapes not only economic growth but also the social institutions of trading countries. A research literature in political economy, going back at least to Marx’s argument that free trade accelerates exploitation of labor and the col-lapse of capitalism (Engels 1888), debates both the mechanisms and direction of its impact. Contemporary scholarship has explored how international trade shapes tax-ation (Garrett 1998), social spending (Rodrik 1998; Rudra 2008; Ansell 2008; Rickard 2012), health and environmental regulations (Vogel 1995; Drezner 2001), and labor rights (Rudra 2005; Neumayer and De Soysa 2006; Mosley and Uno 2007; Greenhill, Mosley and Prakash 2009; Mosley 2010).
This study contributes new evidence on one mechanism linking trade and so-cial institutions: the market behavior of trading firms. If traders reward exporters that exhibit lower labor and environmental standards, their behavior creates down-ward pressure on these standards, contributing to a trade-led “race to the bottom.” On the other hand, if trading firms prefer doing business with exporters that observe higher standards, they may create incentives for exporters to improve standards. These firm-level mechanisms are distinct from state-level mechanisms linking trade to social institutions. Yet previous empirical research focuses largely on aggregate national-level policies and labor market outcomes. The contribution of firm-level mechanisms is therefore unknown.
We investigate how the social standards of exporters correlate with firm-level trade. Examining retailers in advanced economies and several thousand manufactur-ers in emerging markets, we detect surprising evidence of a preference for exportmanufactur-ers that observe higher standards. Importers purchase more from export factories that comply with basic labor and environmental standards, contrary to what we would expect from a firm-level race to the bottom. Difference-in-differences estimates show that within-exporter improvements in compliance are associated with increased av-erage order volume of 4% [1%, 7%], even after adjusting for variation in manufac-turing performance.These findings suggest that in the markets we study either (a) compliance with basic labor and environmental standards can be achieved without sacrificing performance on price, delivery, or product quality, or (b) some importers are willing to pay more to trade with socially compliant exporters.
The study cannot conclusively adjudicate between these interpretations. How-ever, noting that the importers we study are primarily retailers and apparel brands headquartered in advanced economies, we propose that anti-sweatshop social move-ments may have prompted them to prefer purchasing from factories that comply
with basic social standards. Consistent with this hypothesis, we find that the rela-tionship between compliance and sourcing appears primarily in apparel, an industry targeted by anti-sweatshop activism over the last three decades. Yet enforcing basic standards through this mechanism has clear limitations. A majority of the studied exporters remain noncompliant with basic standards. Despite evidence of a firm-level preference for compliance, this incentive falls far short of guaranteeing basic labor and environmental standards in global supply chains.
In addition to the research literature on trade and social standards, this study contributes to longstanding debates surrounding the efficacy of “private regulation” or “civic regulation” of multinational business (Elliott and Freeman 2003; O’Rourke 2003; Mattli and B¨uthe 2005; Bartley 2007; Vogel 2008; Mayer and Gereffi 2010; Locke 2013). Private regulation refers to non-state systems of monitoring and en-forcement of standards. As these institutions have become increasingly prevalent, scholars have debated the extent and conditions under which private regulation can supplement or even replace regulation by the state. Early scholarship suggested that private regulation—supported by consumer and activist pressure—could drive higher standards in trading jurisdictions that fell outside the reach of trade unions and effec-tive regulatory agencies (Fung, O’Rourke and Sabel 2001; Elliott and Freeman 2003). Yet subsequent empirical research cast doubt on the efficacy of private regimes, find-ing that major labor and environmental violations persisted in exporters subject to private regulation (Vogel 2005; Locke, Qin and Brause 2007; Seidman 2007; Locke, Amengual and Mangla 2009; Distelhorst et al. 2015).
Although previous research shows that many exporters fail to achieve compli-ance with international codes of conduct, it is less informative about the economic incentives created by transnational private regulation. Do these incentives reward improving or declining standards? Our study affirms that many noncompliant facto-ries participate in global supply chains, yet our findings also suggest that economic incentives within these supply chains generate upward pressure on standards. Within an industry subject to pressure from anti-sweatshop activism, exporting firms are on average rewarded rather than punished for improving compliance with labor and en-vironmental standards. The concluding section discusses the magnitude of this effect and the investments in socially responsible practices it might offset.
Trade-based diffusion of social institutions
The political economy literature is conflicted about the effects of trade on worker rights and environmental protection. Some theories hold that pressures from inter-national competition undermine costly protections for both workers and the envi-ronment in a race to the bottom. Others suggest that international trade leads to upward harmonization on standards, resulting in “California effects.” Yet uncer-tainty surrounds not only the direction of trade’s impact, but also the mechanisms that produce these effects.
To date, a significant body of research focuses on country-level mechanisms and outcomes. Falling tariffs may foster competition between national economies that extends to regulatory regimes. If domestic regulations impose cost disadvantages on industry, governments may reduce regulation to protect domestic tax revenue and employment (Drezner 2001). Several country-level empirical studies find that trade openness undermines worker rights and bargaining power, especially in developing countries (Mosley and Uno 2007; Rodrik 1997; Rudra 2005, 45-46). Yet alternative measurement and identification strategies find either no relationship or the opposite effect (Neumayer and De Soysa 2006; Vadlamannati 2015).
Another body of research notes that trade liberalization is often accompa-nied by a negotiated harmonization of regulatory standards. When powerful states also have higher standards, they may impose those standards on their trading part-ners, leading to upward harmonization through trade liberalization (Vogel 1995). Indeed, since 1950 roughly two-thirds of all preferential trade agreements include provisions on social institutions, including labor rights, environmental protection, and human rights (Hafner-Burton 2005; Milewicz et al. 2016). Country-level re-search on trade also offers evidence of these “California effects” in both labor rights (Greenhill, Mosley and Prakash 2009) and human rights (Cao, Greenhill and Prakash 2013).
Firm-level mechanisms
The mechanisms discussed above function at the country-level through changes in policy. Yet the market behavior of trading firms—rather than governments—may generate similar pressures on labor and environmental practices. Managers decide which firms they do business with, how to compensate workers, and how to dis-pose of the waste they generate. The effects of trade therefore depend not only on
how governments behave, but also on whether firms that observe higher regulatory standards are rewarded or penalized by global markets.
One possibility is that firms that observe higher standards—like offering higher wages or paying to mitigate their environmental impacts—are at a competi-tive disadvantage in export markets. This view rests on two assumptions. The first assumption is that, other things equal, observing higher labor and environmental standards results in increased unit prices. For example, if an exporting firm increases employee compensation to satisfy minimum wage regulations, it may pass increased labor costs to its customers in the form of higher prices. The second assumption is that customers (importers) are indifferent to the labor and environmental standards of their suppliers. They are unwilling to pay higher prices to do business with com-pliant exporters. Under these two conditions, we may observe a firm-level race to the bottom as exporters seek price advantages by reducing compliance with labor and environmental regulations (Rodrik 1997; Chan 2003; Mosley and Uno 2007; Weil 2014).
Alternatively, there is the possibility of firm-level “California effects.” Like states, trading firms may also have preferences about the processes through which the goods they import are produced. Activist campaigns are one possible driver of these preferences. Social movements promoting environmental sustainability and combatting worker exploitation attract consumer attention and threaten the value of targeted firms (Fung, O’Rourke and Sabel 2001; Elliott and Freeman 2003; Vo-gel 2005; Bartley 2007; King and Soule 2007; Seidman 2007). Reputation-conscious importers may therefore prefer to do business with exporters that comply with min-imum standards in labor and environmental practices. This firm-level preference would allow trade to drive higher standards in the absence of any government ac-tion.
The emergence of transnational private regulation of global supply chains of-fers suggestive evidence for this possibility. Activist campaigns around labor and en-vironmental abuses have prompted many consumer-facing multinational enterprises to establish “supply chain responsibility” programs (Vogel 2005; Bartley 2007; Vogel 2008; Mayer and Gereffi 2010; Levi et al. 2013; Locke 2013; Toffel, Short and Ouellet 2015). This typically entails establishing codes of conduct that govern working condi-tions, environmental practices, and other international standards. Exporters seeking to do business with these multinationals must agree to these standards and submit to periodic audits. Private regulation of supply chains has spread from apparel and
footwear to varied industries including consumer electronics (Distelhorst et al. 2015; Nadvi and Raj-Reichert 2015), food and beverages (Coslovsky and Locke 2013), and forestry (Bartley 2007).1 Unlike Fair Trade certification (De Janvry, McIntosh and Sadoulet 2015), these compliance programs seek primarily to alter the production processes of exporters, not necessarily increase their profits.
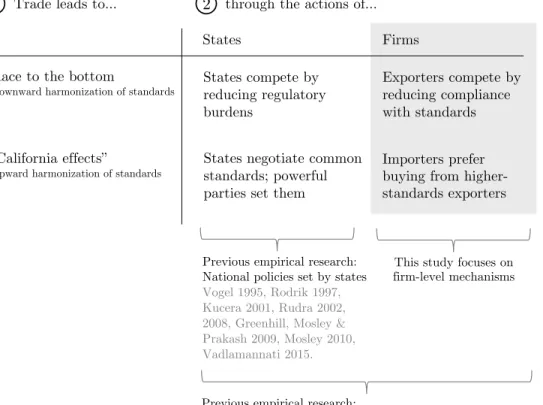
In comparison to the research literature on trade and social institutions at the country-level, there is markedly less evidence on firm-level mechanisms (Figure 1). The studies discussed in the previous section primarily use cross-national datasets developed by Mosley (2010) and Kucera (2001) to measure the prevalence of labor rights violations aggregated at the national level. These outcomes may be influenced by state-level mechanisms, firm-level mechanisms, or a combination of the two.
[Figure 1 here]
Although previous research does not offer quantitative evidence on firm-level mechanisms, scholarship on transnational private regulation casts doubt on its effi-cacy. Studies have repeatedly found that noncompliant export factories remain in supply chains even after multiple audits and corrective exercises (Locke, Qin and Brause 2007; Locke 2013; Distelhorst et al. 2015).2 Consistent with one assumption of the firm-level race to the bottom, these studies affirm that complying with higher process standards—paying statutory minimum wages and benefits, mitigating pollu-tion impacts, and offering safe factory infrastructure—increases costs (Mosley 2010; Ruwanpura and Wrigley 2011; Barrientos 2013; Lund-Thomsen and Lindgreen 2014). Despite evidence that some consumers pay premiums for ethically produced goods (Hainmueller, Hiscox and Sequeira 2015), this scholarship also affirms the second assumption, that importers are unwilling to pay more to do business with compliant factories: “It seems inevitable that higher labor standards will increase production costs, and many suppliers believe that addressing [social responsibility] issues makes them less competitive” (Vogel 2005). Consistent with this view, reports by scholars, activists, and NGOs continue to expose poor working conditions in export factories
1Although we have separated state-level and firm-level mechanisms in this discussion, private
regu-lation does not operate in a regulatory vacuum. There are complementarities between transnational private regulation and domestic state-based regulation (Amengual 2010; Coslovsky and Locke 2013; Amengual and Chirot 2016).
2In contrast to most of the literature, Harrison and Scorse (2010) found that the Indonesian
export industries most exposed to anti-sweatshop campaigns in the 1990s raised worker wages with no discernible impact on employment.
manufacturing for top retail brands, even when these factories are subject to codes of conduct and compliance auditing by their customers (Chan, Pun and Selden 2013; Workers Rights Consortium 2014).
Despite the sensibility of these critiques, empirical evidence on firm-level trade and social institutions has been elusive. One noteworthy exception, Oka (2012), found that reputation-conscious importers rewarded compliance by Cambodian ex-porters with long-term sourcing relationships. However, this finding came from a unique institutional setting—the Better Factories Cambodia program3—raising ques-tions about its generalizability to exporters who cannot or do not participate in such programs.
Research Design
If global supply chains exhibit a firm-level race to the bottom in labor and environ-mental standards, importers should place more orders with low-standards exporters. Yet there is also the possibility of firm-level California effects; if trading firms pre-fer doing business with exporters that comply with higher labor and environmental standards—and the effect of compliance on prices is either negligible or tolerable—we expect the opposite pattern.
We test these hypotheses using a novel dataset on export transactions involv-ing several thousand establishments provided by a global sourcinvolv-ing agent.4 Sourcing agents play an important role in global supply chains by connecting importers with exporters capable of producing goods at an acceptable price, quality level, and deliv-ery schedule. The sourcing agent we study primarily serves retailers and wholesalers headquartered in advanced economies (Figure 2).
[Figure 2 here]
Contemporary sourcing agents not only facilitate transactions; they also mon-itor the compliance of exporters in the developing world with labor, environmental,
3Better Factories Cambodia (http://betterfactories.org/) is a factory monitoring and
capability-building program managed by the International Labour Organization and the International Finance Corporation.
4The sourcing agent’s data were obtained and analyzed under the terms of a research agreement.
The agreement allowed the sourcing agent to mask its name and the names of its customers and supplier factories in any published research.
and legal standards. In response to importer demand, the sourcing company estab-lished its own code of conduct, audited export factories for compliance with this code, and reported the results to prospective importers. We use these factory au-dits to measure exporter compliance with labor and environmental standards. Social compliance auditing has many well-understood problems. Audits only capture a snapshot of factory conditions, are only as good as the training of their auditors, and are poorly-suited to evaluate and enforce process rights like the freedom of as-sociation (O’Rourke 2003; Locke, Amengual and Mangla 2009; Anner 2012). Rather than assume that audits offer a flawless picture of factory conditions, this study adopts the more modest assumption that factories that exhibit higher compliance scores are also, on average, more compliant than those that exhibit lower scores. In the online supplement, we examine detailed audit result to help readers understand what issues auditors actually detect and ensure our results are not driven by non-credible items like freedom of association or non-discrimination. However, even if readers remain skeptical of this approach, these audits serve as the primary source of information available to potential importers about exporter labor and environmental practices. Audit results are therefore an appropriate measure of exporter compliance as perceived by importers.
Auditors inspect factories over one to two days to evaluate their practices against the standards established in the code of conduct. They then assign the fac-tory a letter grade on the scale “A” through “D”. The factories are also summarized in thirteen separate compliance areas, such as “wages and benefits” and “work hours” (Appendix Table A1). Factories rated A and B (28% of the factory-year observa-tions in the main panel) are considered compliant, whereas those rated C and D are noncompliant. Our analysis uses both the original four-point grading system and this binary distinction between compliance and noncompliance, which eliminates the assumption of equidistance between the four letter grades.
The sourcing agency also provided data on the value of customer orders placed at each export manufacturer. These records were provided in annual sums and binned into thirteen ranges, from under USD 50,000 to over USD 50 million.5 The midpoint of each bin provides an estimate of the annual nominal value of buyer orders. These
5The boundaries of the thirteen annual order value bins were $0, $50k, $100k, $250k, $500k, $750k,
$1m, $5m, $10m, $20m, $30m, $40m, $50m, and over $50m. In addition to estimated annual order values, Appendix Table A5 reports fitted linear probability models of exceeding the thresholds defined by bin edges.
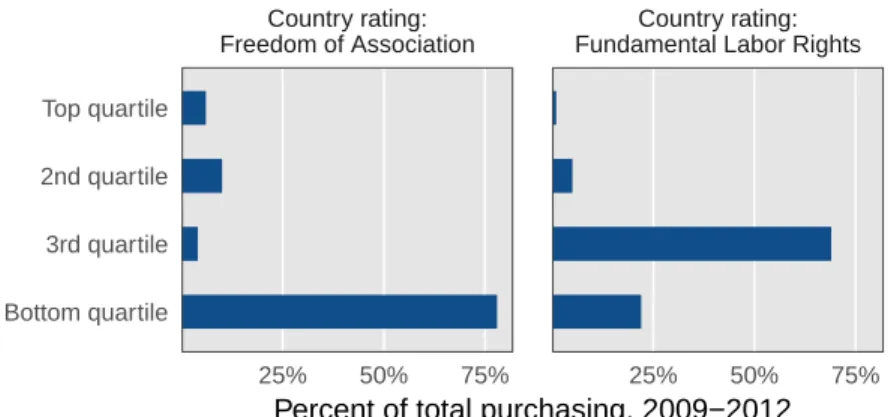
estimates are then deflated to obtain order value in constant 2012 dollars.6 Within this sample, most exports come from countries with poor freedom of association and protection of labor rights (Figure 3).
[Figure 3 here]
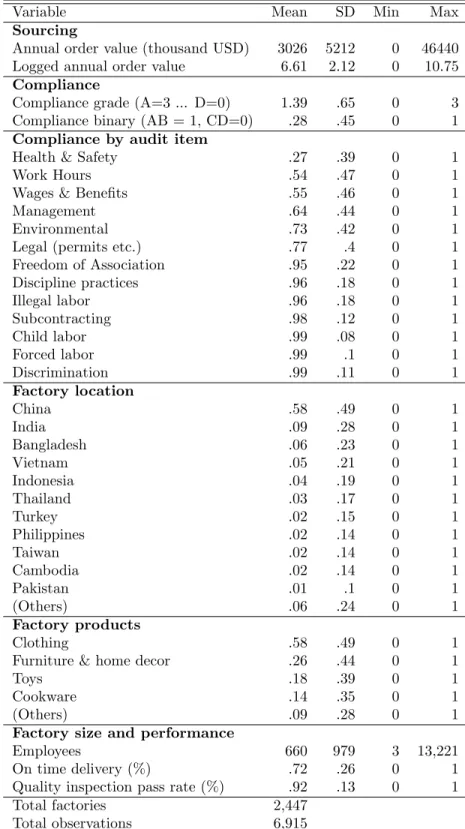
In addition to annual order values and factory compliance data, the sourcing agent provided information on factories’ locations, product types, delivery perfor-mance, and product quality. Descriptive statistics on all variables appear in Ap-pendix Table A1. The export factory panel is composed of factories with valid compliance, order value, and manufacturing performance data in at least two years over 2009-2012. The sourcing agent only records factory on-time delivery and quality performance in years that it places orders at that factory. Therefore the main panel represents only a subsample of the entire population of exporting factories. To en-sure that findings are not idiosyncratic to factories with manufacturing performance data, a second analysis examines all factories that appear in at least two years of the panel.
Studying trade and social institutions in this sample has both advantages and disadvantages. These exporter-importer transactions offer an appealing behavioral measure of the economic incentives surrounding labor and environmental standards: the decision by importers to place orders at factories. In contrast to previous studies examining worker rights outcomes at the national level, this analysis isolates mech-anisms operating at the firm level. Factory compliance with standards is measured by inspections conducted by external auditors, rather then self-reporting by factory management through surveys. In addition, the panel structure of these data offers an opportunity to control for unobserved time-invariant features of factories and ge-ographies. Finally, because the sourcing agent works with hundreds of importers these empirical results also have improved external validity over the single-importer studies that dominate the existing literature on transnational private regulation.7
6Deflators for USD-denominated orders were obtained from the Bureau of Labor
Statistics’ Import Price Index series for “Consumer Goods, Excluding Automotives” (http://www.bls.gov/web/ximpim/beaimp.htm, accessed Oct 26, 2015). Analyzing non-deflated nominal currency data does not significantly alter the results.
7One notable exception is Toffel, Short and Ouellet (2015), who analyze factory compliance in a
multi-importer context and find that prosocial attitudes and economic development in the home countries of importers are associated with improved factory compliance with social standards.
At the same time, this study is not a census of global supply chains. The importers studied are primarily retailers, and apparel manufacturers account for 58% of the exporter panel. This industry has been a target of anti-sweatshop campaigns, a fact we exploit when exploring mechanisms. However, this suggests that results are generalizable only to particular industries, not all global supply chains. In addition, confidentiality considerations led the sourcing agency to provide only annual order value at each factory. We therefore cannot decompose firm-level trade into quantities and prices. This constrains analysis of the economic implications of our findings, as discussed in the concluding section.
Firm-level trade and exporter compliance
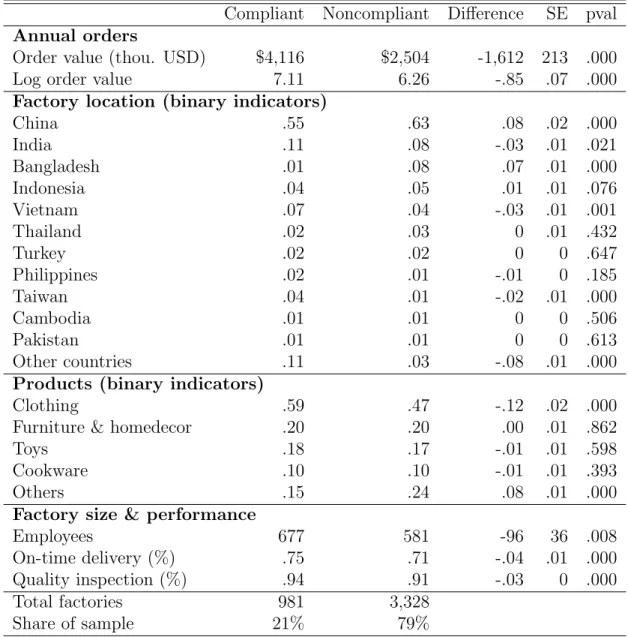
Do importers prefer exporters with higher or lower workplace standards? We find that compliant factories receive markedly more business than noncompliant factories (Table 1). In 2012, 21% were rated compliant in at least half of their audits (some factories are audited multiple times in a single year). On average, these factories received 64% greater order value than those rated noncompliant. Average buyer spend was USD 4.1 million in compliant factories, compared to USD 2.5 million in noncompliant factories. Adjusted for factory size, compliant factories received $6,080 in orders per employee whereas non-compliant factories received $4,308.
[Table 1 here]
The rewards for compliance appear large in this cross-sectional analysis. How-ever, this comparison may not represent a credible estimate of the relationship be-tween compliance and importer purchasing decisions. Table 1 also compares other qualities of compliant and noncompliant factories in 2012. They differ in many ways. Chinese, Bangladeshi, and Indonesian factories are more likely to be found in the noncompliant group. Compliant factories are more likely to manufacture clothing, employ roughly one hundred (17%) more people on average, and exhibit superior quality and on-time delivery performance.
Fitting an OLS model of order value using all variables in Table 1 as predic-tors estimates smaller effects of factory compliance on orders: an increase of USD 926 thousand (Appendix Table A3). This estimate is more credible than the previ-ous comparison, but it cannot exclude the possibility that unobserved factory-level differences correlated with compliance levels are biasing effect estimates. For ex-ample, it seems likely that—even after controlling for factory size and performance
in on-time delivery and product quality—compliant factories may also enjoy advan-tages in management practices, human capital, or technology that support superior productivity (Bloom et al. 2013).
To account for time-invariant differences (country, product type, ownership, etc.) across factories, we use the panel structure of the data to generate within-factories estimates of the effect of changes in exporter compliance status on importer purchasing behavior. The effect of compliance on orders is estimated by fitting a standard two-way fixed effects regression model, both with and without time-varying factory performance metrics.
Yit = ηi+ δt+ β1 Complianceit+ εit (1)
Yit= ηi+ δt+ β1 Complianceit+ β2 OnTimeit+ β2 Qualityit+ εit. (2)
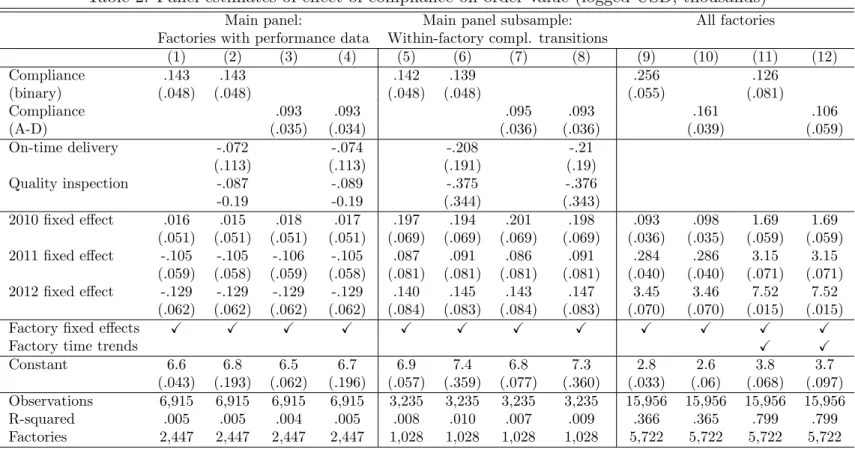
Each model is fit using both the binary measure of compliance and the annual average of the 4-point compliance score (A=3, B=2, C=1, D=0) as explanatory variables. The left-hand panel of Table 2 (columns 1-4) fits these models using the main factory panel summarized in Appendix Table A1. The center panel (columns 5-8) fits the same models on the subsample of factories that undergo changes in compliance status during the period studied.
Under the twin assumptions that compliance raises unit prices and that im-porters will not pay more to do business with compliant exim-porters, we expect that when factories raise standards, they should lose business. Instead, we observe the opposite pattern. Across both samples, achieving compliance is associated with an increase in purchasing. This effect holds whether compliance is measured using the raw four-point audit score or the binary compliance simplification. Adding controls for manufacturing performance has almost no impact on effect magnitudes.
As noted above, not all factories have performance, sourcing, and compliance data in at least two years of the panel. The rightmost section of Table 2 therefore expands to include the larger panel of factories that have at least two years of compli-ance and purchasing data. The main effects strengthen when we expand the sample to include these factories (Columns 9 and 10). In the final two columns, we further relax identification assumptions by adding factory-specific linear time trends to the model (i.e. introducing j=5,722 linear time trend predictors corresponding to each
factory in the panel). Yit = ηi+ δt+ β1 Complianceit+ j X i=1 γi Trendi+ εit (3) [Table 2 here]
This model relaxes the parallel trends assumption in standard fixed effects models, as biases introduced by divergent linear trends across groups are captured by the factory-specific trends. To the extent that factory trends are correlated with any exogenous changes in factory compliance, they will erroneously bias estimates of the compliance toward zero. Columns 11 and 12 of Table 2 report point estimates that are positive and similar in magnitude to estimations from the main panel. However, these estimates are less precise, with 95% confidence intervals that include zero.
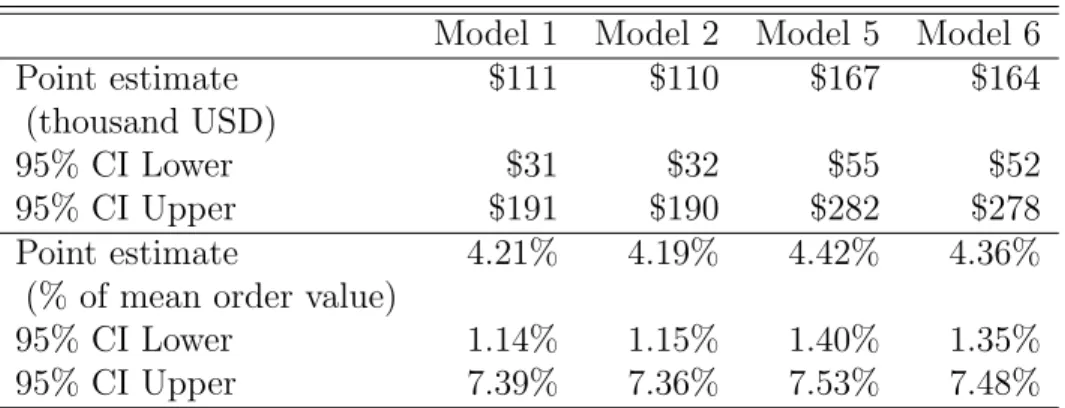
What is the economic significance of these effects? Table 3 reports effect mag-nitudes from the main panel estimates in both dollars and percent of annual order value. The models yield point estimates of increased order value ranging from USD 111,000 to 168,000 when an exporter transitions from noncompliant to compliant. This represents a 4% average increase in annual order value. These figures estimate annual purchasing using the midpoints of the annual purchasing bins provided by the sourcing agent. We also report linear probability models of exceeding various order thresholds in Appendix Table A5. These estimates find effects across several thresh-olds. For example, compliance is associated with a 4.8% increase in the probability of receiving more than $250,000 in annual orders. These analyses show that effects are not driven by the high-uncertainty purchasing bins at the top of the distribution, nor are they driven by one idiosyncratic transition between order bins.
The magnitude of the within-factories effect is modest, and our data also con-firm that many noncompliant factories continue to operate in global supply chains. Nonetheless we find evidence that importing firms in our sample prefer purchasing from export factories that comply with minimum labor and environmental standards.
[Table 3 here]
Rewards and Penalties
Two incentive mechanisms may explain the effects detected above. First, importers may increase purchasing when factories achieve compliance, rewarding factories for
improvement. Second, they may reduce orders from factories that fall out of compli-ance, penalizing exporters whose standards decline.
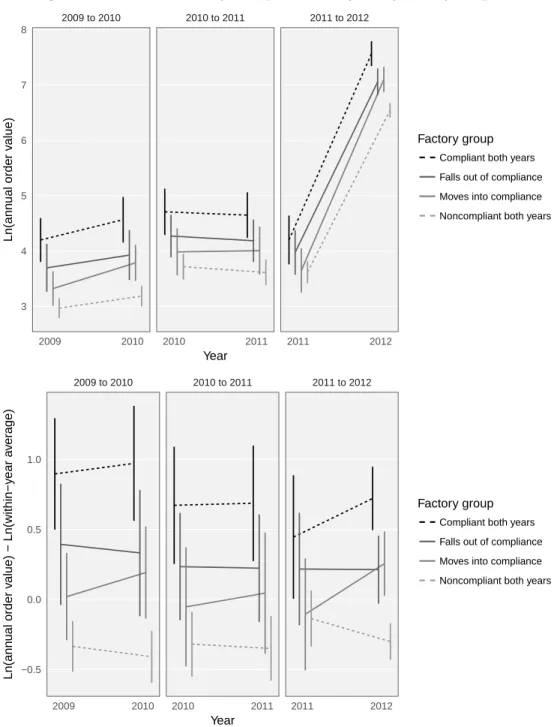
We next divide factories into four groups within each two-year period: com-pliant in both years, falling out of compliance, moving into compliance, and non-compliant in both years. Comparing the first two groups reveals penalties for falling out of compliance. Comparing the latter two tells us whether there are rewards for achieving compliance. The initial results of this analysis are ?isualized in Figure 4. The top panel shows the raw results, and the bottom normalizes each year by the within-year mean order value, which helps to visualize results from 2011-2012 when overall orders increase for all groups. The figures suggest both negative incentives (penalties) and positive incentives (rewards) for complying with standards.
[Figure 4 here] [Figure 5 here]
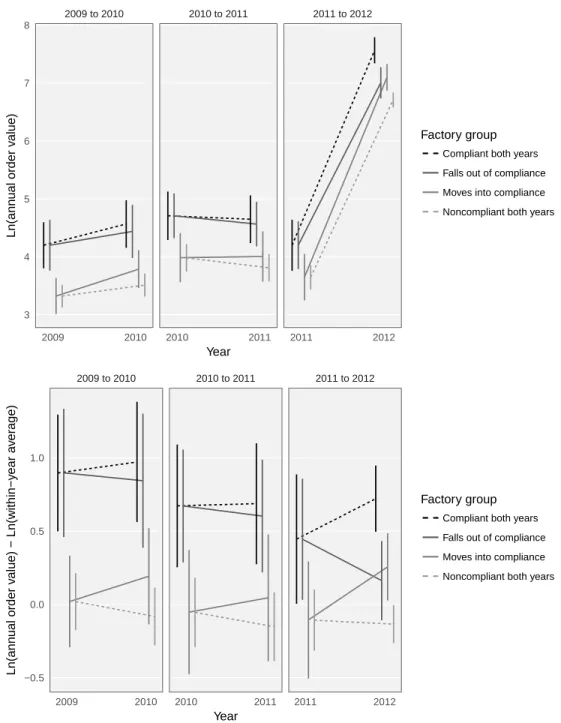
To reduce pre-treatment differences between factory groupings, we then use entropy balancing (Hainmueller 2012) to reweight the samples to achieve balanced moments on a variety of covariates (Appendix Table A6). In the reweighted sam-ples, factories that transition and maintain their compliance status exhibit identical distributions of factory locations, product types, and initial-period order values. In 2010-2011 and 2011-2012, we also include the prior-year purchase value trend to control for divergent trends pre-dating the compliance transition. The graphical analysis in Figure 5 again shows relative declines for factories that fall out of com-pliance (compared to those that stay compliant) and relative gains for factories that achieve compliance (compared to those that stay noncompliant). Regression anal-yses of the unbalanced and balanced samples for each two-year panel are reported in Appendix Table A7. The effect of rebalancing on effect magnitude is mixed, but the evidence across all estimations and years is consistent with positive incentives for factories that achieve compliance and (weaker) penalties for those that fall out of compliance.
Which industries exhibit compliance effects?
The firms in this study include exporters in a variety of product categories. We use this variation to further test the plausibility of the results and explore possible mechanisms. One possible explanation of the patterns above is that importers use
the compliance results to avoid the reputational risk of dealing with exporters en-gaged in socially harmful practices. Financial markets penalize firms for revelations of environmentally harmful activities, industrial accidents, and activist campaigns (Flammer 2013; King and Soule 2007). For consumer-facing firms like the retailers in our study, the perception that their suppliers exploit workers or cause environmental harm could have negative financial consequences.
Among the industries in this study, the global apparel industry has been more exposed to anti-sweatshop activism (Bartley and Child 2014). Other common product types like home furnishings (26% of exporters) and cookware (14%) have not been subject to similarly intense campaigns. If the mechanism generating our effects is the preference of certain importers to avoid non-compliant factories—rather than compliance-transitions being correlated with some unobservable quality of the product or factory—we expect effects to be strongest in industries targeted by activist campaigns. If our effects were driven instead by industries that are not subject to these campaigns, a different mechanism may be at work.
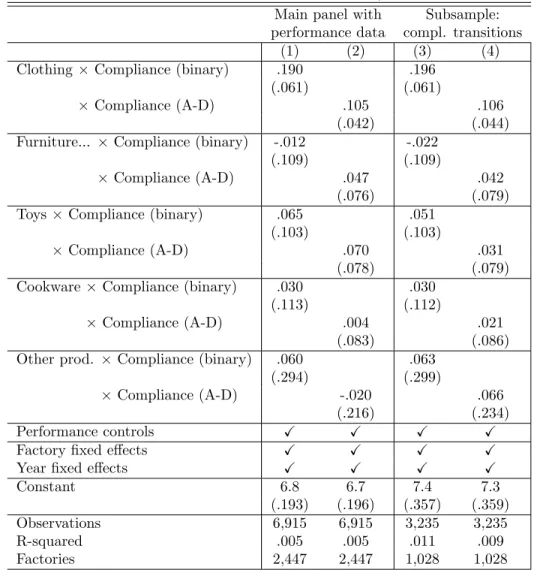
To explore this possibility, we estimate heterogeneous treatment effects by exporter industry. Table 4 shows that the only exporter industry in which effects are statistically different from zero is clothing. The effect magnitude of the binary compliance measure is roughly triple the next largest estimates, from toys and other products. This effect persists using both binary and continuous compliance indi-cators, and examining either the entire panel (columns 1 and 2) or the subset of factories that undergo compliance transitions (columns 3 and 4). This pattern is consistent with a mechanism in which importers subject to activist pressure prefer importing from compliant factories in order to reduce reputational risk.8
[Table 4 here]
Discussion
The importers in our study exhibit a preference for doing business with exporters that comply with basic labor and environmental standards. This pattern is
inconsis-8Additional analyses and robustness checks appear in the online appendix. These include relaxing
the linearity assumption of performance controls, adding industry-specific trends in purchasing, adding controls for the length of the relationship between the sourcing agent and the manufacturers, and re-estimating effects in China and the rest of the world. The appendix also presents qualitative summaries of the common violations of key audit items.
tent with either one or the other following assumptions underlying the race-to-the-bottom logic in global trade: (a) that compliance with basic labor and environmental standards makes exporters less competitive in price, quality, or delivery, or (b) that importers are unwilling to pay more to do business with compliant exporters. The absence of quantities and prices in our data do not allow us to tell which of these assumptions is inaccurate. We can say that they do not appear to simultaneously obtain in this sample of retailers and export manufacturers.
Our results suggest the presence of economic incentives for complying with social and environmental standards, whether these dynamics are driven by certain exporters proactively improving compliance or by the demands and market power of importers. Perhaps most surprising is that we observe these effects in emerging markets with poor enforcement of labor and associational rights. In this study, 91% of the export transactions (by value) originate from countries in the bottom two quartiles of fundamental labor rights, and 78% originate from countries in the bottom quartile in freedom of association rights (Appendix Table A2).
Understanding these dynamics in global supply chains is important to un-derstanding the contemporary nexus of trade and social institutions. International trade is increasingly characterized by the prevalence of global supply (or value) chains (Porter 1986; Gereffi and Sturgeon 2005). In 2009, intermediate inputs traded within global supply chains accounted for 30% to 60% of national exports in G20 countries (OECD, WTO, and World Bank Group 2014). As a growing share of trade takes place within global supply chains, understanding their political economy is both the-oretically relevant and of growing policy importance. The accompanying fragmenta-tion and worldwide dispersion of producfragmenta-tion have created significant challenges for traditional forms of regulation of labor and environmental standards.
We estimate that achieving compliance with basic standards results in im-porters increasing annual order value by 4% on average (Table 3). Do these incen-tives for compliance imply that raising workplace standards is a good investment for emerging market exporters? The answer depends on whether the increase in order value results primarily from increased quantities or prices.9 If the compli-ance premium is due entirely to increased volume, and assuming momentarily that compliance is costless and other costs scale with volume, the factory’s increase in
9In the following calculations, we assume that the 4% increase in buyer spend is uniform across
all customers of the exporter, even though our data only captures this relationship for the group of importers represented by the sourcing company.
operating profit is modest. Assuming a profit margin of 2%, this volume premium would amount to an increase in gross profit by just 2% × 4% = .08%, before ac-counting for any costs of compliance. Yet if the 4% increase in value is a price premium, the same manufacturer’s profit margin would increase from 2% to 6.1%. Decomposing the compliance premium into quantities and prices is therefore crucial to understanding the implications for exporters.
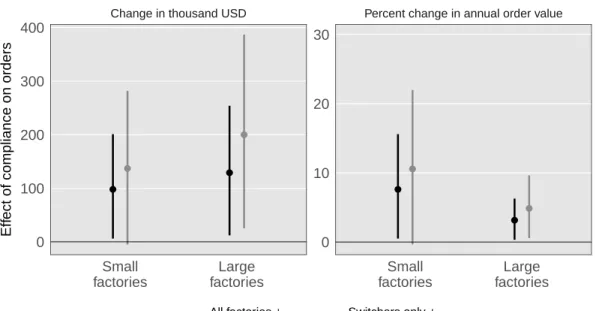
To put these premiums in context, consider the costs of paying “living wages” to emerging market manufacturing workers. The Fair Wear Foundation (2014) ex-amined garment manufacturers in China and Vietnam and estimated paying a living wage would require a 10% to 102% increase in mode sewing wages. In turn, these wage increases would raise unit prices paid by importers by 2% to 12% (2014: 18). A compliance premium of 4%, if partially composed of a price premium, could there-fore offset the cost of living wages in some exporters. The prospects for doing so appear greater in small exporters, where the compliance premium point estimate ranges from 7%-10% of average order size (Figure 6).
[Figure 6 here]
The foregoing analysis of the economic returns to compliance is necessarily somewhat speculative. Future work using more fine-grained data on prices and quan-tities may clarify these returns and their implications for investments in improved labor and environmental standards.
This study also suggests that transnational private regulation may be more effective than previously believed. The analysis suggests the presence of economic in-centives for compliance in industries characterized by strong activist campaigns and private regulatory responses from industry. This finding complements new survey research on the willingness of developing country producers to incur compliance costs to integrate into global supply chains (Malesky and Mosley 2016). However, it also raises new questions about private regulation in global supply chains. Are the incen-tives detected here sufficient to support desired investments in worker wages, factory safety, and environmental impact mitigation? What is the appropriate compliance premium in both price and volume to justify these investments? Future research may answer these questions and provide practical recommendations on the design of multinational sourcing practices that support improved labor and environmental standards.
This study is the first to estimate the relationship between exporter social compliance and importer behavior in a large international sample of factories, but
there are important limitations to keep in mind. First, we cannot tell whether we observe these patterns because (a) certain exporters can achieve compliance with minimum standards without raising prices, or (b) certain importers are willing to pay more to do business with compliant exporters. We can only infer that both are not simultaneously true. Second, because these data come from one sourcing agent, they do not account for the entire portfolio of customers for each exporting factory. These unobserved customers may be indifferent to social compliance or even reduce orders when factories achieve compliance. In the latter case, the estimated effect of compliance may represent a reallocation of business away from importers that are insensitive to social compliance and toward importers in our study who are sensi-tive to compliance. In this case, it seems likely that the reallocation occurs because exporters perceive economic benefits to doing business with reputation-sensitive im-porters, such as better prices or opportunities for growth. Addressing these possibil-ities awaits future research using the administrative records of exporting factories, rather than their customers. Third, the patterns observed here pertain to trade be-tween retailers in western countries and exporters of light manufactures in emerging markets. The study has little to say about incentives for compliance in other global supply chains, such as those for electronics, minerals, or agricultural products, or where both trading partners are based in developing or middle-income countries.
Although within-factories estimates from panel data offer improved causal credibility over cross-sectional analyses, these models may also obscure alternative causal pathways between compliance to importer behavior. If exporters build durable reputations as either socially compliant or noncompliant, importers familiar with these reputations may discount information transmitted through compliance au-dits, reasoning that some year-on-year variation reflects measurement error rather than meaningful improvement or declines. Consistent with this supposition, we find smaller magnitude effects of compliance on factories that have longer business re-lationships with the sourcing agent, although we cannot reject the hypothesis that these effects are identical (Appendix Table A12). Panel fixed-effects models remove any static effects from durable factory reputations. This reduces bias insofar as these reputations reflect issues other than social compliance and are correlated with com-pliance status in cross-section. However, if reputations for social responsibility are themselves important drivers of customer orders, factory fixed-effects would mask these relationships.
to debates about a race to the bottom in global supply chains (Rodrik 1997; Vo-gel 2005; Mosley 2010; Locke 2013; Weil 2014). The results suggest the possibil-ity of a “high road” to growth for small exporters in emerging markets. Social upgrading—achieving compliance with international labor, health, and environmen-tal standards—may offer an opportunity for these enterprises to pursue more lucra-tive opportunities in the global economy. Yet it is also clear that whatever market incentives exist for such social upgrading, they are insufficient to bring the majority of exporters in this study into compliance. Although the net impact of activist cam-paigns and resulting private regulatory activities may be positive, this model still falls far short of guaranteeing basic rights for the millions of workers employed in global supply chains.
References
Amengual, Matthew. 2010. “Complementary Labor Regulation: The Uncoordinated Combination of State and Private Regulators in the Dominican Republic.” World Development 38(3):405–414.
Amengual, Matthew and Laura Chirot. 2016. “Reinforcing the State: Transnational and State Labor Regulation in Indonesia.” Industrial and Labor Relations Review p. doi: 10.1177/0019793916654927.
Anner, Mark. 2012. “Corporate Social Responsibility and Freedom of
Associa-tion Rights The Precarious Quest for Legitimacy and Control in Global Supply Chains.” Politics & Society 40(4):609–644.
Ansell, Ben W. 2008. “Traders, teachers, and tyrants: democracy, globalization, and public investment in education.” International Organization 62(2):289–322. Barrientos, Stephanie. 2013. “Corporate Purchasing Practices in Global Production
Networks: A Socially Contested Terrain.” Geoforum 44:44–51.
Bartley, Tim. 2007. “Institutional Emergence in an Era of Globalization: The Rise of Transnational Private Regulation of Labor and Environmental Conditions.” American Journal of Sociology 113(2):297–351.
Bartley, Tim and Curtis Child. 2014. “Shaming the corporation: The social produc-tion of targets and the anti-sweatshop movement.” American Sociological Review 79(4):653–679.
Bloom, Nicholas, Benn Eifert, Aprajit Mahajan, David McKenzie and John Roberts. 2013. “Does Management Matter? Evidence from India.” The Quarterly Journal of Economics 128(1):1–51.
Cao, Xun, Brian Greenhill and Aseem Prakash. 2013. “Where is the tipping point? Bilateral trade and the diffusion of human rights.” British Journal of Political Science 43(01):133–156.
Chan, Anita. 2003. “Racing to the bottom: international trade without a social clause.” Third World Quarterly 24(6):1011–1028.
Chan, Jenny, Ngai Pun and Mark Selden. 2013. “The politics of global produc-tion: Apple, Foxconn and China’s new working class.” New Technology, Work and Employment 28(2):100–115.
Coslovsky, Salo V and Richard Locke. 2013. “Parallel Paths to Enforcement: Pri-vate Compliance, Public Regulation, and Labor Standards in the Brazilian Sugar Sector.” Politics & Society 41(4):497–526.
De Janvry, Alain, Craig McIntosh and Elisabeth Sadoulet. 2015. “Fair trade and free entry: can a disequilibrium market serve as a development tool?” Review of Economics and Statistics 97(3):567–573.
Distelhorst, Greg, Richard M Locke, Timea Pal and Hiram M Samel. 2015. “Pro-duction Goes Global, Compliance Stays Local: Private regulation in the global electronics industry.” Regulation & Governance 9:224–242.
Drezner, Daniel W. 2001. “Globalization and policy convergence.” International Studies Review 3(1):53–78.
Under Globalization? Peterson Institute.
Engels, Friedrich. 1888. On the Question of Free Trade: Preface for the 1888 English edition pamphlet.
URL: https://www.marxists.org/archive/marx/works/1888/free-trade/index.htm Fair Wear Foundation. 2014. “Living Wage Engineering.”.
URL: http://goo.gl/p6ZVb0
Flammer, Caroline. 2013. “Corporate Social Responsibility and Shareholder Re-action: The Environmental Awareness of Investors.” Academy of Management Journal 56(3):758–781.
Fung, Archon, Dara O’Rourke and Charles F. Sabel. 2001. Can We Put an End to Sweatshops? A New Democracy Forum on Raising Global Labor Standards. Beacon Press.
Garrett, Geoffrey. 1998. “Global markets and national politics: collision course or virtuous circle?” International Organization 52(4):787–824.
Gereffi, Gary, Humphrey John and Timothy Sturgeon. 2005. “The governance of global value chains.” Review of International Political Economy 12(1):78–104. Greenhill, Brian, Layna Mosley and Aseem Prakash. 2009. “Trade-based diffusion
of labor rights: A panel study, 1986–2002.” American Political Science Review 103(04):669–690.
Hafner-Burton, Emilie M. 2005. “Trading human rights: How preferential
trade agreements influence government repression.” International Organization 59(3):593–629.
Hainmueller, Jens. 2012. “Entropy Balancing for Causal Effects: A Multivariate Reweighting Method to Produce Balanced Samples in Observational Studies.” Po-litical Analysis 20(1):25–46.
Hainmueller, Jens, Michael J Hiscox and Sandra Sequeira. 2015. “Consumer demand for Fair Trade: evidence from a multistore field experiment.” Review of Economics and Statistics 97(2):242–256.
Harrison, Ann and Jason Scorse. 2010. “Multinationals and Anti-Sweatshop Ac-tivism.” The American Economic Review 100(1):247–273.
King, Brayden G and Sarah A Soule. 2007. “Social movements as extra-institutional entrepreneurs: The effect of protests on stock price returns.” Administrative Sci-ence Quarterly 52(3):413–442.
Kucera, David. 2001. “The Effects of Core Workers Rights on Labour Costs and Foreign Direct Investment: Evaluating the Conventional Wisdom.” International Labour Organization .
URL: https://goo.gl/dYalZC
Levi, Margaret, Christopher Adolph, Daniel Berliner, Aaron Erlich, Anne Greenleaf, Milli Lake and Jennifer Noveck. 2013. “Aligning Rights and Interests: Why, When and How to Uphold Labor Standards.” The World Bank: Background Paper For The World Development Report 2013 .
URL: https://goo.gl/rsxNJu
Locke, Richard M. 2013. The Promise and Limits of Private Power: Promoting Labor Standards in a Global Economy. Cambridge University Press.
Locke, Richard M., Fei Qin and Alberto Brause. 2007. “Does Monitoring Improve Labor Standards? Lessons from Nike.” Industrial and Labor Relations Review 61(1):3–31.
Locke, Richard M., Matthew Amengual and Akshay Mangla. 2009. “Virtue out of Necessity? Compliance, Commitment, and the Improvement of Labor Conditions in Global Supply Chains.” Politics & Society 37(3):319.
Lund-Thomsen, Peter and Adam Lindgreen. 2014. “Corporate social responsibility in global value chains: Where are we now and where are we going?” Journal of Business Ethics 123(1):11–22.
Malesky, Edmund and Layna Mosley. 2016. “Chains of Love? Global Production, Developing Country Firms and the Diffusion of Labor Standards.” Niehaus Center, Princeton University: Workshop on The Politics of Multinational Firms, Govern-ments, and Global Production Networks .
Mattli, Walter and Tim B¨uthe. 2005. “Accountability in Accounting? The Politics of Private Rule-Making in the Public Interest.” Governance 18(3):399–429. Mayer, Frederick and Gary Gereffi. 2010. “Regulation and economic globalization:
Prospects and limits of private governance.” Business and Politics 12(3).
Milewicz, Karolina M., James Hollway, Claire Peacock and Duncan Snidal. 2016. “Beyond trade: the expanding scope of the nontrade agenda in trade agreements.” Journal of Conflict Resolution p. doi: 10.1177/0022002716662687.
Mosley, Layna. 2010. Labor Rights and Multinational Production. Cambridge Uni-versity Press.
Mosley, Layna and Saika Uno. 2007. “Racing to the bottom or climbing to the top? Economic globalization and collective labor rights.” Comparative Political Studies 40(8):923–948.
Nadvi, Khalid and Gale Raj-Reichert. 2015. “Governing health and safety at lower tiers of the computer industry global value chain.” Regulation & Governance 9:243– 258.
Neumayer, Eric and Indra De Soysa. 2006. “Globalization and the right to free association and collective bargaining: An empirical analysis.” World Development 34(1):31–49.
OECD, WTO, and World Bank Group. 2014. Global Value Chains: Challenges, Opportunities and Implications for Policy.
URL: https://www.oecd.org/tad/gvc report g20 july 2014.pdf
Oka, Chikako. 2012. “Does Better Labour Standard Compliance Pay? Linking
Labour Standard Compliance and Supplier Competitiveness.” Better Work Dis-cussion Paper Series 5.
URL: https://goo.gl/gZtRF7
O’Rourke, Dara. 2003. “Outsourcing Regulation: Analyzing Nongovernmental Sys-tems of Labor Standards and Monitoring.” Policy Studies Journal 31(1):1–29. Porter, Michael E. 1986. “Changing patterns of international competition.”
Califor-nia Management Review 28(2):9–40.
Rickard, Stephanie J. 2012. “Welfare versus subsidies: Governmental spending de-cisions in an era of globalization.” The Journal of Politics 74(04):1171–1183.
Rodrik, Dani. 1997. Has Globalization Gone Too Far? Peterson Institute.
Rodrik, Dani. 1998. “Why do more open economies have bigger governments?” Journal of Political Economy 106(5):997–1032.
Rudra, Nita. 2005. “Are workers in the developing world winners or losers in the current era of globalization?” Studies in Comparative International Development 40(3):29–64.
Rudra, Nita. 2008. Who Really Gets Hurt? Globalization and the Race to the Bottom in Developing Countries. Cambridge University Press.
Ruwanpura, Kanchana N and Neil Wrigley. 2011. “The Costs of Compliance? Views of Sri Lankan Apparel Manufacturers in Times of Global Economic Crisis.” Journal of Economic Geography 11(6):1031–1049.
Seidman, Gay. 2007. Beyond the Boycott: Labor Rights, Human Rights, and Transna-tional Activism. Russell Sage Foundation Publications.
Toffel, Michael W, Jodi L Short and Melissa Ouellet. 2015. “Codes in context: How states, markets, and civil society shape adherence to global labor standards.” Regulation & Governance 9(3):205–223.
Vadlamannati, Krishna Chaitanya. 2015. “Rewards of (Dis) Integration Economic, Social, and Political Globalization and Freedom of Association and Collective Bar-gaining Rights of Workers in Developing Countries.” Industrial and Labor Relations Review 68(1):3–27.
Vogel, David. 1995. Trading up: Consumer and environmental regulation in a global economy. Harvard University Press.
Vogel, David. 2005. The market for virtue: The potential and limits of corporate social responsibility. Brookings Institution Press.
Vogel, David. 2008. “Private Global Business Regulation.” Annual Review of Political Science 11:261–282.
Weil, David. 2014. The Fissured Workplace: Why Work Became So Bad for So Many and What Can Be Done to Improve It. Harvard University Press.
Workers Rights Consortium. 2014. Stealing from the Poor: Wage Theft in the Haitian Apparel Industry. Research Report.
Figure 1: Hypothesized mechanisms linking trade and social institutions
Trade leads to…
Race to the bottom
Downward harmonization of standards
“California effects”
Upward harmonization of standards
1 2 through the actions of...
States Firms
States compete by reducing regulatory burdens
States negotiate common standards; powerful parties set them
Previous empirical research: National policies set by states Vogel 1995, Rodrik 1997, Kucera 2001, Rudra 2002, 2008, Greenhill, Mosley & Prakash 2009, Mosley 2010, Vadlamannati 2015. Previous empirical research:
National outcomes (e.g. violations) shaped by both states and firms Kucera 2001, Neumayer & de Soysa 2006, Mosley & Uno 2007, Greenhill, Mosley & Prakash 2009, Mosley 2010, Vadlamannati 2015.
Exporters compete by reducing compliance with standards Importers prefer buying from higher-standards exporters
This study focuses on firm-level mechanisms
Figure 2: Importers are primarily retailers in advanced economies Clothing Stores, 33% Department Stores, 24% Apparel Wholesalers, 17% Other Retailer, 11% Discount Retailers, 8% Grocery Stores, 4% Other, 3% 0% 25% 50% 75% 100% Purchasing share by importer industry (NAICS)
Retailers, 79% Non−retailers, 21% 0% 25% 50% 75% 100%
Purchasing share of retailers
North America, 73% Western Europe, 19% Rest of world, 8% 0% 25% 50% 75% 100% Purchasing share by importer HQ
Notes. Estimated distribution of importer industries and headquarter locations in sourcing agent data. Figure based on the top 200 importers in the sample, who account for an estimated 93% of import volume over 2009-2012.
Figure 3: Importers purchase from countries with poor labor rights
Country rating: Freedom of Association
Country rating: Fundamental Labor Rights
25% 50% 75% 25% 50% 75%
Bottom quartile 3rd quartile 2nd quartile Top quartile
Percent of total purchasing, 2009−2012
Notes. Distribution of purchasing value by exporting country in sourcing agent data. Freedom of association and labor rights country ratings from the World Justice Project, 2012-2013. Detailed purchasing by country reported in Appendix Table A2.
Figure 4: Order values by compliance trajectory, two-year panels 2009 to 2010 2010 to 2011 2011 to 2012 2009 2010 2010 2011 2011 2012 3 4 5 6 7 8 Year Ln(ann ual order v
alue) Factory group
Compliant both years Falls out of compliance Moves into compliance Noncompliant both years
2009 to 2010 2010 to 2011 2011 to 2012 2009 2010 2010 2011 2011 2012 −0.5 0.0 0.5 1.0 Year Ln(ann ual order v alue) − Ln(within−y ear a v er age) Factory group
Compliant both years Falls out of compliance Moves into compliance Noncompliant both years
Notes. Two-year panels of factory mean order value (logged thousand USD), sorted by factory compliance trajectories. From top to bottom, factories are either (a) compliant in both years, (b) compliant, then noncompliant, (c) noncompliant, then compliant, and (d) noncompliant in both years. Bottom panel subtracts within-year order value means to aid interpretation. Note that annual means vary by facet because each analysis includes only factories with observations in both years. Error bars show 95% confidence intervals.
Figure 5: Order values by compliance trajectory (entropy-balanced subsamples) 2009 to 2010 2010 to 2011 2011 to 2012 2009 2010 2010 2011 2011 2012 3 4 5 6 7 8 Year Ln(ann ual order v
alue) Factory group
Compliant both years Falls out of compliance Moves into compliance Noncompliant both years
2009 to 2010 2010 to 2011 2011 to 2012 2009 2010 2010 2011 2011 2012 −0.5 0.0 0.5 1.0 Year Ln(ann ual order v alue) − Ln(within−y ear a v er age) Factory group
Compliant both years Falls out of compliance Moves into compliance Noncompliant both years
Notes. Adjusting the analysis in Figure 4 using entropy balancing (Hainmueller 2012). Each factory subsample is balanced on first-year order value, prior-year order value trend, distribution of factory locations, and distribution of factory product-types. Note that pre-trends are not available for balancing in 2009-2010 because we have no prior-year order value to establish trends. See Appendix Table A7 for regression estimates and Appendix Table A6 for balance tables. Error bars show 95% confidence intervals.
Figure 6: Effects of compliance by factory size ● ● ● ● ● ● ● ● Change in thousand USD Percent change in annual order value
Small factories Large factories Small factories Large factories 0 10 20 30 0 100 200 300 400 Eff
ect of compliance on orders
● All factories + ●
performance controls
Switchers only + performance controls
Notes. Effects of compliance on order value by factory size, estimated in panel mod-els reported in the appendix. Factories are divided into two equally-sized pools by average annual employment: small (4-293 employees) and large (293-11,105 employ-ees). Error bars show 95% confidence intervals. Results also reported in Appendix Table A11.
Table 1: Cross-sectional comparison of compliant and noncompliant factories (2012)
Compliant Noncompliant Difference SE pval
Annual orders
Order value (thou. USD) $4,116 $2,504 -1,612 213 .000
Log order value 7.11 6.26 -.85 .07 .000
Factory location (binary indicators)
China .55 .63 .08 .02 .000 India .11 .08 -.03 .01 .021 Bangladesh .01 .08 .07 .01 .000 Indonesia .04 .05 .01 .01 .076 Vietnam .07 .04 -.03 .01 .001 Thailand .02 .03 0 .01 .432 Turkey .02 .02 0 0 .647 Philippines .02 .01 -.01 0 .185 Taiwan .04 .01 -.02 .01 .000 Cambodia .01 .01 0 0 .506 Pakistan .01 .01 0 0 .613 Other countries .11 .03 -.08 .01 .000
Products (binary indicators)
Clothing .59 .47 -.12 .02 .000
Furniture & homedecor .20 .20 .00 .01 .862
Toys .18 .17 -.01 .01 .598
Cookware .10 .10 -.01 .01 .393
Others .15 .24 .08 .01 .000
Factory size & performance
Employees 677 581 -96 36 .008
On-time delivery (%) .75 .71 -.04 .01 .000
Quality inspection (%) .94 .91 -.03 0 .000
Total factories 981 3,328
Share of sample 21% 79%
Notes. Standard errors and p-values from two-sided t-tests assuming unequal vari-ances. Note that there are more factories in this cross-sectional 2012 sample than the subsequent panel analysis, as the panel analysis excludes factories that appear only once in the four-year panel. For regression analysis of order value using these variables as predictors, see Appendix Table A3.
Table 2: Panel estimates of effect of compliance on order value (logged USD, thousands)
Main panel: Main panel subsample: All factories
Factories with performance data Within-factory compl. transitions
(1) (2) (3) (4) (5) (6) (7) (8) (9) (10) (11) (12) Compliance .143 .143 .142 .139 .256 .126 (binary) (.048) (.048) (.048) (.048) (.055) (.081) Compliance .093 .093 .095 .093 .161 .106 (A-D) (.035) (.034) (.036) (.036) (.039) (.059) On-time delivery -.072 -.074 -.208 -.21 (.113) (.113) (.191) (.19) Quality inspection -.087 -.089 -.375 -.376 -0.19 -0.19 (.344) (.343) 2010 fixed effect .016 .015 .018 .017 .197 .194 .201 .198 .093 .098 1.69 1.69 (.051) (.051) (.051) (.051) (.069) (.069) (.069) (.069) (.036) (.035) (.059) (.059) 2011 fixed effect -.105 -.105 -.106 -.105 .087 .091 .086 .091 .284 .286 3.15 3.15 (.059) (.058) (.059) (.058) (.081) (.081) (.081) (.081) (.040) (.040) (.071) (.071) 2012 fixed effect -.129 -.129 -.129 -.129 .140 .145 .143 .147 3.45 3.46 7.52 7.52 (.062) (.062) (.062) (.062) (.084) (.083) (.084) (.083) (.070) (.070) (.015) (.015)
Factory fixed effects X X X X X X X X X X X X
Factory time trends X X
Constant 6.6 6.8 6.5 6.7 6.9 7.4 6.8 7.3 2.8 2.6 3.8 3.7
(.043) (.193) (.062) (.196) (.057) (.359) (.077) (.360) (.033) (.06) (.068) (.097)
Observations 6,915 6,915 6,915 6,915 3,235 3,235 3,235 3,235 15,956 15,956 15,956 15,956
R-squared .005 .005 .004 .005 .008 .010 .007 .009 .366 .365 .799 .799
Factories 2,447 2,447 2,447 2,447 1,028 1,028 1,028 1,028 5,722 5,722 5,722 5,722
Notes. OLS panel fixed effects regression from 2009 to 2012. Models (1) – (4) fit using main panel of factories with performance data (Table A1). Models (5) – (8) fit on subsample of the main panel that undergoes a transition in compliance status over the period studied. Models (9) – (12) fit on all factories that appear at least twice in the panel, with 5,722 linear time-trends corresponding to each factory in Models (11) and (12). Standard errors clustered by factory in parentheses.
Table 3: Effects magnitudes from panel estimates
Model 1 Model 2 Model 5 Model 6
Point estimate $111 $110 $167 $164
(thousand USD)
95% CI Lower $31 $32 $55 $52
95% CI Upper $191 $190 $282 $278
Point estimate 4.21% 4.19% 4.42% 4.36%
(% of mean order value)
95% CI Lower 1.14% 1.15% 1.40% 1.35%
95% CI Upper 7.39% 7.36% 7.53% 7.48%
Notes. Average effects of moving from non-compliant to compliant on annual order value, calculated from panel models estimated in Table 2. Percentages based on mean order value among noncompliant factories in sample. Distributions of effect magnitudes obtained through bootstrapping (B=1,000).
Table 4: Effects of compliance by exporter industry (logged USD, thousands) Main panel with Subsample:
performance data compl. transitions
(1) (2) (3) (4)
Clothing × Compliance (binary) .190 .196
(.061) (.061)
Clothing× Compliance (A-D) .105 .106
(.042) (.044)
Furniture... × Compliance (binary) -.012 -.022
(.109) (.109)
Furniture... × Compliance (A-D) .047 .042
(.076) (.079)
Toys × Compliance (binary) .065 .051
(.103) (.103)
Toys× Compliance (A-D) .070 .031
(.078) (.079)
Cookware × Compliance (binary) .030 .030
(.113) (.112)
Cookware× Compliance (A-D) .004 .021
(.083) (.086)
Other prod. × Compliance (binary) .060 .063
(.294) (.299)
Other prod. × Compliance (A-D) -.020 .066
(.216) (.234)
Performance controls X X X X
Factory fixed effects X X X X
Year fixed effects X X X X
Constant 6.8 6.7 7.4 7.3
(.193) (.196) (.357) (.359)
Observations 6,915 6,915 3,235 3,235
R-squared .005 .005 .011 .009
Factories 2,447 2,447 1,028 1,028
Notes. OLS panel fixed effects regression from 2009 to 2012, showing heterogeneous effects by factory industry. Models (1) – (2) fit using main panel of factories with performance data (Table A1). Models (3) – (4) fit on subsample of the main panel that undergoes a transition in compliance status over the period studied. Standard errors clustered by factory in parentheses.
Online Appendix: Additional Tables and Figures
These appendices present supplementary analysis for Distelhorst, G. and Locke, R. “Does Compliance Pay?” American Journal of Political Science.
Table A1: Factory sourcing and compliance panel, 2009-2012
Variable Mean SD Min Max
Sourcing
Annual order value (thousand USD) 3026 5212 0 46440
Logged annual order value 6.61 2.12 0 10.75
Compliance
Compliance grade (A=3 ... D=0) 1.39 .65 0 3
Compliance binary (AB = 1, CD=0) .28 .45 0 1
Compliance by audit item
Health & Safety .27 .39 0 1
Work Hours .54 .47 0 1
Wages & Benefits .55 .46 0 1
Management .64 .44 0 1
Environmental .73 .42 0 1
Legal (permits etc.) .77 .4 0 1
Freedom of Association .95 .22 0 1 Discipline practices .96 .18 0 1 Illegal labor .96 .18 0 1 Subcontracting .98 .12 0 1 Child labor .99 .08 0 1 Forced labor .99 .1 0 1 Discrimination .99 .11 0 1 Factory location China .58 .49 0 1 India .09 .28 0 1 Bangladesh .06 .23 0 1 Vietnam .05 .21 0 1 Indonesia .04 .19 0 1 Thailand .03 .17 0 1 Turkey .02 .15 0 1 Philippines .02 .14 0 1 Taiwan .02 .14 0 1 Cambodia .02 .14 0 1 Pakistan .01 .1 0 1 (Others) .06 .24 0 1 Factory products Clothing .58 .49 0 1
Furniture & home decor .26 .44 0 1
Toys .18 .39 0 1
Cookware .14 .35 0 1
(Others) .09 .28 0 1
Factory size and performance
Employees 660 979 3 13,221
On time delivery (%) .72 .26 0 1
Quality inspection pass rate (%) .92 .13 0 1
Total factories 2,447
Table A2: Labor rights and exports in sourcing agent data
Fundamental labor rights Freedom of association/assembly
Export value Country USD (m) % Country USD (m) %
Top
quartile 1%
Brazil 3.9 .01
6%
Dom. Rep. 20.7 .07
Hong Kong 11.3 .04 Indonesia 1458.7 4.97
Korea 61.8 .21 Korea 61.8 .21
Madagascar 25.1 .09 Peru 10.7 .04
Poland 3.5 .01 Poland 3.5 .01
Sri Lanka 248.8 .85 Portugal 147.4 .50
2nd quartile 5% Dom. Rep. 20.7 .07 10% Brazil 3.9 .01 Mexico 167.4 .57 El Salvador 7.9 .03 Morocco 10.5 .04 India 1701.4 5.79 Nicaragua 74.5 .25 Kenya 78.3 .27 Philippines 549.0 1.87 Morocco 10.5 .04 Portugal 147.4 .50 Philippines 549.0 1.87 Thailand 594.6 2.02 Thailand 594.6 2.02 Ukraine 13.1 .04 3rd quartile 69% Cambodia 998.7 3.40 4% Colombia 23.2 .08 China 15818.8 53.86 Egypt 91.1 .31 Colombia 23.2 .08 Georgia 9.1 .03 El Salvador 7.9 .03 Guatemala 446.0 1.52 Georgia 9.1 .03 Jordan 267.9 .91 India 1701.4 5.79 Macedonia 10.4 .04 Indonesia 1458.7 4.97 Madagascar 25.1 .09 Macedonia 10.4 .04 Mexico 167.4 .57
Malaysia 283.8 .97 Sri Lanka 248.8 .85
Tunisia 9.1 .03 Tunisia 9.1 .03 Ukraine 13.1 .04 Bottom quartile 22% Bangladesh 2013.0 6.85 78% Bangladesh 2013.0 6.85 Egypt 91.1 .31 Cambodia 998.7 3.40 Guatemala 446.0 1.52 China 15818.8 53.86
Jordan 267.9 .91 Hong Kong 11.3 .04
Kenya 78.3 .27 Malaysia 283.8 .97
Pakistan 188.0 .64 Nicaragua 74.5 .25
Peru 10.7 .04 Pakistan 188.0 .64
Turkey 955.2 3.25 Turkey 955.2 3.25
Vietnam 2545.5 8.67 Vietnam 2545.5 8.67
Notes. Share of export transactions originating from each country, sorted by level of respect for labor rights and freedom of association in sourcing agent database, 2009-2012. Ratings of labor rights and freedom of association from the World Justice Project, 2012-2013. Percent-ages sum to less than unity because thirteen countries present in the sourcing dataset are omitted from the World Justice Project: Bahrain, Haiti, Honduras, Laos, Lesotho, Lithuania, Macau, Mauritius, Oman, Slovakia, Swaziland, Taiwan, and Turkmenistan. Countries with less than 1m USD total export value also excluded from this table.
Table A3: Cross-sectional analysis of order value and compliance (2012)
(1) (2)
DV Logged order value Order value
(thousand USD) (thousand USD)
Compliance .612 926 (.069) (202) Factory location China .129 -21 (.154) (471) India -.570 -1,965 (.172) (485) Bangladesh -.094 -2,108 (.198) (583) Indonesia .017 -823 (.197) (623) Vietnam .426 910 (.193) (693) Thailand -.289 -692 (.222) (626) Turkey -.036 -570 (.255) (655) Philippines -.067 541 (.280) (746) Taiwan -.839 -1,025 (.268) (584) Cambodia .467 936 (.345) (1,169) Pakistan -.390 -2,212 (.347) (804) Factory products Clothing 1.715 2,771 (.090) (202)
Furniture & home decor .365 282
(.086) (172) Toys .195 -649 (.092) (186) Cookware .115 -85 (.098) (162) Other products .156 -92 (.107) (201)
Factory size and performance
Employees .000 1.543 (.000) (.205) On-time delivery .192 971 (.117) (212) Quality inspection .886 2,071 (.188) (336) Constant 4.124 -1,815 (.246) (572) Observations 4,309 4,309 R-squared .215 .208
Table A4: Main results: robustness with additional controls (1) (2) (3) (4) (5) (6) Compliance .138 .134 .131 (binary) (.047) (.046) (.046) Compliance .087 .086 .084 (A-D) (.034) (.033) (.033)
Flexible performance controls
On-time delivery 4.408 4.405 4.474 4.470 4.431 4.427 (.346) (.346) (.351) (.351) (.349) (.349) (squared) -3.879 -3.877 -3.925 -3.923 -3.888 -3.887 (.285) (.285) (.288) (.288) (.286) (.286) Quality inspection 4.822 4.816 4.891 4.883 4.866 4.859 (.742) (.746) (.741) (.744) (.741) (.744) (squared) -3.317 -3.314 -3.381 -3.377 -3.362 -3.358 (.522) (.524) (.522) (.524) (.521) (.523) Industry time-trends Clothing trend .089 .089 .099 .098 (.052) (.052) (.051) (.051) Furniture trend .027 .028 .032 .033 (.049) (.049) (.049) (.049) Toys trend .149 .151 .159 .161 (.049) (.049) (.050) (.050) Cookware trend .098 .096 .105 .103 (.050) (.050) (.050) (.050)
Other prod. trend -.371 -.372 -.377 -.378
(.114) (.114) (.114) (.114) Length of sourcing relationship to factory
Years -.073 -.073
(.057) (.057)
(squared) -.007 -.007
(.004) (.004)
Year fixed effects X X X X X X
Factory fixed effects X X X X X X
Constant 4.172 4.095 4.108 4.030 4.338 4.263
(.271) (.277) (.272) (.277) (.287) (.292)
Observations 6,915 6,915 6,915 6,915 6,913 6,913
R-squared .049 .049 .062 .061 .063 .062
Factories 2,447 2,447 2,447 2,447 2,446 2,446
Notes. Replicating main effects of compliance on order value (logged USD, thousands) reported in Table 2 adding controls for non-linear relationship between performance metrics and purchasing, industry-specific trends in purchasing, and the length of the business relationship between factory and sourcing agent. Standard errors clustered by factory in parentheses.