HAL Id: hal-01350722
https://hal.inria.fr/hal-01350722
Submitted on 1 Aug 2016
HAL is a multi-disciplinary open access
archive for the deposit and dissemination of
sci-entific research documents, whether they are
pub-lished or not. The documents may come from
teaching and research institutions in France or
abroad, or from public or private research centers.
L’archive ouverte pluridisciplinaire HAL, est
destinée au dépôt et à la diffusion de documents
scientifiques de niveau recherche, publiés ou non,
émanant des établissements d’enseignement et de
recherche français ou étrangers, des laboratoires
publics ou privés.
Exploratory Visualization of Astronomical Data on
Ultra-high-resolution Wall Displays
Emmanuel Pietriga, Fernando del Campo, Amanda Ibsen, Romain Primet,
Caroline Appert, Olivier Chapuis, Maren Hempel, Roberto Muñoz, Susana
Eyheramendy, Andres Jordan, et al.
To cite this version:
Emmanuel Pietriga, Fernando del Campo, Amanda Ibsen, Romain Primet, Caroline Appert, et
al.. Exploratory Visualization of Astronomical Data on Ultra-high-resolution Wall Displays.
As-tronomical Telescopes and Instrumentation, SPIE, Jun 2016, Edinburgh, United Kingdom. pp.15,
�10.1117/12.2231191�. �hal-01350722�
Exploratory Visualization of Astronomical Data on
Ultra-high-resolution Wall Displays
Emmanuel Pietriga
a,b,c, Fernando del Campo
b, Amanda Ibsen
b, Romain Primet
a,
Caroline Appert
a,c, Olivier Chapuis
a,c, Maren Hempel
d, Roberto Muñoz
d,
Susana Eyheramendy
e,f, Andres Jordan
d,f, and Hervé Dole
g aINRIA, Orsay, France
b
INRIA Chile, Santiago, Chile
c
CNRS & Université Paris-Sud (Laboratoire de Recherche en Informatique), Orsay, France
dPontificia Universidad Católica de Chile (Instituto de Astrofísica), Santiago, Chile
ePontificia Universidad Católica de Chile (Departmento de Estadística), Santiago, Chile
f
Millennium Institute of Astrophysics, Santiago, Chile
g
Université Paris-Sud & CNRS (Institut d’Astrophysique Spatiale), Orsay, France
ABSTRACT
Ultra-high-resolution wall displays feature a very high pixel density over a large physical surface, which makes them well-suited to the collaborative, exploratory visualization of large datasets. We introduce FITS-OW, an application designed for such wall displays, that enables astronomers to navigate in large collections of FITS images, query astronomical databases, and display detailed, complementary data and documents about multiple sources simultaneously. We describe how astronomers interact with their data using both the wall’s touch-sensitive surface and handheld devices. We also report on the technical challenges we addressed in terms of distributed graphics rendering and data sharing over the computer clusters that drive wall displays.
Keywords: Ultra-walls, Visualization, FITS Images, Large Datasets, Astronomical Database Queries
1. INTRODUCTION
Ultra-high-resolution wall-sized displays, also called ultra-walls1for short, feature a very high pixel density over
a large physical surface. For instance, WILD, the first wall display we set up in our laboratory, has a total resolution of 20480 × 6400 = 131 megapixels for a surface area of 5.5m × 1.8m. Other, even larger, platforms include Stallion2(328 megapixels) and the Reality Deck3 (1,500 megapixels in an immersive configuration).
Ultra-walls have properties that make them well-suited to the visualization of very large datasets. They can represent the data with a high level of detail while at the same time retaining context: users can transition from an overview of the data to a detailed view simply by physically moving4 in front of the display. Wall displays
also offer good support for collaborative work, enabling multiple users to simultaneously visualize and interact with the displayed data.5–7 In this paper, we introduce FITS-OW, an application that enables astronomers to visualize and interact with very large FITS images and collections thereof. They can pan and zoom in images that are several hundred thousand pixels in both width and height, overlay the results of data analyses, fetch and display additional images of a specific object or region in the sky, showing observations in different ranges of the electromagnetic spectrum or made at different times. Additionally, FITS-OW lets astronomers query databases such as SIMBAD8 servers, and visualize the results of such queries in-place, right next to the
corresponding source in the image. The very high pixel density of wall displays means that detailed information can be shown for multiple sources simultaneously, including multiple measurements as well as research articles retrieved dynamically through links found in relevant databases.
Further author information:
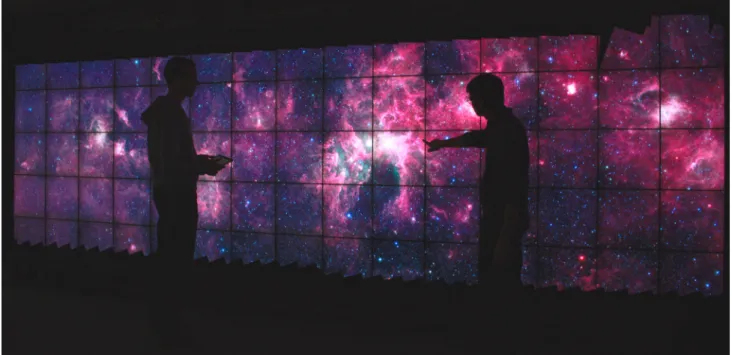
Figure 1. Zooming in GLIMPSE360, Spitzer’s Infrared Milky Way image (540,000 × 15,000 pixels), on WILDER, a touch-sensitive ultra-wall at Inria Saclay, France, that features a resolution of 14,400 × 4,800 pixels.
We explain how we enable astronomers to perform these operations using interaction techniques that were designed specifically for wall displays, using direct manipulation and gestures performed on the wall’s surface or on handheld tablets: adjusting the scale and color mapping used to render the raw, high-dynamic-range FITS data; overlaying and manually compositing multiple bands; measuring the brightness and colors of astronomical sources, displaying their light curve; making queries and adjusting object filters. We also explain how we addressed related technical challenges. Indeed, ultra-walls are often driven by clusters of computers (the above-mentioned WILD platform uses 32+1 graphics processing units in 16+1 computers) and involve heterogeneous input devices, which causes problems of data sharing, graphics rendering, and handling multiple user input channels. We describe FITS-OW’s architecture and our solution to the specific challenges that this application raised: the generation of FITS tile pyramids and their multi-scale rendering; the computation of sky coordinates; queries to sky catalogs; the dynamic adjustment of scale, color mapping and graphics compositing settings, and the framework for managing user interaction with various input sources.
2. BACKGROUND AND MOTIVATION
Multiple studies in the field of Human-Computer Interaction have been evaluating the potential benefits of very-high-resolution displays for visualizing very large datasets and very large imagery. One of the most recent examples to date is Ruddle et al.’s work9 on the design and evaluation of high-end workstations for visualizing
gigapixel images in the field of medical pathology. The display capacity of such dual-screen workstations remains necessarily limited, however, and researchers have also been investigating other types of interactive surfaces that feature a much higher display capacity: ultra-walls. Ultra-walls1are tiled displays, typically built by juxtaposing
LCD or LED monitors, that feature a pixel density of 60-to-100 pixels per inch over a large physical surface, 14-to-20 feet in width and about 6 feet in height (Figure1).
Early work on ultra-walls has mainly focused on the technical aspects of how to make such platforms:10 how
to display complex graphics, how to stream data across the nodes of the computer clusters that drive them. Now that the technical feasibility of such platforms has been established, researchers are now investigating other questions: evaluating the actual benefits of ultra-walls;11–13studying co-located users’ collaboration strategies,6,7
or users’ perception of visual variables based on their relative position in front of the display;14 designing
frames, motion-tracking systems and wireless multitouch devices, in order to enable device and multi-user interaction with the displayed data. Examples of such techniques include high-precision remote pointing techniques to enable users to interact when they are not within arm’s reach of the display,1or mid-air panning and zooming techniques for navigating maps, images and datasets that exceed the display capacity of ultra-walls.15 For instance, Figure1 shows a small portion of GLIMPSE360, Spitzer’s Infrared Milky Way image.16
Even with the ultra-wall’s display capacity, the viewport can still only accommodate 0.85% of the full image at maximum magnification, calling for multi-scale navigation techniques17to enable users to efficiently navigate in
the data.
Application areas for ultra-walls are quite varied, ranging from the monitoring of complex infrastructures18 and crisis management situations19,20to tools for exploratory data visualization,21visual analytics,22,23medicine24
and other scientific disciplines.5 In each of these application areas, subject-matter experts are faced with one
common problem: the need to visualize and make sense of large amounts of data. The data can be fairly homo-geneous but quite large, or they can be collections of more heterohomo-geneous elements that need to be investigated together to perform analysis and sensemaking tasks.
Astronomers are actually faced with both cases: on one hand, they have to deal with the increasingly large observation datasets produced by modern instruments; and on the other hand, they often have to look at multiple, heterogeneous-but-complementary data simultaneously, including images of the same source observed at different wavelengths or taken during different observing campaigns (time domain astronomy), research articles, statistics and charts such as, e.g., light curves. A recent study by Meade et al.25 hints at the usefulness of ultra-walls for
astronomers. A precursor to our work, the WeSpace26 project provided astronomers with a shared workspace to
conduct co-located collaborative work sessions. It consisted of a multi-touch table and a projected wall display, enabling several users to share their image data. While the astronomers already found WeSpace valuable to support their workflow, its wall display actually had a fairly limited display capacity (3072 × 1536 pixels) compared to the wall displays considered here. We believe that thanks to their much higher pixel density, ultra-walls can provide even more support for various tasks in an astronomer’s workflow, including sharing and analyzing data collaboratively during group meetings, or getting an overview of results produced by data mining algorithms. We also believe that ultra-walls can be valuable tools for other activities such as education and outreach, as further discussed in Section5. The following section gives an overview of FITS-OW’s main features, describing how users can interact with the data displayed on the wall.
3. FITS-OW OVERVIEW
FITS-OW, which stands for FITS images On Walls, is an application that enables visualizing FITS images,27 and other data about the sources in those images, on ultra-walls driven by clusters of computers. Figure2shows the application running on the WILDER ultra-wall. It is based on earlier work by our group that explored the technical feasibility of displaying large FITS images by slicing and sharing them over the nodes of a computer cluster.5 At the time of writing, some features are still in the process of being transferred from this earlier
project∗to the FITS-OW codebase.†
3.1 Features
FITS-OW can load two main types of FITS images. First, users can display multiple regular 2D FITS images, either accessed through the network or stored locally. M31 (Figure 2-a) and the three images of the Eagle nebula (Figure 2-b) are instances of images of this type. Second, users can also load very large FITS images (up to several hundred thousand pixels in both width and height) that have been pre-processed by FITS-OW to generate the equivalent of mipmaps28 (tiled pyramids) for FITS images. Further information about how these
multi-scale FITS images are generated is given in Section4. The background image in Figure 2-c is an instance of such a very large, pre-processed multi-scale FITS image.
Multi-scale FITS images often far exceed ultra-walls’ display capacity and thus span the entire display surface, even at low magnification. Several such background images can be loaded simultaneously, but in most cases,
∗
https://sourceforge.net/p/zvtm/code/HEAD/tree/zuist-cluster-fits/
†
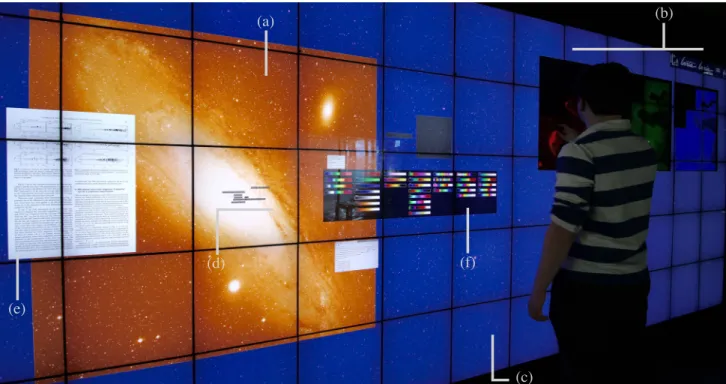
(a) (b)
(c) (d)
(e)
(f)
Figure 2. FITS-OW running on the WILDER platform, showing: multiple FITS images, (a) M31 on the left side, (b) three juxtaposed images that show observations of the Eagle nebula at different wavelengths, and (c) a much larger FITS image (86,499 × 13,474 pixels) used as a zoomable background over the entire wall; (d) the result-set of a SIMBAD query restricted to observations about galaxies; (e) basic measurements for galaxy M31; (e) a page of a research paper (PDF) discussing that particular galaxy; (f) the color map selector.
these images will correspond to the same on-sky region with different filters or at different points in time‡. Such sets of multi-scale, spatially-aligned FITS images will be superimposed on different layers whose visibility and opacity can be interactively adjusted. Regular FITS images are displayed on top of these larger background images, and can be freely moved and resized. They do not necessarily have to correspond to a subregion of the background multi-scale images.
For each individual image, either regular or multi-scale, astronomers thus have access to the whole dynamic range and can look for sources at the very limits of the noise-dominated regime. They can select an appropriate color lookup table using the color map selector (Figures2-f and3-a) and an appropriate scaling function (linear, square root, log, histogram equalization) as in FITS image viewers such as, e.g., SAOImage DS9.30 A histogram widget lets them specify the corresponding domain using a range slider. If those parameters are adjusted for a regular FITS image, the changes are applied dynamically to the image, as soon as a new color table or scaling function is selected. If they are adjusted for a multi-scale image, FITS-OW shows the resulting rendering in two preview windows only (Figure 3-b,c): one corresponds to a thumbnail view of the entire image, the other to a 1:1 close-up on a region of the image. The changes are applied to the entire image only after confirmation by the user. The purpose of this preview feature is to keep the interface responsive, as applying a new scaling function or color lookup table to a large multi-scale FITS image cannot be achieved at interactive frame rates.
Individual FITS images can be moved and resized freely. The multi-scale background FITS image, whose dimensions often exceed the wall’s display capacity, can also be panned and zoomed at will. Users can also instantiate DragMags,31 that provide magnified, more detailed views on user-selected regions of the multi-scale
FITS image. As illustrated in Figure4, multiple dragmags can coexist, enabling users to view multiple sources featured in the background image (whose field of view will typically be relatively large) at the same time. Figure5
‡
For example, one image we refer to in Section4comes from the VISTA Variable in the Via Lactea survey29 (VVV). The 6-year-long survey has collected 80 TB of reduced data, covering a 560 deg2field on the sky in 5 optical/near-infrared
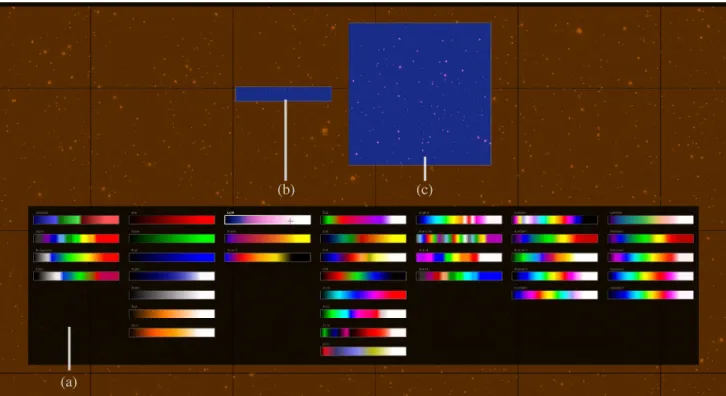
(a)
(b) (c)
Figure 3. Color lookup table selector (a) with previews of the new selection applied to a thumbnail of the entire multi-scale FITS image (b) and to a 1:1 close-up on a region of the image (c).
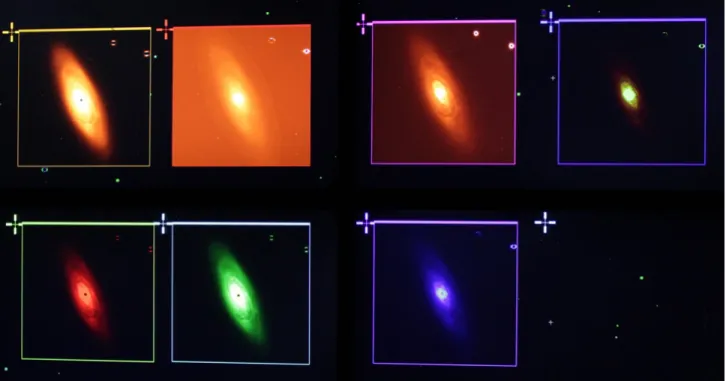
illustrates a complementary scenario, where a source is rendered with different color lookup tables and scaling functions.
Images of the same region of the sky corresponding to observations at different wavelengths can be freely juxtaposed or superimposed. When superimposed, the opacity of those images can be adjusted, enabling users to perform manual composites. A typical scenario would be to take FITS images of the same source observed at different wavelengths, assign them different color lookup tables such as the red, green and blue color ramps, overlay them and adjust their opacity interactively. As mentioned earlier, this can also be achieved on the different layers of the multi-scale background FITS image.
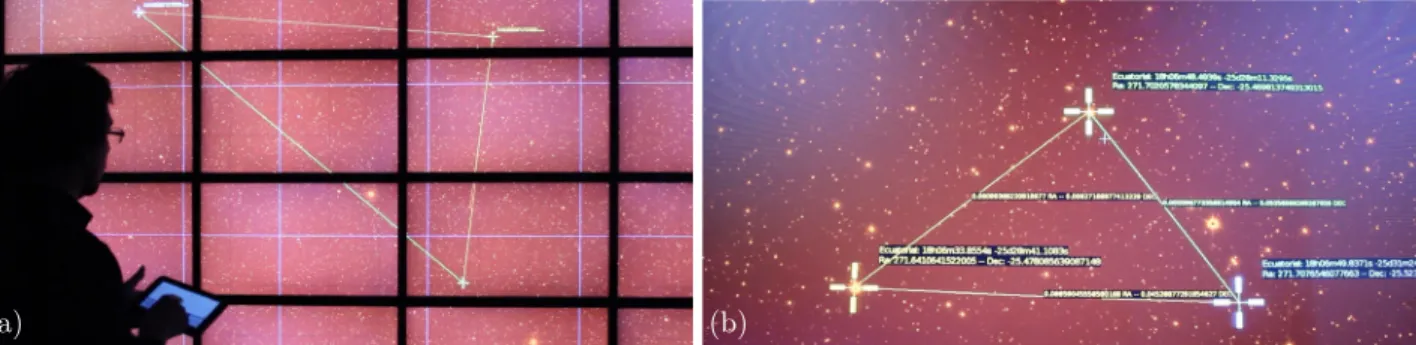
Users can instantiate multiple cursors that can be moved seamlessly across the display surface. Those cursors can be controlled by touching the display, or remotely, using a handheld device such as a tablet (Figure 6-a). Each individual user can control one or more cursors. The displayed coordinates are obtained using Astropy’s32
WCS module to manage FITS image to World Coordinate System (WCS) transformations.
Astropy’s WCS module is also used to convert user selections in an image into RA-Dec coordinates when querying astronomical catalogs. So far, we have only implemented support for SIMBAD queries. However, it should be relatively straightforward to add support for queries to other databases. As Figures7and8illustrate, users can select a region in any of the FITS images displayed and perform queries, specifying filters on the object type and other parameters, and specifying which measurements they are interested in. In addition to superimposing sources from the result-set on top of the FITS image on which the query was made, FITS-OW also displays a sorted list of all items in that result-set. Selecting a source updates the info card, which gives detailed information about it, including the type of object, and measurements such as distance or radial velocity. An additional feature related to SIMBAD queries we are currently working on is the possibility for users to display the research articles relevant to some particular source directly on the wall. The underlying UI toolkit already enables us to display PDF documents on ultra-walls by seamlessly sharing them dynamically with the cluster’s nodes (Figure2-e), and queries to SIMBAD can be configured to return URLs to research papers related to a given source. We are now working on an interface to enable users to select relevant papers to display, and
Figure 4. Multiple DragMags magnifying different sources of interest from the same multi-scale FITS image on the ANDES ultra-wall (11,520 × 4,320 pixels) set up at Inria Chile in Santiago.
(a) (b)
Figure 6. (a) Remote control of cursors using a handheld device. (b) Distance measurements using multiple cursors.
Figure 7. SIMBAD Query Interface.
Figure 8. Results of a SIMBAD query superimposed on the corresponding FITS image, along with a sorted list of all items in the result-set. Selecting an element in this list updates the detailed info in the lower right window and highlights the source in the image. All windows can be freely repositioned on the wall.
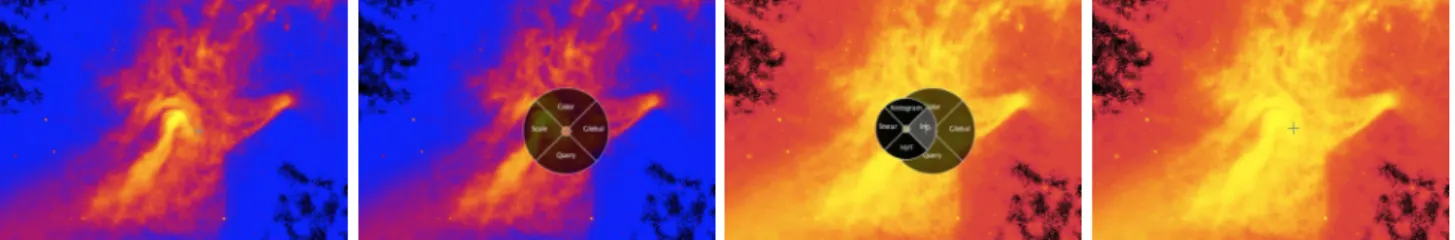
Figure 9. The contextual pie menu can be invoked on any image. After invoking the menu, the user selects the Scale item by moving leftward, which pops-up a submenu with four options corresponding to the available scaling functions. She then moves rightward, continuing the same gesture, selecting the log scaling function, which is immediately previewed. Releasing the fingers from the surface while inside this menu item confirms the selection of this new scaling function.
the underlying mechanism to automatically retrieve the PDF document from the URL provided by SIMBAD, which is usually an HTML page about the article in a digital library rather than a direct link to the PDF itself.
3.2 Interaction
While many of the features described above can be found in FITS image viewers such as DS930 or JSky,33 the
latter have been developed to run on desktop workstations. All features are designed to be accessible through conventional input devices such as keyboard and mouse. But as discussed earlier in Section2, these input devices are not adapted to interact with wall-sized displays. In order to promote physical navigation and to effectively enable collaborative work in front of ultra-walls,5we started working on interaction techniques that better enable users to navigate in the data, adjust rendering parameters, and perform queries.
The two main types of input considered are handheld devices such as tablets, which enable users to interact with the display from any location, and direct touch on the wall (when available), which requires users to be within arm’s reach of the display. Interaction is based on a combination of widgets such as pie menus, lists and buttons, multi-touch gestures, and text input.
As mentioned earlier, users can control multiple cursors remotely using tablets or smartphones. Those cursors can be used to obtain the sky coordinates of a particular image pixel, to make measurements, to bound queries to particular regions, and to adjust parameters such as the chosen color table. Multiple users can interact simultaneously, each controlling one or more cursors with their own handheld device.34 They also have the
possibility to take control of other users’ cursors.
A contextual hierarchical pie menu35 provides access to some of the main features (Figure9): initiating a
query to SIMBAD, getting a global view of the workspace, changing an image’s scaling function, its color lookup table. This menu can be invoked from the tablets, or by touching the wall with four or more fingers. Text input is only supported from handheld devices for now.
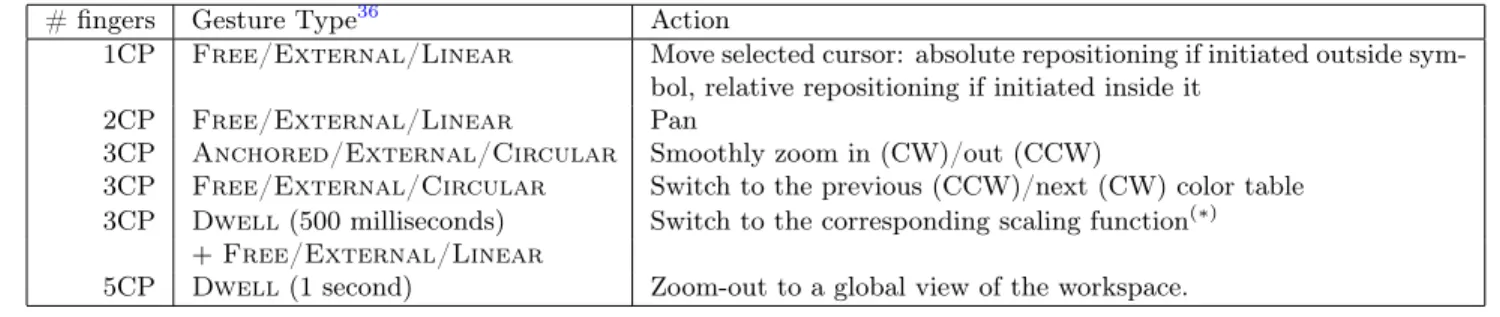
Multi-touch gestures complement the above interactions. The usual flick and pinch gestures used to pan and zoom can be performed on the wall. In addition, a set of gestures drawn from Olafsdottir & Appert’s design space for multi-touch gestures for discrete and continuous control36 are mapped to commands as described in
Figure10, enabling eyes-free interaction from a distance on the tablets.
4. IMPLEMENTATION
FITS-OW is implemented mainly in Java using zvtm-cluster,37a module of our zvtm toolkit38,39(which was also
used to develop several of ALMA’s operations monitoring and control interactive visualizations40). zvtm-cluster
uses aspect-oriented programming (AspectJ41) to enable zvtm-based applications to run almost unmodified on
cluster-driven wall displays10 as the one depicted in Figure11, taking care of sharing the scene graph across all
cluster nodes driving the display tiles. FITS-OW runs on the master computer (MSTR), with generic zvtm-cluster
SlaveAppclients running on the display nodes. Those generic clients can render any zvtm graphics primitives, loading the corresponding external resources (such as FITS image tiles or PDF document pages) when necessary. The configuration of zvtm-cluster is flexible, enabling applications such as FITS-OW to run on different hardware setups. Figure11illustrates one such configuration, where each cluster node (Dell workstations running
# fingers Gesture Type36 Action
1CP Free/External/Linear Move selected cursor: absolute repositioning if initiated outside sym-bol, relative repositioning if initiated inside it
2CP Free/External/Linear Pan
3CP Anchored/External/Circular Smoothly zoom in (CW)/out (CCW)
3CP Free/External/Circular Switch to the previous (CCW)/next (CW) color table 3CP Dwell (500 milliseconds) Switch to the corresponding scaling function(∗)
+ Free/External/Linear
5CP Dwell (1 second) Zoom-out to a global view of the workspace. CP = Contact Point
(∗)
The four directions are mapped to the scaling functions according to their position in the Scale pie menu (Figure9). 1CP/Free/ 2CP/Free/ 3CP/Anchored/ 3CP/Free/ 3CP/Free/ External/Linear External/Linear External/Circular External/Circular External/Linear
Figure 10. Mapping of tablet multi-touch gestures to commands in FITS-OW.
A1L
A1R
A2L
A2R
A3L
A3R
A4L
A4R
B1L
B1R
B2L
B2R
B3L
B3R
B4L
B4R
C1L
C1R
C2L
C2R
C3L
C3R
C4L
C4R
A1
A2
A3
A4
B1
B2
B3
B4
C1
C2
C3
C4
= 2 x NVIDIA Quadro 2000A1L
A1L
A1R
A1R
A2L
A2L
A2R
A2R
A3L
A3L
A3R
A3R
A4L
A4L
A4R
A4R
B1L
B1R
B2L
B2R
B3L
B3R
B4L
B4R
C1L
C1R
C2L
C2R
C3L
C3R
C4L
C4R
DVI-A1L DVI-A1R12 x Dell R5500, Dual Xeon E5606, 12GB RAM, 256GB SSD + 512GB HDD@7200RPM
DVI-A1L DVI-A1R
MSTR
Dell R5500, Dual Xeon E5606, 12GB RAM, 256GB SSD + 512GB HDD@7200RPM
GbE switch
DVI fiber optics cables
Gb Eth Gb Eth
DVI or DP
Linux Fedora) drives two display tiles, with two graphics cards per node (one for each tile). In this case, we typically choose to run two instances of SlaveApp, one per tile. A similar configuration is used on WILD (20,480 × 6,400 pixels), that depends on a cluster of 16 Mac Pro computers to drive 32 tiles 30" in diagonal. The configuration used on WILDER (Figures1and2) is different: in this case, a cluster of 10 computers drives 15 × 5 = 75 square tiles (960 × 960 pixels each). Those tiles are grouped in 2 columns, 8 and 7 tiles in width respectively. Each cluster node (running Linux Ubuntu) drives one row of one of these columns, the Xorg server being configured so that the 7 or 8 tiles are seen as one single display workspace. TheSlaveApp configuration that yields the best frame rates in this case consists of 2 instances per node, that each handle half of the node’s logical display, whose dimensions are 7680 × 960 pixels.
As mentioned in Section3.1, very large FITS images (up to 105 by 105 pixels) need to be pre-processed in
order to generate multi-scale representations of them. These representations are basically mipmap28 versions of
the original FITS images, consisting of square FITS tiles stored as individual files and arranged into a quadtree described in an XML hierarchy. The tiles themselves are still FITS files, and not pre-rendered JPEG or PNG images, as users need to be able to change the scaling function or color lookup table. The XML file describes the quadtree, and also holds the original image’s min and max values. Indeed, this information is required to render the tiles across the cluster in a homogeneous manner, applying the scaling function to all tiles with the same parameters. Otherwise, the scaling function would be applied to individual tiles locally, based on each tile’s own histogram, resulting in a very inhomogeneous rendering. This FITS pre-processor is implemented as a Python script that uses Astropy.32
Computing mipmaps for these very large FITS images enables a more efficient sharing and rendering of the data on the cluster’s individual nodes: eachSlaveAppnode has a synchronized copy of the multi-scale images’ quadtree, and only loads the tiles that intersect the current viewport (position and level of detail), thus limiting memory consumption and only rendering tiles on the nodes by which they are actually displayed. The largest FITS pyramid we tested so far is a 3-filter image that corresponds to a small part of the VVV survey.29 The
three images, 86,499 × 13,474 pixels each, are put on superimposed layers. We also tested JPEG pyramids up to 540,000 × 15,000 pixels (GLIMPSE36016), which gives an indication that FITS-OW can support multi-scale
FITS images several tens of gigapixels in size, given that FITS tile rendering performance is similar to that of JPEG tiles thanks to the pre-rendering strategy described next.
The parsing and initial rendering of FITS images in Java is handled by JSky33 v3.0. JSkyFITSImageobjects
are then wrapped in aGlyphcompatible with zvtm’s graphical object model,38which draws a pre-rendered AWT
BufferedImageversion of the FITS image based on the current scaling function and color table settings in order to speed-up rendering. A similar mechanism is implemented for wrapping PDF document pages, which are also pre-rendered using ICEpdf42 at an appropriate level of detail and also stored in a BufferedImage. External resources such as FITS images and PDF documents can be served to the cluster’s nodes in two ways. The first solution consists in copying the data on all cluster nodes and havingSlaveAppinstances access them locally. The second solution consists in serving them from a separate computer, which can be the one running FITS-OW (MSTRin Figure 11) or a dedicated server. The first solution works best for large but relatively static resources such as multi-scale FITS images (which typically amount to several gigabytes). On the ANDES and WILDER platforms, we store them on the individual nodes’ solid state drive (SSD) to minimize access times. The second solution is less efficient but much more flexible, enabling the dynamic sharing of resources in a more transparent manner from the user’s perspective. The latter is thus best suited to the sharing of FITS images and PDF documents retrieved dynamically from the Internet through, e.g., SIMBAD or Aladin during a work session. In this case, FITS-OW downloads these resources, caches them, and serves them to the cluster nodes through a dedicated HTTP server running locally.
As mentioned in Section3.1, transformations between image pixels and sky coordinates (RA-Dec) are handled via Astropy.32 We originally used JSky’s utilities, but eventually realized that JSky may return incorrect results (this was confirmed by comparing the results returned by DS9, Astropy, and JSky). We then decided to use Astropy, which is already part of our framework. This adds some complexity, however, as Astropy depends on numpy, which only runs with cpython§. A first prototype used RabbitMQ to exchange messages between
§cpython is the default implementation of the Python programming language, implemented in C. Jython is an
the Java and Python processes. We then decided to instantiate a cpython interpreter from the JVM running FITS-OW, which is made possible by JEP43 (Java Embedded Python). Queries to astronomical databases use this coordinate conversion utility to generate the queries based on the user’s selections in the FITS images on one hand, and to superimpose the sources from the result-set on the FITS images. For now, as discussed earlier, only SIMBAD queries are supported. The query strings/scripts are generated dynamically based on the parameters (selected filters and measurements) set by the user through the user interface (Figure7), and sent as HTTP requests to the SIMBAD server.
Finally, regarding user input management, FITS-OW depends essentially on two libraries. Smarties34 en-ables the rapid prototyping of interfaces for handheld devices such as tablets and smartphones, facilitating the development of collaborative interfaces for ultra-walls. We use the Java+Android implementation of Smarties, and couple it with the ILDAGestureManager (developed as an internal project for now). The latter allows to recognize gestures by analyzing input data streams coming from heterogeneous input devices (e.g., tactile screens, trackpads, motion tracking systems). The library enables the incremental recognition of elaborate gestures such as those defined in Olafsdottir & Appert’s design space.36
5. DISCUSSION AND FUTURE WORK
As present, FITS-OW is a proof of concept project and lacks many of the features that would make it a suitable research tool for astronomers. But rather than trying to replicate all the features present in mature software such as DS9, our goal is to investigate the potential benefits and limitations of ultra-walls using real-world usage scenarios, considering specific application areas such as, in this case, astronomy. FITS-OW is part of a larger research effort5 to go beyond the design and evaluation of interaction and visualization techniques considered
in isolation. We want to take a more holistic approach, investigating how these techniques can be integrated, from both the interaction design and software engineering perspectives, to create actual interactive systems that support subject-matter experts in their large-data analysis tasks.
Astronomy has been one of our privileged application areas since we started researching ultra-walls in 2009. Astronomy is a very good candidate for our purposes, because the data that astronomers have to handle as part of their workflow are both very large, varied, and distributed. Of course, astronomers are not simply looking at images to perform their analyses. Given how large datasets have become (e.g., all-sky surveys such as GLIMPSE, 2MASS, SDSS or wide-field surveys such as VVV and DES), they now rather rely on algorithms, including data mining techniques, to identify relevant sources and phenomenons. But although data analyses can be partially automatized using sophisticated software, data exploration and quality assessment still relies on the interactive visualization of images and other data on screen, a task that astronomers perform on their own computer. As observed by Meade et al.: “As valuable as automatic analyses of these enormous datasets are, astronomy still relies heavily on visual inspection”.25
We believe that ultra-walls can be especially interesting for such tasks, especially those that involve astro-nomical surveys, as ultra-walls make it possible to visualize a significantly larger field of view at the same level of detail than a desktop workstation. For instance, the results of data mining algorithms can be visualized on the wall, which will make visual inspection (finding the most promising sources, removing false positives, etc.) more efficient, both because as discussed earlier in Section2 it will promote physical navigation,4 and because it will enable users to display multiple complementary data in situ, that will help make decisions.
The design choice that consists in treating very large FITS images as zoomable backgrounds was made with astronomical surveys in mind. Again, such images are not aimed at being displayed alone for free-form, purely visual, exploration. Still, displaying them as background images gives a frame of reference on top of which additional information can be displayed, much like a base map does in geographical information systems.44 The information displayed on top of these background images can be anything relevant, including, as detailed earlier: portals showing a magnified view of a given region or source in the background image (Figure4), other portals showing the same source observed at different points in time or at different wavelengths, using different scaling functions and color maps (Figure5), pages of research articles referencing a given source featured in the images (Figure2), data coming from catalogs such as measurements and statistics: distance, flux, charts showing, e.g., spectra, or light curves for variable stars. As catalog cross-matching algorithms45 make it increasingly easy to
find data about a given source, the capacity of ultra-walls to display many such data without having to constantly manipulate windows to reveal hidden pieces of information – as typically happens on desktop workstations – should prove valuable to astronomers.
A background image is not limited to a single layer at a time. As discussed in Section3.1, multiple (spatially-aligned) images can be superimposed and composited. Individual layers can correspond to different filters from the same survey, or they can come from different surveys. For instance, the VVV survey29 consists of a multi-wavelength and multi-epoch imaging of the sky, giving astronomers access to more than a hundred different images of the same object. One of its goals is to discover stars that change their intrinsic brightness within days. The large FITS image mentioned earlier in Section4comes from this survey and actually corresponds to only a fraction of it. That specific image, centered on Baade’s Window – a region in the Milky Way bulge with reduced dust extinction – could be combined with, e.g., OGLE,46an optical survey also studying variable stars, that also
covers this region of the sky.
Meade et al. further observe that “[some] phenomena are not even predicted, making automatic analysis meaningless. It is often a case of not knowing what you are looking for until you see it”,25 which resonates with the famous description of Data Visualization as “a way to answer questions you didn’t know you had”.47 Beyond such serendipitous forms of discovery, ultra-walls can also be useful for classification tasks,11which can also be performed collaboratively.6,7 Better support for collaborative work was actually identified by Wigdor
et al.26 as something that would be highly valuable in some of the typical workflows of astronomers, including
data analysis as well as the preparation of observation proposals. Their WeSpace platform, designed to facilitate face-to-face collaborative research sessions (which were not normally part of the astronomers’ workflows), was informed by interviews and observations of astronomer group meetings, who expressed a “desire for synchronous co-located collaboration at various phases of their process”.26 Ultra-wall rooms provide similar environments,
with the added benefit that the wall display features a much higher pixel density, enabling astronomers to share and render even more data and documents. One important feature in that respect, which is not yet supported by FITS-OW but enabled by the underlying UI software toolkits,37 will be to enable users to display instances
of applications running on their laptop on the wall. Such type of sharing, which enables only a relatively crude form of visual comparison and correlation, is still useful because it does not require sharing the actual data with other users, but just a presentation of it. This will usually make the process easier from a technical perspective, and can also be convenient if the data is still under embargo.
Finally, another avenue for future work we plan to investigate is to enable astronomers to perform some simple forms of on-the-fly data analyses directly on the data loaded on the wall. For now, all data displayed on the wall come from local files or from queries to data catalogs, i.e., data that were processed offline, prior to the work session in the ultra-wall room. Many large-scale analyses will only be available this way, especially for surveys, as the computing power and time required to perform them is not compatible with the time frame of the typical collaborative work sessions we envision. However, our integration of Astropy in FITS-OW through JEP, which was originally implemented as a workaround for WCS transformations (Section4), is not limited to the WCS module. It could for instance be used to perform some simple on-the-fly analyses for several sources of interest displayed on the wall, possibly taking advantage of the cluster’s computing and memory power; knowing that this power is sometimes under-utilized on ultra-wall visualization clusters depending on the actual hardware configuration.
Ultra-walls can also be of great benefit for education and outreach activities in astronomy. Here again, the very high display capacity means that a lot of complementary information about sources of interest can be shown to the audience at the same time, instead of being presented sequentially, as in typical slideshows. As both computer and display technologies keep advancing, we can expect ultra-walls to leave the confines of HCI and visualization laboratories to appear in classrooms and public spaces in the maybe-not-so-distant future. In the longer term, ultra-walls could also appear in scientists’ offices, replacing, e.g., a bulkhead. Coupled with their laptop or workstation, they would then enable an even tighter integration of this novel generation of interactive display surfaces in their research workflow.
ACKNOWLEDGMENTS
This work has been partially supported by:• Chile’s Ministry for the Economy, Development, and Tourism’s Programa Iniciativa Científica Milenio through grant IC 120009, awarded to the Millennium Institute of Astrophysics (MAS);
• The Chilean Economic Development Agency (CORFO) and Inria through their support of Inria Chile as an International Center of Excellence in Chile;
• France’s ANR EquipEx DIGISCOPE – Investissements d’avenir ANR-10-EQPX-26-01.
REFERENCES
[1] Nancel, M., Pietriga, E., Chapuis, O., and Beaudouin-Lafon, M., “Mid-air pointing on ultra-walls,” ACM Trans. Comput.-Hum. Interact. 22, 21:1–21:62 (Aug. 2015).
[2] Navrátil, P. A., Westing, B., Johnson, G. P., Athalye, A., Carreno, J., and Rojas, F., [Advances in Visual Computing: 5th International Symposium – Part II ], ch. A Practical Guide to Large Tiled Displays, 970–981, Springer (2009).
[3] Papadopoulos, C., Petkov, K., Kaufman, A. E., and Mueller, K., “The reality deck–an immersive gigapixel display,” IEEE computer graphics and applications 35(1), 33–45 (2015).
[4] Ball, R., North, C., and Bowman, D. A., “Move to improve: Promoting physical navigation to increase user performance with large displays,” in [Proceedings of the SIGCHI Conference on Human Factors in Computing Systems ], CHI ’07, 191–200, ACM (2007).
[5] Beaudouin-Lafon, M., Huot, S., Nancel, M., Mackay, W., Pietriga, E., Primet, R., Wagner, J., Chapuis, O., Pillias, C., Eagan, J. R., Gjerlufsen, T., and Klokmose, C., “Multisurface Interaction in the WILD Room,” IEEE Computer 45(4), 48–56 (2012).
[6] Jakobsen, M. R. and Hornbaek, K., “Up close and personal: Collaborative work on a high-resolution multi-touch wall display,” ACM Trans. Comput.-Hum. Interact. 21, 11:1–11:34 (Feb. 2014).
[7] Liu, C., Chapuis, O., Beaudouin-Lafon, M., and Lecolinet, E., “Shared interaction on a wall-sized display in a data manipulation task,” in [Proceedings of the 2016 CHI Conference on Human Factors in Computing Systems ], CHI ’16, 2075–2086, ACM (2016).
[8] Wenger, M., Ochsenbein, F., Egret, D., Dubois, P., Bonnarel, F., Borde, S., Genova, F., Jasniewicz, G., Laloë, S., Lesteven, S., et al., “The SIMBAD astronomical database - The CDS reference database for astronomical objects,” Astronomy and Astrophysics Supplement Series 143(1), 9–22 (2000). http: //simbad.u-strasbg.fr/simbad/.
[9] Ruddle, R. A., Thomas, R. G., Randell, R., Quirke, P., and Treanor, D., “The design and evaluation of interfaces for navigating gigapixel images in digital pathology,” ACM Trans. Comput.-Hum. Interact. 23, 5:1–5:29 (Jan. 2016).
[10] Chung, H., Andrews, C., and North, C., “A survey of software frameworks for cluster-based large high-resolution displays,” IEEE Transactions on Visualization and Computer Graphics 20, 1158–1177 (August 2014).
[11] Liu, C., Chapuis, O., Beaudouin-Lafon, M., Lecolinet, E., and Mackay, W. E., “Effects of display size and navigation type on a classification task,” in [Proceedings of the 32Nd Annual ACM Conference on Human Factors in Computing Systems ], CHI ’14, 4147–4156, ACM (2014).
[12] Shupp, L., Andrews, C., Dickey-Kurdziolek, M., Yost, B., and North, C., “Shaping the display of the future: The effects of display size and curvature on user performance and insights,” Human Computer Interaction 24, 230–272 (April 2009).
[13] Yost, B., Haciahmetoglu, Y., and North, C., “Beyond visual acuity: The perceptual scalability of information visualizations for large displays,” in [Proceedings of the SIGCHI Conference on Human Factors in Computing Systems ], CHI ’07, 101–110, ACM (2007).
[14] Bezerianos, A. and Isenberg, P., “Perception of visual variables on tiled wall-sized displays for information visualization applications,” IEEE Transactions on Visualization and Computer Graphics 18, 2516–2525 (Dec. 2012).
[15] Nancel, M., Wagner, J., Pietriga, E., Chapuis, O., and Mackay, W., “Mid-air pan-and-zoom on wall-sized displays,” in [Proceedings of the 2011 annual conference on Human factors in computing systems ], CHI ’11, 177–186, ACM (2011).
[16] Whitney, B., Benjamin, R., Meade, M., Babler, B., Watson, C., Churchwell, E., Robitaille, T., Indebe-touw, R., and GLIMPSE360 Team, “Glimpse360: Observing The Outback Of The Galaxy,” in [American Astronomical Society Meeting Abstracts ], Bulletin of the American Astronomical Society 43, 241.16 (Jan. 2011).
[17] Pietriga, E., Appert, C., and Beaudouin-Lafon, M., “Pointing and beyond: An operationalization and pre-liminary evaluation of multi-scale searching,” in [Proceedings of the SIGCHI Conference on Human Factors in Computing Systems ], CHI ’07, 1215–1224, ACM (2007).
[18] Prouzeau, A., Bezerianos, A., and Chapuis, O., “Road traffic monitoring on a wall display,” in [Proceedings of the 27th Conference on L’Interaction Homme-Machine ], IHM ’15, 29:1–29:6, ACM (2015).
[19] Chokshi, A., Seyed, T., Marinho Rodrigues, F., and Maurer, F., “ePlan Multi-Surface: A Multi-Surface Environment for Emergency Response Planning Exercises,” in [Proceedings of the Ninth ACM International Conference on Interactive Tabletops and Surfaces ], ITS ’14, 219–228, ACM (2014).
[20] Onorati, T., Isenberg, P., Bezerianos, A., Pietriga, E., and Diaz, P., “WallTweet: A Knowledge Ecosystem for Supporting Situation Awareness,” in [Workshop on Data Exploration for Interactive Surfaces (DEXIS) at ITS’15 ], (2015).
[21] Tsandilas, T., Bezerianos, A., and Jacob, T., “Sketchsliders: Sketching widgets for visual exploration on wall displays,” in [Proceedings of the SIGCHI Conference on Human Factors in Computing Systems ], CHI ’15, 3255–3264, ACM (2015).
[22] Andrews, C., Endert, A., and North, C., “Space to think: Large high-resolution displays for sensemaking,” in [Proceedings of the SIGCHI Conference on Human Factors in Computing Systems ], CHI ’10, 55–64, ACM (2010).
[23] Yamaoka, S., Manovich, L., Douglass, J., and Kuester, F., “Cultural analytics in large-scale visualization environments,” Computer 44, 39–48 (Dec. 2011).
[24] Goodyer, C., Hodrien, J., Wood, J., Kohl, P., and Brodlie, K., “Using resolution displays for high-resolution cardiac data,” Philosophical Transactions of the Royal Society of London A: Mathematical, Phys-ical and Engineering Sciences 367(1898), 2667–2677 (2009).
[25] Meade, B. F., Fluke, C. J., Manos, S., and Sinnott, R. O., “Are tiled display walls needed for astronomy?,” Publications of the Astronomical Society of Australia 31 (2014).
[26] Wigdor, D., Jiang, H., Forlines, C., Borkin, M., and Shen, C., “WeSpace: The Design Development and Deployment of a Walk-up and Share Multi-surface Visual Collaboration System,” in [Proceedings of the SIGCHI Conference on Human Factors in Computing Systems ], CHI ’09, 1237–1246, ACM (2009). [27] Wells, D. C., Greisen, E. W., and Harten, R. H., “FITS - a Flexible Image Transport System,” Astronomy
and Astrophysics Supplement 44, 363–370 (jun 1981).
[28] Williams, L., “Pyramidal parametrics,” SIGGRAPH Comput. Graph. 17, 1–11 (July 1983).
[29] Minniti, D., Lucas, P., Emerson, J., Saito, R., Hempel, M., Pietrukowicz, P., Ahumada, A., Alonso, M., Alonso-Garcia, J., Arias, J., Bandyopadhyay, R., Barbá, R., Barbuy, B., Bedin, L., Bica, E., Borissova, J., Bronfman, L., Carraro, G., Catelan, M., Clariá, J., Cross, N., de Grijs, R., Dékány, I., Drew, J., Fariña, C., Feinstein, C., Lajús, E. F., Gamen, R., Geisler, D., Gieren, W., Goldman, B., Gonzalez, O., Gunthardt, G., Gurovich, S., Hambly, N., Irwin, M., Ivanov, V., Jordán, A., Kerins, E., Kinemuchi, K., Kurtev, R., López-Corredoira, M., Maccarone, T., Masetti, N., Merlo, D., Messineo, M., Mirabel, I., Monaco, L., Morelli, L., Padilla, N., Palma, T., Parisi, M., Pignata, G., Rejkuba, M., Roman-Lopes, A., Sale, S., Schreiber, M., Schröder, A., Smith, M., Jr., L. S., Soto, M., Tamura, M., Tappert, C., Thompson, M., Toledo, I., Zoccali, M., and Pietrzynski, G., “VISTA Variables in the Via Lactea (VVV): The public ESO near-IR variability survey of the Milky Way,” New Astronomy 15(5), 433 – 443 (2010).
[30] Joye, W. and Mandel, E., “New features of SAOImage DS9,” in [Astronomical Data Analysis Software and Systems XII ASP Conference Series, Vol. 295 ], 489–492 (2003).
[31] Ware, C. and Lewis, M., “The DragMag Image Magnifier,” in [Conference Companion on Human Factors in Computing Systems ], CHI ’95, 407–408, ACM (1995).
[32] Robitaille, T. P., Tollerud, E. J., Greenfield, P., Droettboom, M., Bray, E., Aldcroft, T., Davis, M., Ginsburg, A., Price-Whelan, A. M., Kerzendorf, W. E., et al., “Astropy: A community Python package for astronomy,” Astronomy & Astrophysics 558, A33 (2013).
[33] Brighton, A., Albrecht, M., Dolensky, M., Ochsenbein, F., Fernique, P., and Wicenec, A., “JSky: Building a library of reusable Java components for Astronomy.” Talk at Astronomical Data Analysis Software and Sys-temshttp://archive.eso.org/cms/tools-documentation/jsky.html/JSky-BOF-Presentation(1999). (Accessed: 26 May 2016).
[34] Chapuis, O., Bezerianos, A., and Frantzeskakis, S., “Smarties: An input system for wall display develop-ment,” in [Proceedings of the 32nd international conference on Human factors in computing systems ], CHI ’14, 2763–2772, ACM (2014).
[35] Callahan, J., Hopkins, D., Weiser, M., and Shneiderman, B., “An empirical comparison of pie vs. linear menus,” in [Proceedings of the SIGCHI conference on Human factors in computing systems ], CHI ’88, 95– 100, ACM (1988).
[36] Olafsdottir, H. and Appert, C., “Multi-touch gestures for discrete and continuous control,” in [Proceedings of the International Working Conference on Advanced Visual Interfaces ], AVI ’14, 177–184, ACM (2014). [37] Pietriga, E., Huot, S., Nancel, M., and Primet, R., “Rapid development of user interfaces on cluster-driven
wall displays with jBricks,” in [Proceedings of the 3rd ACM SIGCHI symposium on Engineering interactive computing systems ], EICS ’11, 185–190, ACM (2011).
[38] Pietriga, E., “A Toolkit for Addressing HCI Issues in Visual Language Environments,” in [Proceedings of the 2005 IEEE Symposium on Visual Languages and Human-Centric Computing ], VLHCC ’05, 145–152, IEEE Computer Society (2005).
[39] Pietriga, E., Primet, R., Chapuis, O., Appert, C., and Gladin, O., “ZVTM - Zoomable Visual Transformation Machine.” http://zvtm.sourceforge.net(2016). (Accessed: 27 May 2016).
[40] Pietriga, E., Cubaud, P., Schwarz, J., Primet, R., Schilling, M., Barkats, D., Barrios, E., and Vilaro, B. V., “Interaction Design Challenges and Solutions for ALMA Operations Monitoring and Control,” in [Proceed-ings of the Astronomical Telescopes and Instrumentation conference: Software and Cyberinfrastructure for Astronomy II ], 10:1–10:16, SPIE (2012).
[41] Kiczales, G., Hilsdale, E., Hugunin, J., Kersten, M., Palm, J., and Griswold, W. G., “An overview of AspectJ,” in [ECOOP 2001—Object-Oriented Programming ], 327–354, Springer (2001).
[42] ICEsoft, “ICEpdf: Open Source Java PDF Engine.” http://www.icesoft.org/java/projects/ICEpdf/ overview.jsf(2016). (Accessed: 26 May 2016).
[43] Johnson, M., “JEP: Embed Python in Java.” https://github.com/mrj0/jep(2016). (Accessed: 24 May 2016).
[44] Lobo, M.-J., Pietriga, E., and Appert, C., “An evaluation of interactive map comparison techniques,” in [Proceedings of the 33rd Annual ACM Conference on Human Factors in Computing Systems ], CHI ’15, 3573–3582, ACM (2015).
[45] Jia, X., Luo, Q., and Fan, D., “Cross-matching large astronomical catalogs on heterogeneous clusters,” in [IEEE 21st International Conference on Parallel and Distributed Systems (ICPADS) ], 617–624 (Dec 2015). [46] Udalski, A., Szymański, M., Soszyński, I., and Poleski, R., “The optical gravitational lensing experiment.
final reductions of the OGLE-III Data,” Acta Astronomica 58(2), 69–87 (2008).
[47] Plaisant, C., “The challenge of information visualization evaluation,” in [Proceedings of the Working Con-ference on Advanced Visual Interfaces ], AVI ’04, 109–116, ACM (2004).