HAL Id: insu-01238446
https://hal-insu.archives-ouvertes.fr/insu-01238446
Submitted on 19 Jul 2020
HAL is a multi-disciplinary open access
archive for the deposit and dissemination of
sci-entific research documents, whether they are
pub-lished or not. The documents may come from
teaching and research institutions in France or
abroad, or from public or private research centers.
L’archive ouverte pluridisciplinaire HAL, est
destinée au dépôt et à la diffusion de documents
scientifiques de niveau recherche, publiés ou non,
émanant des établissements d’enseignement et de
recherche français ou étrangers, des laboratoires
publics ou privés.
Non-Migrating Tides in the Martian Atmosphere as
Observed by MAVEN IUVS
Daniel Y. Lo, Roger V. Yelle, Nicholas M. Schneider, Sonal K. Jain, A. Ian F.
Stewart, Scott L. England, Justin I. Deighan, Arnaud Stiepen, J. Scott Evans,
Michael H. Stevens, et al.
To cite this version:
Daniel Y. Lo, Roger V. Yelle, Nicholas M. Schneider, Sonal K. Jain, A. Ian F. Stewart, et al..
Non-Migrating Tides in the Martian Atmosphere as Observed by MAVEN IUVS. Geophysical Research
Letters, American Geophysical Union, 2015, 42 (21), pp.9057-9063. �10.1002/2015GL066268�.
�insu-01238446�
Nonmigrating tides in the Martian atmosphere as observed
by MAVEN IUVS
Daniel Y. Lo1, Roger V. Yelle1, Nicholas M. Schneider2, Sonal K. Jain2, A. Ian F. Stewart2,
Scott L. England3, Justin I. Deighan2, Arnaud Stiepen2, J. Scott Evans4, Michael H. Stevens5,
Michael S. Chaffin2, Matteo M. J. Crismani2, William E. McClintock2, John T. Clarke6,
Gregory M. Holsclaw2, Franck Lefèvre7, and Bruce M. Jakosky2
1Lunar and Planetary Laboratory, University of Arizona, Tucson, Arizona, USA,2Laboratory for Atmospheric and Space Physics, University of Colorado Boulder, Boulder, Colorado, USA,3Space Sciences Laboratory, University of California, Berkeley, California, USA,4Computational Physics, Inc., Springfield, Virginia, USA,5Naval Research Laboratory, Washington, District of Columbia, USA,6Center for Space Physics, Boston University, Boston, Massachusetts, USA, 7Laboratoire ATmosphères, Milieux, Observations Spatiales, Centre National de la Recherche Scientifique, Paris, France
Abstract
Using the Mars Atmospheric and Volatile EvolutioN mission (MAVEN) Imaging Ultraviolet Spectrograph (IUVS), we found periodic longitudinal variations in CO2density in the Martian atmosphere. These density variations are derived from observations of the CO+2(B2Σ+→X2Π) emission from limb
scans in the 100–190 km altitude range. The variations exhibit significant structure with longitudinal wave numbers 1, 2, and 3 in an effectively constant local solar time frame, and we attribute this structure to nonmigrating tides. The wave-2 component is dominated by the diurnal eastward moving DE1 tide at the equator and the semidiurnal stationary S0 tide at the midlatitudes. Wave-3 is dominated by the diurnal eastward moving DE2 tide, with possibly the semidiurnal eastward moving SE1 tide causing an amplitude increase at the midlatitudes. Structure in the wave-1 component can be explained by the semidiurnal westward moving SW1 tide.
1. Introduction
Diurnal solar forcing of planetary atmospheres can produce tides, global-scale oscillations in density, pressure, and temperature with periods which are harmonics of the solar day. Tides have been observed throughout the atmosphere, from the equatorial region [Withers et al., 2003] to the high northern and southern latitudes [Cahoy et al., 2007; Withers et al., 2011], and from the surface [Wilson and Hamilton, 1996] to 160 km altitude [Withers et al., 2003]. Numerical simulations [e.g., Forbes et al., 2002] predict that these tides can extend further up to 200 km.
Because of the widespread occurrence of tides, and also because tides can produce significant deviations in atmospheric state variables from their equilibrium values, a comprehensive study is critical for understanding the variability of the atmosphere and the circulation and transport processes that stem from this variability. Regions of turbulence can form from instabilities within the tidal fields, lifting suspended dust, water vapor, and other atmospheric constituents into the upper atmosphere [Zurek, 1976]. By controlling the densities of various atmospheric constituents directly or indirectly through such induced transport processes, tides can strongly influence atmospheric chemistry, ultimately exerting an indirect control on atmospheric loss rates. These far-reaching effects of tides imply that no understanding of the atmosphere can be complete without an understanding of atmospheric tides.
Using CO+
2 UV doublet (B2Σ+→X2Π) emission profiles obtained from limb scans with the Imaging Ultraviolet
Spectrograph (IUVS) [McClintock et al., 2014] on board the Mars Atmospheric and Volatile EvolutioN mission (MAVEN) spacecraft [Jakosky et al., 2015], we investigate the variation of CO2density with latitude and
longi-tude in a fixed local solar time (LST) frame. We observe significant spatial structure in the density variations and attribute this structure to tides.
In the next section, we provide some background information for understanding atmospheric tides and the CO+
2 UV doublet emission. Section 3 describes the observations, while section 4 explains the steps in the
RESEARCH LETTER
10.1002/2015GL066268
Special Section:
First Results from the MAVEN Mission to Mars
Key Points:
• MAVEN/IUVS observed periodic longitudinal variations in CO2density in the Martian atmosphere • We identify nonmigrating tides from
the structure of density variations in constant LST frame
• Wave-2 is dominated by DE1 and S0, wave-3 by DE2 and SE1, and wave-1 by SW1
Correspondence to:
D. Y. Lo,
Citation:
Lo, D. Y., et al. (2015), Nonmigrating tides in the Martian atmosphere as observed by MAVEN IUVS,
Geophys. Res. Lett., 42, 9057–9063,
doi:10.1002/2015GL066268.
Received 20 SEP 2015 Accepted 20 OCT 2015
Accepted article online 5 NOV 2015 Published online 11 NOV 2015
©2015. American Geophysical Union. All Rights Reserved.
Geophysical Research Letters
10.1002/2015GL066268
processing to obtain the CO2density. Results appear in section 5, with some discussion on the interpretation
of the observed wave structures. We conclude in section 6.
2. Background
2.1. Atmospheric TidesTides describe the intrinsic oscillatory modes of the planetary atmosphere in response to the diurnal solar forc-ing. The latitudinal and longitudinal structure of each tide is separable from the vertical structure [Chapman
and Lindzen, 1970; Forbes, 1995]. Altitudinal dependence is described by a characteristic vertical wavelength,
and evanescent modes with small vertical wavelengths decay rapidly with altitude. Latitudinal variations are described by Hough functions. Longitudinal variations are represented mathematically as a series of cosines [Forbes et al., 2002]: ∑
s
∑
n
As,ncos[(s − n)𝜆 + nΩt + 𝛿s,n] (1) where s is the zonal wave number, Ω is the planetary rotation rate,𝜆 is the east longitude, and t is the local solar time (LST). Tides with n = 1, 2 are diurnal and semidiurnal, respectively. As,nand𝛿s,nare the amplitude and phase of the individual tides, identified by the (s, n) label [Chapman and Lindzen, 1970; Forbes, 1995]. Solar forcing on a zonally symmetric planet gives rise to migrating or Sun-synchronous tides, characterized by s = n. Zonal asymmetries, such as in topography, surface thermal inertia, surface albedo, and dust, can interact with the solar forcing to produce nonmigrating tides, with s≠ n [Forbes, 2004].
When observed in a fixed LST reference frame, longitudinal variations due to the (s, n) tide will manifest as a wave-|s − n| structure, offset by an apparent phase 𝛿′
s,nthat has a magnitude equal to nΩt +𝛿s,n:
As,ncos[|s − n|𝜆 + 𝛿′
s,n] (2)
In such a reference frame, an observer will not be able to observe variations due to migrating tides (equation (2) reduces to a constant over all longitudes with s = n). However, this same observer will be able to observe longitudinal variations from nonmigrating tides, with each wave-k structure being the sum of nonmigrating tides with|s − n| = k. Identification of the dominant tides behind that structure involves the comparison of the observed amplitudes and phases, and their dependence on latitude and altitude to model results of specific tidal modes. Such is the case for this study, and we shall henceforth discuss only nonmigrating tides.
Previous observations and simulations of the Martian atmosphere have found several dominant nonmigrat-ing tides. The diurnal eastward (−1, 1) tide, also referred to as DE1, has been inferred from wave-2 structure in surface pressure data from Viking [Wilson and Hamilton, 1996], temperature measurements in the lower atmosphere by Thermal Emission Spectrometer (TES) [Banfield et al., 2003; Wilson, 2000] and the middle atmo-sphere by Mars Climate Sounder (MCS) [Guzewich et al., 2012], upper atmoatmo-sphere densities from aerobraking [Wilson, 2002; Withers et al., 2003], and atmospheric profiles inferred from observations by SPectroscopy for Investigation of Characteristics of the Atmosphere of Mars (SPICAM) [Withers et al., 2011]. Amplitudes are found to be ∼20% of the zonal mean value in the upper atmosphere over the tropics and the midlatitudes, decreasing toward the poles [Withers et al., 2003, 2011]. This is consistent with numerical simulations [Bougher
et al., 2004; Angelats i Coll et al., 2004; Wilson, 2002; Forbes and Miyahara, 2006], which returned amplitudes of
10%–40%.
Wave-3 structure is typically smaller than the wave-2 component and has been attributed to two tides. The DE2 (−2, 1) tide has been observed in TES temperature data by Wilson [2000] and Banfield et al. [2003], and in MCS data by Guzewich et al. [2012] and Moudden and Forbes [2014]. Observations of atmospheric densities [Withers et al., 2003] and electron densities [Bougher et al., 2001, 2004; Cahoy et al., 2007] at high latitudes found the semidiurnal SE1 (−1, 2) tide to dominate instead. To reconcile the seemingly contradictory conclusions from the various studies, Wilson [2002] and Withers et al. [2011] suggested that DE2 is dominant at the equa-torial region, while SE1 is dominant at the high latitudes. This hypothesis is later confirmed by Wolkenberg and
Wilson [2014].
The wave-1 component is typically weaker than both wave-2 and wave-3. Due to the large observational uncertainties associated with lower signal strength, it has been difficult attributing this component to par-ticular tides [Withers et al., 2003, 2011]. Modeling by Moudden and Forbes [2008] suggests that the diurnal stationary D0 (0, 1) tide and the semidiurnal westward SW1 (1, 2) tide may be significant.
2.2. CO+2 UV Doublet Emission
Often referred to as the UV doublet (UVD), the CO+ 2 (B
2Σ+→X2Π) electronic transition system at 289 nm
provides a direct measure of CO2densities in the Martian atmosphere. CO+2(B
2Σ+) is generated from CO 2
via photoionization and photoelectron impact, and from CO+ 2(X
2Π) by solar photons via fluorescent
scatter-ing [Fox, 2004]. Studies by Fox and Dalgarno [1979], Jain and Bhardwaj [2012], and Stiepen et al. [2015] have found photoionization and photoelectron impact to be the dominant mechanisms, with fluorescent scatter-ing accountscatter-ing for 1% of total UVD emission rates at ∼ 130 km and<25% at ∼180 km. This dominance of photoionization and photoelectron impact means that CO+
2UVD volume emission rates are effectively
con-trolled by CO2density and the solar EUV flux. Since the solar EUV flux is uniform over the sunlit planetary disk, spatial variations in UVD intensity can be used to infer variations in the CO2density.
3. Observations
Data used in this study come from limb scans performed by the Imaging Ultraviolet Spectrograph (IUVS) on the MAVEN spacecraft. Details of IUVS operation and observational phases can be found in McClintock et al. [2014]. Briefly, IUVS is mounted on an Articulated Payload Platform (APP) which allows for controlled orienta-tion of the instrument slit as it captures spectra of the planet in the FUV (110– 190 nm) and MUV (180–340 nm) channels. Limb scans are taken near the periapses, with the slit pointed perpendicularly and to the right of the direction of motion [Jain et al., 2015]. A scan mirror sweeps the slit up and down, allowing IUVS to map the vertical profile of the atmosphere with an altitude resolution of ∼7 km. Twelve scans are taken in this manner with each periapse pass. With the slit spanned by 7 spatial bins, a total of 84 limb profiles are taken during the periapse observational phase of each orbit.
This study makes use of periapse limb profiles obtained with the MUV channel from Orbit 109 (start time 18 October 2014 16:05 UT) to Orbit 128 (start time 22 October 07:49 UT), corresponding to a solar longitude
Ls=217∘ –219∘. No data was taken during Orbit 115, as the spacecraft stood down due to dust concerns
associated with the passage of Comet Siding Spring [Schneider et al., 2015]. In order to constrain our observa-tions to a narrow range in LST for the observation of nonmigrating tides, only profiles from scans 6 − 12 are used in this study. For this set of profiles, all observations are taken between 1340 and 1500 LST. With each periapse pass, the tangent latitude of the line of sight migrates southward from ∼44∘ to ∼−5∘while the tangent longitude varies by ∼15∘. Spacecraft altitude increases from ∼190 km at scan 6 to ∼530 km at scan 12. Between successive orbits, longitudinal coverage changes by ∼67∘eastward, with every sixteenth orbit returning to approximately the same longitude. A total of 873 profiles is used in our analysis.
4. Analysis
Raw data are processed through the standard pipeline for IUVS periapse limb scans. After removing the detec-tor dark current, the digital numbers are converted into physical intensities using a calibration curve based on observations of UV-bright stars, with an appropriate scaling by instrument geometric factors for extended source observations. CO+
2UVD emissions are then isolated from the calibrated spectra using a Multiple
Lin-ear Regression (MLR) algorithm. The MLR algorithm involves the scaling and fitting of reference spectra for all known emissions in the MUV region [Stevens et al., 2015]. In the 289 nm region, the only significant spec-tral features are the UVD band and a background signal that follows the specspec-tral shape of the Sun. This latter component is still being investigated but is likely due to scatter by aerosols in the Martian atmosphere, pos-sibly with an additional contribution from instrumental stray light. In either case, the spectral shapes of the UVD and the solar component differ greatly and separation is straightforward.
We adopt an empirical approach to determine the CO2density from the measured intensity. The volume emis-sion rate is parameterized as a Chapman profile, and the measured intensity is fitted to the integral of the volume emission rate along the line of sight:
I = 2 ∫ ∞ b C𝜎n0exp (z 0− z H − 𝜎n0H 𝜇0 e(z0−z)∕H ) rdz √ r2− b2
where z is the altitude, b is the impact parameter measured from the center of the planet, r = R + z with R being the planetary radius,𝜎 is the absorption cross section for the UV photon, n0is the number density of
CO2at the reference altitude z0, H is the atmospheric scale height,𝜇0is the cosine of the solar zenith angle, and
Geophysical Research Letters
10.1002/2015GL066268
Figure 1. Chapman layer fits to isolated CO+2UVD profiles at∼10∘N and different longitudes. All profiles are from scan 10 spatial bin 4 of the respective orbits. Error bars denote1𝜎random uncertainties in the measurements. The higher density at 221∘E gives rise to a higher altitude of the emission peak (indicated by the arrows).
for ease of comparison with other stud-ies of Martian atmospheric tides. Three parameters are allowed to vary in the fit-ting process: C, H, and 𝜎n0, which we refer to as the scaled density. Because the fit is done over an altitude range of 100–190 km, it will be more sensitive to tides with long vertical wavelengths that span a larger fraction of that win-dow. Figure 1 shows some fits to the MLR-derived profiles.
Of course, we do not expect the volume emission rate to rigorously follow a Chap-man profile. The ChapChap-man layer is used here as a convenient way to empirically characterize the emissions rather than a rigorous description of the excitation pro-cess. Nonetheless, because the Chapman layer is an approximation to the UVD emission processes, its emission profile possesses the correct shape, and, as shown in Figure 1, the fits based on this approach are excellent. The analytic form of this Chapman approximation allows us to easily deter-mine the value of𝜎n∘ for characterizing CO2density variations in the atmosphere. As the fits in Figure 1 show,
the scaled density controls the altitude of the emission peak, essentially the altitude of the maximum CO2
photoionization rate. The Chapman profile does rigorously describe the variation of emission rate with solar zenith angle to the extent that the atmosphere can be treated as plane parallel. Thus, it satisfies our objec-tive in providing a good measure of the relaobjec-tive CO2density variations in the atmosphere. In addition, the derived scaled densities will not be sensitive to the detector calibration. Although there are uncorrected flat-field effects that result in sensitivity variations of ∼10% across the spatial bins, these will only change the value of C rather than the scaled density.
5. Results and Discussion
Figure 2 shows an overview of variations in CO2density with latitude and longitude. Because IUVS coverage
returns to a similar longitude every sixteenth orbit, we are able to determine these variations to be persistent in a fixed LST frame, leading to our interpretation of the observed structures as tides. Along the equator, we observe a strong wave-2 tidal component, with peaks occurring at 75∘E and 225∘E. The amplitude of this
Figure 2. Scaled density at 130 km binned by latitude and longitude,
with crosses showing the location of the individual profiles.
Observations are made between 1340 and 1500 LST atLs= 217∘–219∘. A value of 0.1 (km−1) corresponds to a density of∼1011cm−3 assuming𝜎 ∼10−17cm2.
component decreases toward higher lati-tude. There is also a smaller set of peaks at ∼40∘N, at a different apparent phase from the equatorial component.
As discussed previously, identification of the dominant tides requires the decom-position of the structure into components of different wave numbers, and subse-quent analysis of the amplitudes and phases. Grouping profiles into 10∘ latitude bands, we fit sinusoids of wave numbers 1, 2, and 3 to the scaled density values. Figure 3 shows the fits between −5∘N and 5∘N and between 35∘N and 45∘N. Figure 4 shows the amplitudes A′
normal-ized to the zonal mean values and appar-ent phases𝛿′ from the fits, with Table 1
Figure 3. Fit to variations of scaled density at 130 km derived from profiles from (left)−5∘N to 5∘N and from (right) 35∘N to 45∘N. Error bars denote1𝜎fit uncertainties. A value of 0.1 (km−1) in scaled density corresponds to a density of ∼ 1011cm−3assuming𝜎 ∼ 10−17cm2.
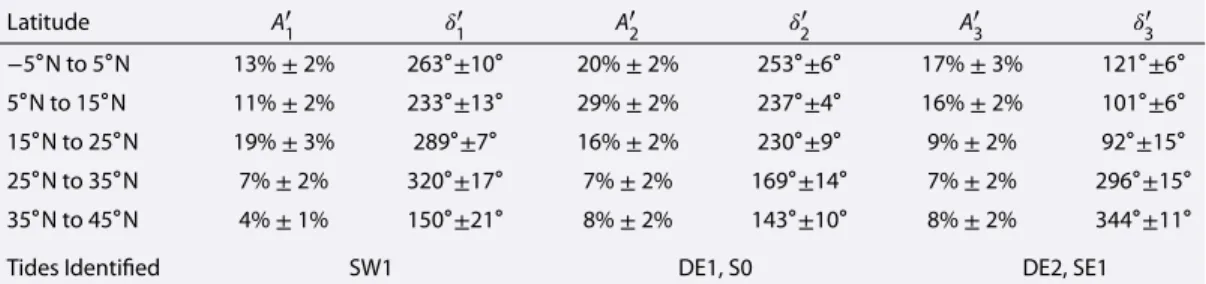
As anticipated from Figure 2, the wave-2 component has the largest average amplitude, with a peak of 29% at ∼10∘N, decreasing to 6% at ∼30∘N. This structure is characteristic of the DE1 tide which has been identi-fied as the dominant mode at the equatorial region by the previous studies detailed in section 2.1. Further confirmation of a dominant DE1 tide comes from the phase, which has been found to change minimally with season from the surface to 130 km [Wilson, 2002]. After correcting for the LST, we find a phase of 253±7∘ at the
Figure 4. Fitted amplitudesA′and apparent phases𝛿′for wave-1, wave-2, and wave-3 components for scaled densities at 130 km obtained from profiles grouped by latitude band. Error bars denote1𝜎 fit uncertainties.
equator, comparable to the phase of 286±20∘ (averaged over −5∘N and 5∘N) observed by Withers et al. [2003]. North-ward of ∼30∘N, the amplitude increases slightly to 8%, with a significant decrease in apparent phase. This change in appar-ent phase, together with the amplitude trending in the opposite direction expected from the DE1 tide, suggests another tide becoming dominant at the higher latitudes. Modeling by Moudden
and Forbes [2008] found the semidiurnal
stationary S0 (0, 2) tide increasing to 20% of the DE1 peak amplitude at ∼40∘N, consistent with our observations. If we assume that these model results remain valid over different seasons (Ls= 26∘ –92∘
for Moudden and Forbes [2008]), then the amplitude increase in the wave-2 com-ponent at the higher latitudes can be explained by the S0 tide.
The average amplitude of the wave-3 component is slightly smaller than that for wave-2, decreasing from 18% from the equator with latitude. This latitu-dinal structure agrees well with previ-ous studies such as Bougher et al. [2001, 2004], Withers et al. [2003, 2011], and points to the DE2 tide, rather than SE1 which instead has a local maximum at ∼20∘N. This is consistent with the obser-vations by Wilson [2002] and Withers et al. [2011] that DE2 dominates at equato-rial latitudes. Phases show only a rough
Geophysical Research Letters
10.1002/2015GL066268
Table 1. Fitted AmplitudesA′kNormalized to Zonal Mean and Apparent Phases𝛿′kfor Various Latitude Bands for Wave Numbersk = 1, 2, 3 Latitude A′ 1 𝛿′1 A′2 𝛿′2 A′3 𝛿′3 −5∘N to 5∘N 13%± 2% 263∘±10∘ 20%± 2% 253∘±6∘ 17%± 3% 121∘±6∘ 5∘N to 15∘N 11%± 2% 233∘±13∘ 29%± 2% 237∘±4∘ 16%± 2% 101∘±6∘ 15∘N to 25∘N 19%± 3% 289∘±7∘ 16%± 2% 230∘±9∘ 9%± 2% 92∘±15∘ 25∘N to 35∘N 7%± 2% 320∘±17∘ 7%± 2% 169∘±14∘ 7%± 2% 296∘±15∘ 35∘N to 45∘N 4%± 1% 150∘±21∘ 8%± 2% 143∘±10∘ 8%± 2% 344∘±11∘
Tides Identified SW1 DE1, S0 DE2, SE1
correspondence, however, with values of 25±7∘, 54±9∘, and ∼90∘ for this study, Withers et al. [2003], and
Wilson [2002], respectively. This discrepancy in phase may be due to the different seasons at which the
obser-vations for the various studies were conducted. At 30∘ –40∘N, a reversal in the amplitude trend expected from DE2 together with a large change in apparent phase of 200∘ (almost a flip in the tidal structure) points to the presence of another dominant tide at the higher latitudes. The amplitude increase is consistent with SE1 becoming dominant at the higher latitudes, but a poor correspondence in phases and the constraint of observations to a single LST in this study prevent a conclusive identification.
While previous observational studies have detected a weak but significant wave-1 component, these stud-ies were unable to pinpoint the dominant tides producing this wave-1 signal. Our fitted wave-1 component exhibits a sharp peak at ∼20∘N, which resembles the structure for the SW1 (1, 2) tide as modeled by Moudden
and Forbes [2008]. Beneath the peak, the observed amplitude also shows a general decrease toward the north,
another feature consistent with the modeled SW1 tide. With the same caveat regarding potentially unknown seasonal dependences, we suggest that the wave-1 structure is dominated by the SW1 tide.
6. Conclusions
Examining variations in CO2scaled densities derived from fitting Chapman profiles to CO+
2 UVD emissions
from IUVS limb scans, we are able to observe significant wave-1, wave-2, and wave-3 tidal structures at 100–190 km altitude. Amplitudes of all three components are consistent with previous observations and modeling results. Wave-2 is dominated by DE1 at the equator, with S0 being a possible explanation for the structure observed at the midlatitudes. Wave-3 structure is consistent with DE2 and SE1 at the equator and midlatitudes, respectively, but this cannot be confirmed by a phase comparison. Wave-1 appears to be dominated by SW1.
Generally, identification of tides in this study is complicated by an uncertainty that stems from a poor under-standing of how tides in the upper Martian atmosphere change with the seasons. This uncertainty should not persist for long, however. The data set used in this study is but a small fraction of all limb scan data that will come from MAVEN IUVS. This study demonstrates that even with a limited data set we are able to draw significant conclusions and is a prelude to the science that can come from an expanding data set as MAVEN proceeds through its mission. We will be able to investigate seasonal changes in the tidal structures and also better characterize the vertical structure of tides with the larger volume of data. The precession of the space-craft orbit will allow us to sample densities at a different LST, to better characterize phases of the various tides, and to go beyond the restrictions of the constant LST frame and start observing migrating tides. These additional dimensions to the data will be able to provide more constraints for the validation of atmospheric models, ultimately forming the foundation for the comprehensive study we need to understand the behavior and effects of thermal tides in the Martian atmosphere.
References
Angelats i Coll, M., F. Forget, M. A. López-Valverde, P. L. Read, and S. R. Lewis (2004), Upper atmosphere of Mars up to 120 km: Mars Global Surveyor accelerometer data analysis with the LMD general circulation model, J. Geophys. Res., 109, E01011, doi:10.1029/2003JE002163. Banfield, D., B. J. Conrath, M. D. Smith, P. R. Christensen, and R. J. Wilson (2003), Forced waves in the Martian atmosphere from MGS TES nadir
data, Icarus, 161, 319–345, doi:10.1016/j.icarus.2004.03.015.
Bougher, S. W., S. Engel, D. P. Hinson, and J. M. Forbes (2001), Mars Global Surveyor Radio Science electron density profiles: Neutral atmosphere implications, Geophys. Res. Lett., 28(16), 3091–3094.
Bougher, S. W., S. Engel, D. P. Hinson, and J. R. Murphy (2004), MGS Radio Science electron density profiles: Interannual variability and implications for the Martian neutral atmosphere, J. Geophys. Res., 109, E03010, doi:10.1029/2003JE002154.
Acknowledgments
The data used in the study are archived in the Planetary Atmospheres Node of the Planetary Data System at http://atmos.nmsu.edu/data_and_ services/atmospheres_data/MAVEN/ maven_iuvs.html. Each filename is marked with the identifier “periapse,” the orbit number, the start time of the observation, and “v02_r01” reflecting the version of the calibration curve and MLR decomposition. The MAVEN project is supported by NASA through the Mars Exploration Program. Arnaud Stiepen is supported by the Belgian American Educational Foundation and the Rotary District 1630. The authors thank Steve Bougher, John Wilson, and Paul Withers for providing critical and valuable comments toward the improvement of this manuscript in their reviews.
Cahoy, K. L., D. P. Hinson, and G. L. Tyler (2007), Characterization of a semidiurnal eastward-propagating tide at high northern latitudes with Mars Global Surveyor electron density profiles, Geophys. Res. Lett., 34, L15201, doi:10.1029/2007GL030449.
Chapman, S., and R. Lindzen (1970), Atmospheric Tides. Thermal and Gravitational, D. Reidel, Dordrecht, Netherlands.
Forbes, J. M. (1995), Tidal and planetary waves, in The Upper Mesosphere and Lower Thermosphere: A Review of Experiment and Theory, edited by R. M. Johnson and T. L. Killeen, pp. 67–87, AGU, Washington, D. C., doi:10.1029/GM087p0067.
Forbes, J. M. (2004), Tides in the middle and upper atmospheres of Mars and Venus, Adv. Space Res., 33(2), 125–131, doi:10.1016/j.asr.2003.05.007.
Forbes, J. M., and S. Miyahara (2006), Solar semidiurnal tide in the dusty atmosphere of Mars, J. Atmos. Sci., 63(7), 1798–1817, doi:10.1175/JAS3718.1.
Forbes, J. M., F. C. Bridger, S. W. B. Alison, M. E. Hagan, J. L. Hollingsworth, G. M. Keating, and J. Murphy (2002), Nonmigrating tides in the thermosphere of Mars, J. Geophys. Res., 107(E11), 5113, doi:10.1029/2001JE001582.
Fox, J. L. (2004), CO+2dissociative recombination: A source of thermal and nonthermal C on Mars, J. Geophys. Res., 109, A08306, doi:10.1029/2004JA010514.
Fox, J. L., and A. Dalgarno (1979), Ionization, luminosity, and heating of the upper atmosphere of Mars, J. Geophys. Res., 86(A12), 7315–7333, doi:10.1029/JA086iA02p00629.
Guzewich, S. D., E. R. Talaat, and D. W. Waugh (2012), Observations of planetary waves and nonmigrating tides by the Mars Climate Sounder,
J. Geophys. Res., 117, E03010, doi:10.1029/2011JE003924.
Jakosky, B. M., et al. (2015), The Mars Atmosphere and Volatile EvolutioN (MAVEN) mission, Space Sci. Rev., doi:10.1007/s11214-015-0139-x. Jain, S. K., and A. Bhardwaj (2012), Impact of solar EUV flux on CO Cameron band and CO+2UV doublet emissions in the dayglow of Mars,
Planet. Space Sci., 63–64, 110–122, doi:10.1016/j.pss.2011.08.010.
Jain, S. K., et al. (2015), The structure and variability of Mars upper atmosphere as seen in MAVEN/IUVS dayglow observations, Geophys. Res.
Lett., 42, doi:10.1002/2015GL065419.
McClintock, W. E., N. M. Schneider, G. M. Holsclaw, J. T. Clarke, A. C. Hoskins, A. I. Stewart, F. Montmessin, R. V. Yelle, and J. Deighan (2014), The Imaging Ultraviolet Spectrograph (IUVS) for the MAVEN mission, Space Sci. Rev., doi:10.1007/s11214-014-0098-7.
Moudden, Y., and J. M. Forbes (2008), Topographic connections with density waves in Mars’ aerobraking regime, J. Geophys. Res., 113, E11009, doi:10.1029/2008JE003107.
Moudden, Y., and J. M. Forbes (2014), Insight into the seasonal asymmetry of nonmigrating tides on Mars, Geophys. Res. Lett., 41, 2631–2636, doi:10.1029/2008JE003107.
Schneider, N. M., et al. (2015), MAVEN IUVS observations of the aftermath of the Comet Siding Spring meteor shower on Mars, Geophys. Res.
Lett., 42, 4755–4761, doi:10.1002/2015GL063863.
Stevens, M. H., et al. (2015), New observations of molecular nitrogen in the Martian upper atmosphere by IUVS on MAVEN, Geophys. Res.
Lett., 42, doi:10.1002/2015GL065319.
Stiepen, A., J.-C. Gerard, S. W. Bougher, F. Montmessin, B. Hubert, and J.-L. Bertaux (2015), Mars thermospheric scale height: CO Cameron and CO+2dayglow observations from Mars Express, Icarus, 245, 295–305, doi:10.1016/j.icarus.2014.09.051.
Wilson, R. J. (2000), Evidence for diurnal period Kelvin waves in the Martian atmosphere from Mars Global Surveyor TES data, Geophys. Res.
Lett., 27(23), 3889–3892, doi:10.1029/2000GL012028.
Wilson, R. J. (2002), Evidence for nonmigrating thermal tides in the Mars upper atmosphere from the Mars Global Surveyor Accelerometer Experiment, Geophys. Res. Lett., 29(7), 1120–1123, doi:10.1029/2001GL013975.
Wilson, R. J., and K. Hamilton (1996), Comprehensive model simulation of thermal tides in the Martian atmosphere, J. Atmos. Sci., 53(9), 1290–1326, doi:10.1175/1520-0469(1996)053<1290:CMSOTT>2.0.CO;2.
Withers, P., S. W. Bougher, and G. M. Keating (2003), The effects of topographically-controlled thermal tides in the Martian upper atmosphere as seen by the MGS accelerometer, Icarus, 164, 14–32, doi:10.1016/S0019-1035(03)00135-0.
Withers, P., R. Pratt, J.-L. Bertaux, and F. Montmessin (2011), Observations of thermal tides in the middle atmosphere of Mars by the SPICAM instrument, J. Geophys. Res., 116, E11005, doi:10.1029/2011JE003847.
Wolkenberg, P., and R. J. Wilson (2014), Mars Climate Sounder observations of wave structure in the north polar middle atmosphere of Mars during the summer season, paper presented at Eighth International Conference on Mars, LPI Contribution No. 1791, Pasadena, Calif., 14–18 July.
Zurek, R. W. (1976), Diurnal tide in the Martian atmosphere, J. Atmos. Sci., 33(2), 321–337, doi:10.1175/1520-0469(1976)033<0321:DTITMA>2.0.CO;2.