Materials and Structures
Use of a reference limestone fine aggregate to study the fresh and hard behavior of
mortar made with recycled fine aggregate
--Manuscript
Draft--Manuscript Number: MAAS-D-18-01401R2
Full Title: Use of a reference limestone fine aggregate to study the fresh and hard behavior of mortar made with recycled fine aggregate
Article Type: Original Research
Keywords: Recycled fine aggregate; model natural fine aggregate; water absorption; saturation; effective water
Corresponding Author: Mohamed ElKarim Bouarroudj, PHD student IMT Lille Douai
Douai, FRANCE Corresponding Author Secondary
Information:
Corresponding Author's Institution: IMT Lille Douai Corresponding Author's Secondary
Institution:
First Author: Mohamed ElKarim Bouarroudj, PHD student First Author Secondary Information:
Order of Authors: Mohamed ElKarim Bouarroudj, PHD student Sébastien Remond, Professor
Frédéric Michel, Laboratory Head Zengfeng Zhao, Senior Researcher David Bulteel, Professor
Luc Courard, Professor Order of Authors Secondary Information:
Funding Information: Interreg France-Wallonie-Vlaanderen 2014-2020
(VALDEM convention n°1.1.57)
Not applicable
Abstract: Recycled fine concrete aggregates (RFA) are not enough used in the construction sector, mainly because of their high water absorption capacity. These fine particles are composed of crushed natural aggregate and adherent hardened cement paste. The main goal of this research is to compare the behaviors of mortars made either with RFA or with a model limestone fine natural aggregate (LFA). The LFA is prepared in order to obtain physical properties as close as possible to those of the RFA. A specific characterisation is carried out to compare the density, water absorption, morphology of grains, size distribution and packing density of both aggregates. Mortars are then manufactured with same composition and same volume of LFA and RFA. Different states of moisture of the RFA are studied. The fresh behaviour of the mortar made with saturated RFA is very close to that of the mortar made with LFA which confirms that the latter is a good reference compared to the RFA. Comparison of fresh behaviours of mortars made with RFA of different state of moisture to that of mortar made with saturated sand allows then to determine the water absorbed in the different moisture conditions. Afterwards, a mechanical study is realised, taking into consideration the exact quantity of absorbed water of the RFA in dry or saturated conditions. Knowing the exact effective water value allows us to study both the strength of mortar made with RFA, the strength of the matrix and the adherence between the fine aggregate and the paste.
Additional Information:
Question Response
Provide the total number of words in the manuscript (excluding figure caption and table caption)?
7355
Provide total number of FIGURES? 7 Provide total number of TABLES? 7
Use of a reference limestone fine aggregate to study
1
the fresh and hard behavior of mortar made with
2
recycled fine aggregate
3
Mohamed ElKarim Bouarroudja,b*, Sébastien Remonda, Frédéric Michelb, Zengfeng Zhaob, 4
David Bulteela, Luc Courardb 5
aIMT Lille Douai, Univ. Lille, EA4515-LGCgE-Laboratoire de Génie Civil et
6
géoEnvironnement, Département Génie Civil and Environnemental, F-59000 Lille, France 7
bUniversity of Liège, Urban and Environment Research Unit, ArGEnCo Department, GeMMe
8
Building Materials, Liège, Belgium 9
Abstract
10
Recycled fine concrete aggregates (RFA) are not enough used in the construction sector, mainly because of their
11
high water absorption capacity. These fine particles are composed of crushed natural aggregate and adherent
12
hardened cement paste. The main goal of this research is to compare the behaviors of mortars made either with
13
RFA or with a model limestone fine natural aggregate (LFA). The LFA is prepared in order to obtain physical
14
properties as close as possible to those of the RFA. A specific characterisation is carried out to compare the density,
15
water absorption, morphology of grains, size distribution and packing density of both aggregates. Mortars are then
16
manufactured with same composition and same volume of LFA and RFA. Different states of moisture of the RFA
17
are studied. The fresh behaviour of the mortar made with saturated RFA is very close to that of the mortar made
18
with LFA which confirms that the latter is a good reference compared to the RFA. Comparison of fresh behaviours
19
of mortars made with RFA of different state of moisture to that of mortar made with saturated sand allows then to
20
determine the water absorbed in the different moisture conditions. Afterwards, a mechanical study is realised,
21
taking into consideration the exact quantity of absorbed water of the RFA in dry or saturated conditions. Knowing
22
the exact effective water value allows us to study both the strength of mortar made with RFA, the strength of the
23
matrix and the adherence between the fine aggregate and the paste.
24
Keywords: Recycled fine aggregate- model natural fine aggregate- water absorption- 25
saturation- effective water 26
1. Introduction
27
Large quantities of construction and demolition wastes (CDW) are produced each year. For 28
example, the annual production of CDW is around 260 million tons in France [1] and 15 million 29
tons in Belgium [2]. Amongst these wastes, Recycled Concrete Aggregates (RCA) can be 30
considered as inert, and could be used as an alternative source of aggregates for the production 31
Click here to access/download;Manuscript;Bouarroudj Mohamed ElKarim MS forme corection.docx
Click here to view linked References
1 2 3 4 5 6 7 8 9 10 11 12 13 14 15 16 17 18 19 20 21 22 23 24 25 26 27 28 29 30 31 32 33 34 35 36 37 38 39 40 41 42 43 44 45 46 47 48 49 50 51 52 53 54 55 56 57 58 59 60 61
of new concrete. So far, only a small fraction of these RCA is used as aggregate in concrete 32
production. 33
RCA are composed of a mix of natural aggregates and hardened cement paste. Comparing to 34
natural aggregates, RCA possess a high water absorption coefficient, (between 4 and 12%) and 35
a lower density (between 2.1 and 2.5g/cm3) [3–5] The cement paste increases the porosity of 36
the material. Cement paste content of RCA is larger in recycled fine aggregate (RFA) than in 37
coarse recycled aggregate[6,7]: this is why RFA represents the most difficult part to valorize. 38
Several research works have been carried out in order to use RFA as aggregate to manufacture 39
mortars or concrete[8,9], as a mineral addition in cementitious materials [10] or as raw material 40
in cement manufacturing [11]. 41
RCA are often incorporated into concrete or mortar as substitution of natural aggregates. The 42
influence of RCA substitution rate on the properties of concrete is controversial. Braga et al. 43
[12] studied the incorporation of fine recycled concrete aggregates in mortars with replacement 44
ratios of 5, 10 and 15%. An improvement of rheological and mechanical behaviors was 45
observed when the RCA was incorporated. Neno et al.[13] proposed a substitution of natural 46
fine aggregate (NFA) by RFA in different percentage ratio, and found that to have the same 47
fresh and hardened behavior of mortar, the replacement ratio in mortar composition is limited 48
to 20% by volume of replacement. Vegas et al. [14] studied the performances of masonry 49
mortars made with fine recycled concrete aggregates; a substitution rate of 25, 50, 75 and 100% 50
of the NFA by RFA was investigated. In this study, the quantity of water was adjusted in order 51
to work with the same consistency. The mechanical results showed that the incorporation of up 52
to 25% of recycled aggregate didn’t affect the properties of hardened masonry mortars. Pedro 53
et al. [15] studied the simultaneous incorporation of fine and coarse recycled aggregates in 54
concrete. The results show that it is possible to achieve a comparable structural element with 55
recycled material, to those performed with natural one. Carro-Lopez et al. [16] showed that 56
substitution of up to 20% of natural aggregate (NA) by RCA decreased the fresh properties of 57
mortar and concrete. Omary et al. [17] and Fan et al. [18] found that using recycled aggregate 58
decreased the mechanical properties of mortar and concrete. But Hu et al. showed the opposite 59
[19]. Vinay Kumar et al. [20] performed an experimental study on the use of coarse and fine 60
aggregates to design a self-compacting concrete (SCC) : 20% of natural coarse and fine 61
aggregates were replaced by recycled aggregates. No significant difference was observed on 62
the rheological behavior, but an improvement in the mechanical behavior was observed. In 63
similar studies, Omrane et al. [21] and Kou et al. [22] found that the recycled aggregate 64
substitution should be limited to 50% in order to fulfil all recommendations of SCC. Carro-65 1 2 3 4 5 6 7 8 9 10 11 12 13 14 15 16 17 18 19 20 21 22 23 24 25 26 27 28 29 30 31 32 33 34 35 36 37 38 39 40 41 42 43 44 45 46 47 48 49 50 51 52 53 54 55 56 57 58 59 60
Lôpez et al.[23] studied the rheology of SCC with RFA. NFA was replaced by 20%, 50%, and 66
100% by RFA. The natural and recycled fine aggregate were sieved and recomposed in order 67
to have a similar particle size distribution. The mixing water was adjusted by adding extra water 68
corresponding to water absorbed after 10 minutes. The results showed a decrease in fresh and 69
hardened properties of concrete for 50% and 100% of replacement of natural fine aggregate by 70
recycled one. 71
The literature review shows contradictory results concerning detrimental (or beneficial) effect 72
of NA substitution by RCA. This variability might first be due to the nature of the used 73
aggregates (both natural and recycled) coming from different sources. But the comparison itself 74
between mortars or concretes manufactured with NA and with RCA might be questioned. In 75
order to find out whether NA substitution by RCA decreases (or increases) concrete properties, 76
the composition parameters of the two concretes have to be as close as possible. In particular, 77
efficient water to cement ratio, volume of aggregates, and physical characteristics of the 78
granular skeleton (particle size distribution, particle’s morphology …) should be similar. 79
Several research works have already compared the behavior of mortars containing NFA to 80
mortars produced with RFA[23]. But to our knowledge, comparison of two mortars possessing 81
very similar mixture proportions and material characteristics has not been carried out yet. 82
In this study, the fresh and hardened properties of mortars manufactured with RFA are 83
compared to those of mortars of identical compositions with NFA presenting very similar 84
physical characteristics to those of RFA. The main objective is to study, when the composition 85
parameters of mortars are almost identical, what is the effect of a total substitution of NFA by 86
RFA. 87
2. Methodology
88
Ideally, the simplest way to study the effect of substitution of NFA by RFA in mortars would 89
be to replace a given volume of NFA by the same volume of RFA, keeping the workability of 90
the mortars constant. Then, mechanical properties of the two mortars could be compared and 91
the effect of this substitution (negative or even positive) could be derived. However, replacing 92
NFA by RFA generally leads to changes both in the fresh and hardened properties of mortars. 93
In this study, we need therefore to first define a model NFA, starting from a given RFA, that 94
would lead to the same properties in fresh state for two mortars and where the only difference 95
would be the nature of the fine particles (either RFA or NFA). 96 1 2 3 4 5 6 7 8 9 10 11 12 13 14 15 16 17 18 19 20 21 22 23 24 25 26 27 28 29 30 31 32 33 34 35 36 37 38 39 40 41 42 43 44 45 46 47 48 49 50 51 52 53 54 55 56 57 58 59 60 61
For this purpose, the rheological behavior has to be defined and can be described approximately 97
by the Krieger & Dougherty model [24] (Eq. 1). 98 c(ϕ) = ηc(0) (1-𝜙𝜙 𝑚) -[η]ϕ m………(1) 99
where : c(ϕ) is the viscosity of the suspension, ηc(0) is the viscosity of the interstitial fluid, ϕ
100
is the solid volume fraction of particles in suspension, ϕm is the maximum packing fraction and
101
[η] is the intrinsic viscosity of particles (depending on their shape). 102
Several studies [25–27] have proven that the previous parameters are of first order for the 103
control of mortars and concrete rheological behavior. 104
If one wants the two previous mortars (with NFA or RFA) to possess the same rheological 105
behaviour, the four parameters of the Krieger & Dougherty model should be the same. That is 106
to say: 107
- The viscosity of the suspending fluid (the cement paste) should be the same in both 108
mortars. This implies that the two mortars contain the same effective water to cement 109
ratio (Weff/C). As RFA generally possess a high water absorption coefficient, the only
110
way to precisely control the effective water is to use pre-saturated RFA, so that water 111
movements between cement paste and RFA can be prevented; 112
- The solid volume fraction of aggregates in the two mortars should be identical. This 113
necessitates using the same envelop volume of particles (i.e. the volume of solid 114
particle plus internal particle porosity should be constant); 115
- The maximum packing fraction should be constant, which at least implies that particle 116
size distributions and particle’s morphologies would be very similar; 117
- The intrinsic viscosity of particles should also be the same. Intrinsic viscosity for real 118
fine aggregate particles is difficult to define; however, this constraint would be 119
fulfilled if particles of the two fine aggregates had approximately the same particles 120
geometry and same particle surface. 121
Based on the previous elements, the RFA and NFA used in this study have been defined as 122
follows: 123
- The RFA has been produced from the crushing of a laboratory concrete of known 124
composition. 125
- The NFA has been produced by crushing the natural coarse aggregate used for the 126
manufacture of the parent concrete, with the same procedure and same crusher as for 127 the RFA; 128 1 2 3 4 5 6 7 8 9 10 11 12 13 14 15 16 17 18 19 20 21 22 23 24 25 26 27 28 29 30 31 32 33 34 35 36 37 38 39 40 41 42 43 44 45 46 47 48 49 50 51 52 53 54 55 56 57 58 59 60
- The NFA has then been cut in seven different size fractions (2/4mm, 1/2mm, 129
0.5/1mm, 0.25/0.5mm, 0.125/0.25mm, 0.063/0.125mm, and <0.063mm) and 130
recomposed to have the same particle size distribution (PSD) as the RFA. 131
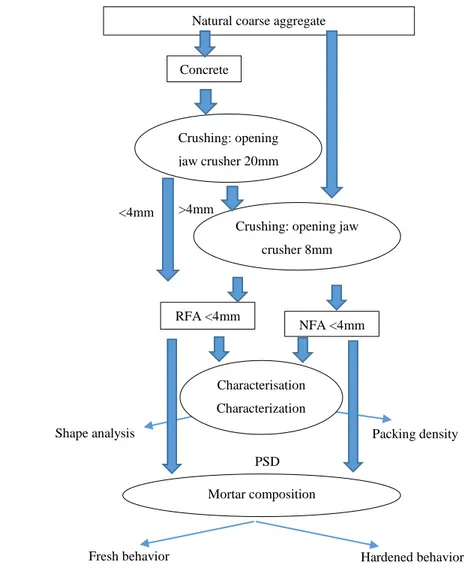
Fig. 1 shows the used procedure. The physical properties of RFA and NFA will be determined 132
and compared in order to verify if the fabrication procedure allows to produce two similar 133
aggregates (section 3). Then, mortars of identical composition will be produced with the two 134
sands and their rheological behavior will be compared in order to verify if the NFA can be 135
considered as a good model for the RFA (section 4). Finally, the compressive strengths of 136
mortars will be determined in order to assess the real effect of the substitution of NFA by RFA 137
on the mechanical behavior of mortars (section 5). 138 139 140 141 142 143 144 145 146 147 148 149 150 151 152 153 154 155 156 157 158
Fig. 1 Followed Methodology – preparation of aggregates – RFA = Recycled Fine Aggregates - NFA = Natural
159 Fine Aggregates 160 Shape analysis PSD Packing density
Fresh behavior Hardened behavior
Mortar composition RFA <4mm
NFA <4mm
Characterisation Characterization Natural coarse aggregate
Concrete
Crushing: opening jaw crusher 20mm
Crushing: opening jaw crusher 8mm >4mm <4mm 1 2 3 4 5 6 7 8 9 10 11 12 13 14 15 16 17 18 19 20 21 22 23 24 25 26 27 28 29 30 31 32 33 34 35 36 37 38 39 40 41 42 43 44 45 46 47 48 49 50 51 52 53 54 55 56 57 58 59 60 61
3. Characterisation of fine aggregate
161
3.1 Materials
162
A CEM I 52.5N cement from CBR Belgium, complying with standard EN 197-1 is used. The 163
density measured with Helium pycnometer is 3.11g/cm3 and the specific surface area measured
164
according to the standard EN 196-3 is 3800 cm²/g. Limestone aggregates 2/7mm, 7/14mm, and 165
14/20mm are provided by Carmeuse in Belgium. The natural sand 0/4mm is provided by 166
LOVEMAT in Belgium. These materials are used for manufacturing a laboratory concrete 167
which is then crushed for the production of RFA. Table 1 shows the concrete composition. The 168
latter has been designed in order to obtain a consistency class S3 and strength class C30/37. 169
The concrete slump measured according to NF EN 12350-2 is 129mm, and its 28 days 170
compressive strength measured on cubic specimen (15x15x15 cm) is 41MPa. 171
172
Table 1 Concrete composition used to prepare the RFA
173
174
The concrete is crushed with a jaw crusher after 90 days curing to insure a high level of 175
hydration; only the fraction smaller than 4mm is recovered. The crushing procedure is 176
performed in two steps: the first step uses an opening jaw crusher of 20mm, and the fraction 177
less than 4mm is recovered. The fraction above 4 mm is crushed a second time with an opening 178
jaw crusher of 8mm. After crushing, the 0/4 mm fraction is carefully homogenized. 179
A limestone aggregate 20/32mm from the same quarry than the aggregate use for manufacturing 180
the concrete (Carmeuse in Belgium) is crushed with an opening jaw crusher of 8mm. After that, 181
the limestone fine aggregate (LFA) is recomposed in order to have the same size distribution 182
than the RFA. 183
3.2 Shape analyses
184
The shape analyses are carried out with 2d images [28,29] and the measurement is performed 185
with the fraction larger than 250 µm for a mass of sample between 250 and 300 g. This test is 186
performed in order to identify the shape of particles, and to know if the preparation procedure 187
presented in Fig. 1 allows to have a similar shape between RFA and LFA. 188 CEM I (kg) Water (kg) Aggregate 2/7 (kg) Aggregate 7/14 (kg) Aggregate 14/20 (kg) Fine Aggregate (0/4) (kg) Superplasticizer (%) 350 175 216 658 436 612 0.4 1 2 3 4 5 6 7 8 9 10 11 12 13 14 15 16 17 18 19 20 21 22 23 24 25 26 27 28 29 30 31 32 33 34 35 36 37 38 39 40 41 42 43 44 45 46 47 48 49 50 51 52 53 54 55 56 57 58 59 60
The sample is gradually laid on a cover belt. Thanks to a camera and a source of light, each 189
particle is individually evaluated and parameters are calculated. In this work, between 100,000 190
and 200,000 particles are analyzed. Afterwards, length and width of each particle are recorded. 191
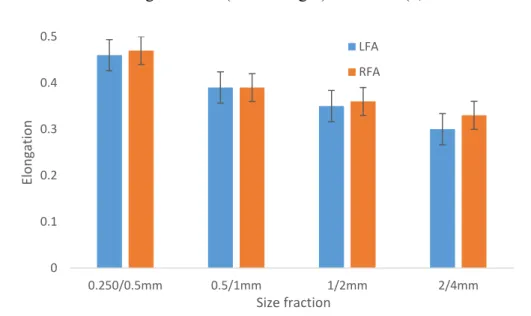
The morphology is expressed in terms of elongation. The elongation parameter is computed 192
with (Eq. 2). Fig. 2 shows the results obtained for RFA and LFA: no significant differences are 193
observed for the different size fractions. 194
Elongation = 1-(width/length)………… (2) 195
196
Fig. 2 Elongations for the different particle sizes of RFA and LFA
197
3.3 Water absorption and density
198
Three methods are investigated for the measurement of water absorption coefficient of RFA: 199
EN 1097-6 [30], IFSTTAR method N°78 [31] and extrapolation method [6]. 200
Using the standard EN 1097-6 or IFSTTAR method, water absorption is determined by 201
measuring the quantity of water present in the aggregate at saturated surface dry state (SSD). 202
Firstly, the aggregates are saturated with a certain amount of water for 24 hours. In EN 1097-203
6, in order to achieve SSD, the sample is exposed to a warm air flow for evaporating the water 204
present at the surface of particles. The SSD state is identified using a slump test. A cone is filled 205
in one time and compacted with 25 pestles shots. The SSD state is determined according to the 206
shape obtained after lifting the cone. In IFSTTAR method, for achieving SSD state, the sample 207
is dried progressively by using different colored absorbing papers until there is no more trace 208 of water. 209 0 0.1 0.2 0.3 0.4 0.5 0.250/0.5mm 0.5/1mm 1/2mm 2/4mm Elon gat ion Size fraction LFA RFA 1 2 3 4 5 6 7 8 9 10 11 12 13 14 15 16 17 18 19 20 21 22 23 24 25 26 27 28 29 30 31 32 33 34 35 36 37 38 39 40 41 42 43 44 45 46 47 48 49 50 51 52 53 54 55 56 57 58 59 60 61
In both methods, the mass of sample at SSD state is recorded (MSSD). Then the sample is dried
210
in an oven at 105°C until constant mass (Mdried). The water absorption (WA) is computed with
211
(Eq. 3). 212
WA= (MSSD-Mdried)/Mdried…………. (3)
213
Le et al.[32] have shown that the EN 1067-6 method underestimates the water absorption of the 214
finer granular fractions, whereas the IFSTTAR method overestimates it. The extrapolation 215
method developed by Zhao et al. [6] is therefore also used in this research. This method is based 216
on the relationship between the water absorption and the cement paste content. For determining 217
the water absorption, the sample is divided in different size classes and the adherent cement 218
paste content is measured for each size class. (Eq. 4) shows that there is a linear relationship 219
between the adherent cement paste content and the water absorption. Zhao showed that the 220
measurement of water absorption coefficient is possible only for coarser classes with standard 221
EN 1097-6 or IFSTTAR method (down to 0.5mm) [32]; the water absorption of the finer 222
fraction is then computed by extrapolation with (Eq.4). Knowing the proportion of each size 223
fraction of RFA, the water absorption of the whole 0/4 fraction can be determined. 224
WARFA=WAP XP+WANA(1-Xp)………..(4)
225
WARFA: water absorption coefficient of a given size class of RFA
226
WAp: water absorption coefficient of adherent cement paste
227
WANA: water absorption coefficient of natural aggregate in RFA
228
Xp: adherent cement paste content of a given class of RFA
229
In this study, the RFA is sorted into 6 size fractions: (<0.063mm, 0.063/0.125mm, 230
0.125/0.5mm, 0.5/1mm, 1/2mm, and 2/4mm). The water absorption coefficients of the size 231
fractions larger than 0.5mm are determined with IFSTTAR method: by extrapolation, the total 232
water absorption for RFA is then determined. Le et al. [32] showed that using EN 1097-6 or 233
IFSTTAR method lead to very close WA results for the fraction between 0.5/4mm. 234
In the extrapolation method, the adherent cement paste content can be estimated either by 235
soluble fraction in salicylic acid (SFSA) or mass loss (ML) between 105°C and 475°C both 236
methods are investigated here. 237
The SFSA is determined by immersing 0.5g of dry representative sample into a solution of 238
salicylic acid and methanol (14g of salicylic acid and 80 ml of methanol) during 1 hour to 239
dissolve the soluble phases of the cement paste. After that, the solution is filtered to obtain the 240
solid residue. This method is carried out on 2 samples of each granular fraction. 241 1 2 3 4 5 6 7 8 9 10 11 12 13 14 15 16 17 18 19 20 21 22 23 24 25 26 27 28 29 30 31 32 33 34 35 36 37 38 39 40 41 42 43 44 45 46 47 48 49 50 51 52 53 54 55 56 57 58 59 60
The mass loss between 105°C and 475°C is determined by (1) storing 10g of representative 242
samples for 24 hours in the oven at 105°C and weighing the sample (M105°C) (2) putting the
243
sample in the oven at 475°C for 24 hours and weighing the sample (M475°c). The mass loss is
244
computed with the (Eq. 5). 245
ML105°C-475°C = (M105°C-M475°C)/M105°C………(5)
246
In this research, the water absorption is determined under the three following different 247
absorption conditions. 248
- IM 24 hours: total immersion into water for 24 hours (porosity and real density are 249
computed with this saturation procedure corresponding to EN 1097-6); 250
- 7 days WA+5%: conservation in sealed bottle for 7 days with a quantity of water 251
equal to WA+5% of the mass of the sample 252
- 24 hours WA+5%: conservation in sealed bottle for 24 hours with a quantity of water 253
equal to WA+5% of the mass of the sample; 254
Le et al. [32] showed that conservation of RFA for 7 days in a sealed bottle with a quantity of 255
water equal to WA+5% allowed to saturate the RFA. 256
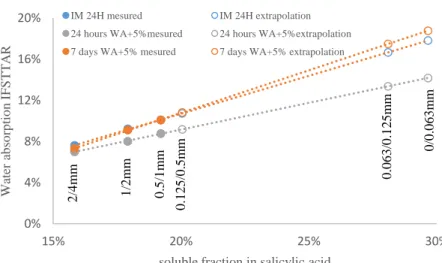
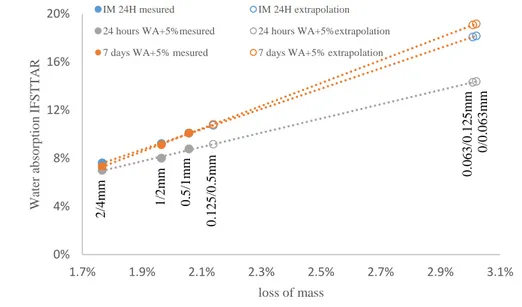
Fig. 3 and Fig. 4 show the variation of water absorption for each size fraction and for the 257
different moisture conditions, with the extrapolation method, using respectively the soluble 258
fraction in salicylic acid (SFSA) and mass loss (ML).The results show a linear relation between 259
the water absorption and the mass loss (ML) or the (SFSA). For the different fractions, there is 260
non-significant difference between the samples immersed in water and the one saturated with 261
WA+5% of the mass of the sample for 7 days. It can also be seen that the sample saturated with 262
WA+5% for 24 hours has a lower water absorption comparing to the two others. It also means 263
that, if the capillary rise is not complete after 24 hours, the saturation is completed after 7 days; 264
this result is similar to that presented by Le et al.[32]. 265 266 0% 4% 8% 12% 16% 20% 15% 20% 25% 30% W ater ab so rp ti o n IF S T T A R
soluble fraction in salicylic acid
IM 24H mesured IM 24H extrapolation 24 hours WA+5%mesured 24 hours WA+5%extrapolation 7 days WA+5% mesured 7 days WA+5% extrapolation
0 /0 .0 6 3 m m m 0 .0 6 3 /0 .1 2 5 m m 0 .1 2 5 /0 .5 m m 0 .5 /1 m m 1 /2 m m 2 /4 m m 1 2 3 4 5 6 7 8 9 10 11 12 13 14 15 16 17 18 19 20 21 22 23 24 25 26 27 28 29 30 31 32 33 34 35 36 37 38 39 40 41 42 43 44 45 46 47 48 49 50 51 52 53 54 55 56 57 58 59 60 61
Fig. 3 Extrapolation method with the soluble fraction in salicylic acid (SFSA)
267 268
269
Fig. 4 Extrapolation method with the mass loss (ML)
270
Table 2 shows the details of the different water absorption measurements. For the different 271
moisture conditions, the water absorption coefficient is very close when using ML and SFSA 272
for the extrapolation method. 273
Table 2 Water absorption for the different moisture condition of RFA
274
IM 24 HOURS 24 HOURS WA+5% 7 DAYS WA+5%
WA EN 1097-6 (%) 7.5 7.4 9.0 WA IFSTTAR (%) 10.8 10.4 12.6 WA IFSTTAR extrapolation SFSA (%) 9.7 8.4 9.6 WA IFSTTAR extrapolation LM (%) 9.8 8.5 9.7 275
Bordy et al.[33] showed that the residual anhydrous crushed paste, when in contact with water, 276
can harden and agglomerate. To verify if agglomeration of finer particles happens after 7 days 277
of conservation, the particle size distribution is measured after drying the material at 60°C until 278
constant mass. The PSD has changed a lot which can be due to the agglomeration of RFA pre-279
saturated for 7 days. This can certainly be attributed to anhydrous phases of RFA reacting with 280
water and changing the granular skeleton. Such a change in particle size distribution can affect 281
the workability of the mortar manufactured with this mode of saturation. 282 0% 4% 8% 12% 16% 20% 1.7% 1.9% 2.1% 2.3% 2.5% 2.7% 2.9% 3.1% W ater ab so rp ti o n IF S T T A R loss of mass IM 24H mesured IM 24H extrapolation 24 hours WA+5%mesured 24 hours WA+5%extrapolation 7 days WA+5% mesured 7 days WA+5% extrapolation
0 /0 .0 6 3 mm 0 .0 6 3 /0 .1 2 5 m m 2 /4 m m 0 .1 2 5 /0 .5 m m 0 .5 /1 m m 1 /2 m m 1 2 3 4 5 6 7 8 9 10 11 12 13 14 15 16 17 18 19 20 21 22 23 24 25 26 27 28 29 30 31 32 33 34 35 36 37 38 39 40 41 42 43 44 45 46 47 48 49 50 51 52 53 54 55 56 57 58 59 60
The WA of LFA is measured according to standard EN 1097-6. The value of absolute density 283
(ρab) is determined according to the standard EN 1097-6; the porosity (P) and real density (ρ)
284
are obtained with (Eq. 6) and (Eq. 7). 285 P = 𝑊𝑎𝑏𝑠 𝑊𝑎𝑏𝑠+𝜌𝑎𝑏1 ……… (6) 286 ρ= ρab× (1 − P)……….. (7) 287
The Apparent density and the water absorption measured for the samples immersed for 24h into 288
water for LFA are 2.69g/cm3 and 1% respectively. For the RFA, the extrapolation method is
289
used to compute the porosity and real density, the apparent density and real density for RFA 290
are respectively 2.4 and 1.94g/cm3.
291
3.4 Packing density
292
The packing density has an impact on the rheological behavior of mortar or concrete [24]. In 293
this research, same PSD and very close particle shape are obtained for RFA and LFA. These 294
two fine aggregates should therefore present similar packing densities. 295
The LCPC protocol [25] is carried out for the measurement of packing density (ϕm). This test
296
is realized by placing a dry sample of 7kg in a cylinder of 160mm of diameter and a height of 297
600mm fixed to a vibrating table. A flat piston of 20kg is placed on top of the cylinder to exert 298
a pressure of 10 KPa. The cylinder is vibrated for 1 minute, and the apparent volume after 299
vibration is measured. ϕm is computed with (Eq. 8) where ρapp is the apparent density measured
300
after the test and ρ is the real density presented in §3.3. 301
Packing density of RFA and LFA are 86% and 84%, respectively. In order to verify that the 302
measurement did not generate any fine particle, the PSD is also measured after the test. 303
ϕm = (ρapp) / (ρ) ……….(8)
304
The PSD analyses performed before and after the packing density test show a significant 305
increase in the quantity of fine particles. This is the reason why the value obtained with this 306
method is not taken into consideration. 307
The generation of fine particles is certainly due to the use of a weight of 20 kg and a vibration 308
of 1 minute. The same protocol is therefore reproduced without the weight of 20kg. The packing 309
density of RFA and LFA is in this case 80% and 75%, respectively. PSD analyses are carried 310
out after the measurement and show no generation of fine particles in this case. 311 1 2 3 4 5 6 7 8 9 10 11 12 13 14 15 16 17 18 19 20 21 22 23 24 25 26 27 28 29 30 31 32 33 34 35 36 37 38 39 40 41 42 43 44 45 46 47 48 49 50 51 52 53 54 55 56 57 58 59 60 61
Given the procedure used for the production of RFA and LFA, the physical envelop 312
characteristics of the two sands are very similar (same PSD, similar particle shape, close 313
packing density). 314
4. Rheological behavior of mortars
315
4.1 Mortar compositions
316
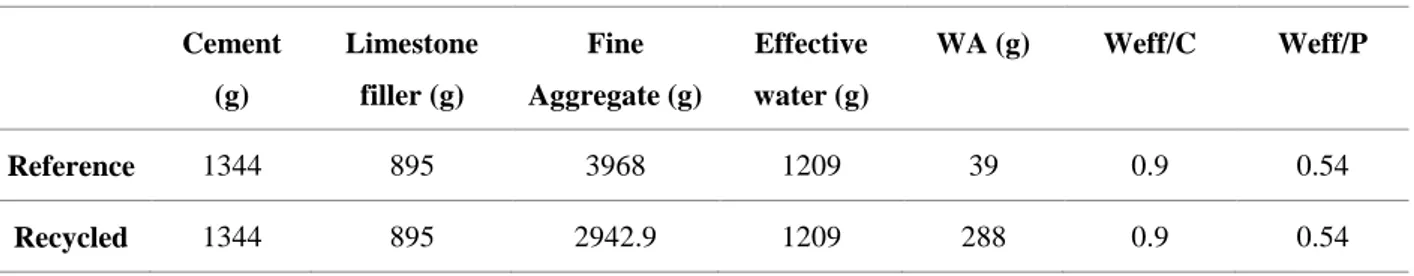
Table 3 presents the compositions of mortars with RFA and LFA. The cement used for the 317
manufacture of mortars is the same as the one used for the manufacture of concrete.A limestone 318
filler from Carmeuse in Belgium is also used. Its density measured with the helium pycnometer 319
is 2.72g/cm3 and its specific surface area according to the standard EN 196-3 is 3170 cm²/g. A 320
volumetric substitution of LFA by RFA is performed, and the same amount of efficient water 321
is used. The water quantity is computed by taking into consideration the water absorption after 322
total immersion in water of RFA or LFA. 323
Table 3 Mortar compositions for the investigation of fresh behavior
324
325
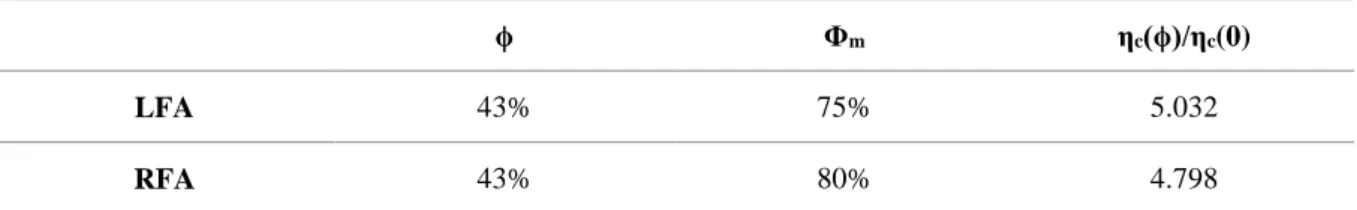
In order to justify whether the difference in packing densities showed in part 3 is significant for 326
the fresh behavior of mortars, the Krieger-Dougherty model is used (Eq. 1). Mehdipour and 327
Khayat [34] consider that the ϕm parameter for the application of Krieger-Dougherty model is
328
the packing densities obtained when using LCPC measurement. ϕm value for RFA and LFA are
329
given in part 3.4. 330
Table 4 presents the relative viscosities obtained with the Krieger-Dougherty model based on 331
the characterisation results and mortar compositions. As observed in Table 3, the solid volume 332
fraction of aggregates in the mortar (ϕ) is identical for RFA and LFA, but the packing densities 333
(ϕm) present a difference of 5%. A small difference is obtained for the relative viscosities
334
between mortars of LFA and RFA. 335
Due to the small differences between aggregate properties, and to the small difference obtained 336
for the predicted relative viscosities, the rheology of mortars made with saturated RFA and LFA 337
should be very close. 338 Cement (g) Limestone filler (g) Fine Aggregate (g) Effective water (g) WA (g) Weff/C Weff/P Reference 1344 895 3968 1209 39 0.9 0.54 Recycled 1344 895 2942.9 1209 288 0.9 0.54 1 2 3 4 5 6 7 8 9 10 11 12 13 14 15 16 17 18 19 20 21 22 23 24 25 26 27 28 29 30 31 32 33 34 35 36 37 38 39 40 41 42 43 44 45 46 47 48 49 50 51 52 53 54 55 56 57 58 59 60
Table 4 Comparison between the relative viscosities of RFA and LFA 339 ϕ Φm ηc(ϕ)/ηc(0) LFA 43% 75% 5.032 RFA 43% 80% 4.798 340
4.2 Pre-saturation conditions and mixing procedure
341
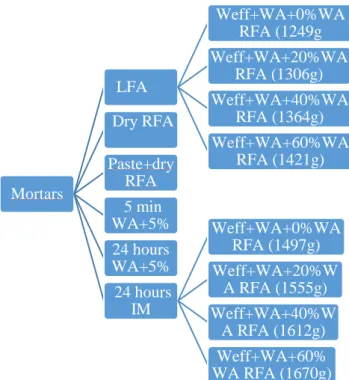
Different saturation states of RFA are studied. RFA is first dried at 60°C until a constant mass. 342
The mortars are then produced with 5 different pre-saturation conditions of RFA in order to 343
study the water movement between the paste and RFA: 344
- Dry RFA: first mixed with the powders and then the total water is added; 345
- Paste + dry RFA: preparation of the paste with water first then add the dry RFA; 346
- 5 min WA+5%: add to RFA a quantity of water equal to WA+5% for 5 minutes[35]; 347
- 24 hours WA+5% : add to RFA a quantity of water equal to WA+5% for 24 hours; 348
- 24 hours IM: add to RFA all the quantity of water for preparing the mortar (in order to 349
assure that all the particles are immersed in water). 350
The saturation is achieved by storing the fine aggregates with the amount of water needed in 351
watertight containers. The containers are conserved in air-conditioned room at 20°C. 352
The LFA is used after a saturation of WA+5% for 5 minutes, according to the protocol presented 353
by Schwartzentruber and Catherine [35]. 354
Complete immersion of RFA into water for 24 hours (24 hours IM) should allow for the 355
saturation of RFA and should prevent water movements in mortar. Other saturation modes 356
should lead to larger workabilities for mortars [32]. In order to quantify the effective water and 357
estimate the water absorption for a given moisture condition, quantities of water equal to 20, 358
40 and 60% of the water absorption of RFA, respectively, are added to the effective water in 359
mortars manufactured with saturated sand (24 hours IM). The same quantity of water was used 360
for mortars with LFA. Fig. 5 shows the procedure used to produce the different mortars. 361 1 2 3 4 5 6 7 8 9 10 11 12 13 14 15 16 17 18 19 20 21 22 23 24 25 26 27 28 29 30 31 32 33 34 35 36 37 38 39 40 41 42 43 44 45 46 47 48 49 50 51 52 53 54 55 56 57 58 59 60 61
362
Fig. 5 Mortars manufactured to study the water movements between RFA and cement paste. The total water
363
added in the mixes is put between brackets.
364
Cement, limestone powder, RFA, LFA and water are first stored at 20°C. Depending on the 365
way of saturation of RFA, cement, limestone powder, fine aggregate, and the total water are 366
mixed at a low speed for 90 seconds; 60 seconds of manual mixing are then following. Finally, 367
90 seconds of mixing at high speed are performed. 368
When dry RFA is used, the cement, limestone filler and water are added first and mixed for 60 369
seconds; the dry RFA is then added and another 60 seconds of mixing are performed. 60 seconds 370
of manual mixing are then following. Finally, 90 seconds of mixing a high speed are performed. 371
4.3 Fresh state properties
372
For each mortar, the apparent density, slump (H) and slump flow (D) are measured. All the tests 373
are performed three times to assure a good repeatability. The slump and slump flow tests are 374
performed with a mini cone whose upper diameter is 70mm, lower diameter is 100mm, and 375
height is 60mm. 376
In order to determine the yield stress, Roussel’s model is used [36]. To apply this model, the 377
slump radius should be larger than the height of the slump (D/2>H). The empirical yield stress 378
may then be computed with (Eq. 9). 379
Yield stress = 225ρ𝑔Ω
2
128𝜋2𝑅5…….. (9)
380
- : fresh apparent density of mortar (g/cm3) 381 Mortars LFA Weff+WA+0%WA RFA (1249g Weff+WA+20%WA RFA (1306g) Weff+WA+40%WA RFA (1364g) Weff+WA+60%WA RFA (1421g) Dry RFA Paste+dry RFA 5 min WA+5% 24 hours WA+5% 24 hours IM Weff+WA+0%WA RFA (1497g) Weff+WA+20%W A RFA (1555g) Weff+WA+40%W A RFA (1612g) Weff+WA+60% WA RFA (1670g) 1 2 3 4 5 6 7 8 9 10 11 12 13 14 15 16 17 18 19 20 21 22 23 24 25 26 27 28 29 30 31 32 33 34 35 36 37 38 39 40 41 42 43 44 45 46 47 48 49 50 51 52 53 54 55 56 57 58 59 60
- g : gravity 9.8m/s² 382
- Ω : volume of the mini cone (mm3) 383
- R : radius of the slump (mm) 384
4.4 Rheological behavior
385
Table 5 shows the apparent density, slump flow and yield stress calculated with Roussel’s 386
model. The mortar manufactured with immersed RFA has the closest results to the one 387
manufactured with LFA. The mortar made with RFA saturated with WA+5% for 24 hours 388
presents better workability than the one performed with immersed RFA. This result confirms 389
that conservation of RFA with WA+5% for 24 hours does not allow reaching complete 390
saturation. Referring to the water absorption (Table 2), a difference of 1.3% is observed 391
between this saturation condition and total immersion in water of RFA: this may explain the 392
improvement of workability observed for the mortar made with RFA with WA+5% saturated 393
for 24 hours. 394
Using RFA in dry condition or saturated with WA+5% for 5 minutes gives similar behaviors in 395
the fresh state and leads to the highest workability. This result is due to the incomplete 396
absorption of water by dry fine aggregate (or fine aggregate saturated only for 5 minutes) which 397
leads to maximal amount of effective water for fluidizing the mixture. Adding the RFA in dry 398
condition in the paste gives a lower workability than in the two previous conditions. 399
Table 5 Fresh properties of the mortars
400
Density (g/cm3) Slump Flow (mm) Yield stress Roussel’s model (Pa)
LFA 2.22 163 124
Dry RFA 1.88 210 32.1
Paste +dry RFA 1.88 193 47.7
5 min WA+5% 1.87 205 34.1
24 hours + WA+5% 1.92 172 79.3
24 hours IM 1.95 158 130
401
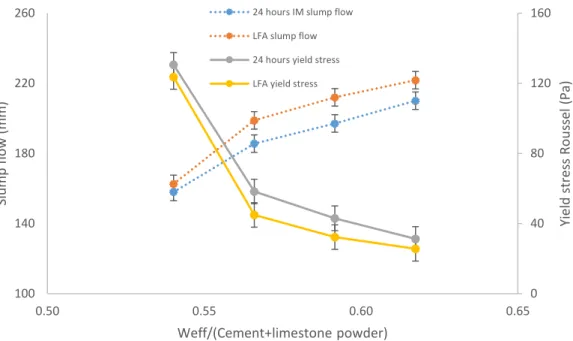
Fig. 6 shows the variations of slump flow and yield stress of mortars made with LFA and RFA 402
after total immersion in water as a function of the efficient water to powder ratio. It is observed 403
that there is only a small difference (in yield stress and slump flow) between the mortars made 404
with LFA and RFA immersed in water. 405 406 1 2 3 4 5 6 7 8 9 10 11 12 13 14 15 16 17 18 19 20 21 22 23 24 25 26 27 28 29 30 31 32 33 34 35 36 37 38 39 40 41 42 43 44 45 46 47 48 49 50 51 52 53 54 55 56 57 58 59 60 61
407
Fig. 6 Workability of the mortar manufactured with LFA and RFA immersed in water for 24 hours
408
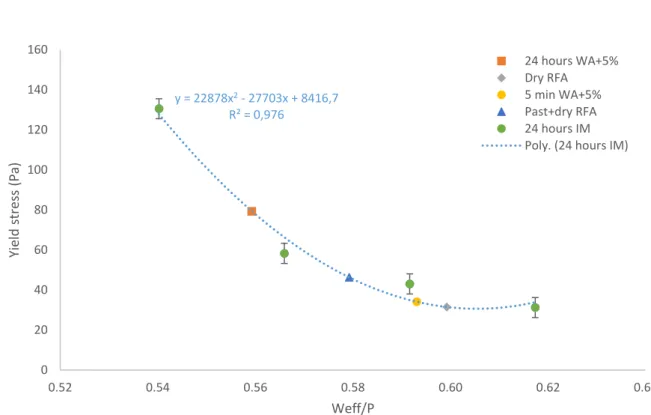
Fig. 7 shows the yield stress measured with Roussel’s model as a function of the water in excess. 409
Adding 20, 40, and 60% of the RFA water absorption quantity allows computing the percentage 410
of excess water for the different moisture conditions. 411
Previous studies show an exponential decrease of yield stress when the W/C increases in the 412
case of pure cement paste [37,38]. In our work, using a parabolic equation gives better 413
regression than using an exponential trend, which may be due to the fact that mortar is used and 414
not a pure paste. Yield stresses obtained with Roussel’s model presented in Table 5 are used in 415
order to compute the water in excess and then the water absorption for each moisture 416
condition[39]. 417
The mortar made with RFA saturated with WA+5% for 24 hours presents a yield stress of 79Pa. 418
Based on this result, the water absorption can be computed with the parabolic relation and 419
corresponds to 8.33%. The water absorption presented in Table 2, with a saturation state of 420
WA+5% for 24 hours, shows a similar value which means that the water absorption kinetics 421
are identical for the two tests. This result validates the fact that the rheological study can be 422
used for computing the water absorbed in the different states of moisture. 423
The use of RFA in dry conditions or after 5 minutes of saturation gives close yield stresses. 424
Based on these values, the water absorption calculated is 5.3% and 5.7%, respectively. The 425
saturation degree which is the ratio of the water absorbed and the standard water absorption 426
(WA, Table 2) is around 54%. 427
Adding dry RFA to the paste leads to a smaller yield stress; the water absorbed calculated for 428 0 40 80 120 160 100 140 180 220 260 0.50 0.55 0.60 0.65 Yie ld s tres s Rou ss el (Pa) Slump flow (m m ) Weff/(Cement+limestone powder) 24 hours IM slump flow LFA slump flow 24 hours yield stress LFA yield stress
1 2 3 4 5 6 7 8 9 10 11 12 13 14 15 16 17 18 19 20 21 22 23 24 25 26 27 28 29 30 31 32 33 34 35 36 37 38 39 40 41 42 43 44 45 46 47 48 49 50 51 52 53 54 55 56 57 58 59 60
condition, RFA absorbs more water than when it is added with the powder and water. Maimouni 430
et al. [39] showed that, after 5 minutes of mixing, the degree of saturation of dry RFA in cement 431
paste with W/C ratio equal to 0.5 is around 70%: this result is similar to the result obtained for 432
the mortar made with RFA in the same condition. 433
434
Fig. 7 Measure of yield stress as a function of Weff/P ratio for the different mortars with RFA in different
435
moisture conditions
436
5. Mechanical behavior of mortars
437
Zhao et al. [40] showed that the state of moisture influences the interface between the new and 438
old cement paste, the difference having an impact on the mechanical strength. These authors 439
found that using RFA in dry condition leads to better mechanical properties. However, in a 440
similar research Le et al. [41] found no significant difference between the compressive strengths 441
of mortars made either with dry or saturated RFA. In order to better understand the influence 442
of moisture state of RFA on the compressive strength of mortars, different specimen are 443
manufactured with dry or saturated RFA and compared with mortar made with model LFA. 444
Compressive strengths are measured on mortars with RFA and LFA. Prismatic specimens 445
(40mm X 40mm X 160mm) are prepared according to standard EN 196-1. The flexural and 446
compressive strengths are measured according to standard EN 196-1. 447
Table 6 shows the mortar compositions. For the different mixes, the effective water content - + 448
0%, 40% and 60% of the water absorption after a total immersion into water of RFA - is 449 y = 22878x2- 27703x + 8416,7 R² = 0,976 0 20 40 60 80 100 120 140 160 0.52 0.54 0.56 0.58 0.60 0.62 0.64 Yie ld s tres s (Pa) Weff/P 24 hours WA+5% Dry RFA 5 min WA+5% Past+dry RFA 24 hours IM Poly. (24 hours IM)
1 2 3 4 5 6 7 8 9 10 11 12 13 14 15 16 17 18 19 20 21 22 23 24 25 26 27 28 29 30 31 32 33 34 35 36 37 38 39 40 41 42 43 44 45 46 47 48 49 50 51 52 53 54 55 56 57 58 59 60 61
considered. The fresh behavior study made in section 4 allows knowing the water absorbed for 450
the different moisture conditions. In order to assure the same efficient water for the different 451
mortars, the water absorbed by RFA in dry or in total immersion is taken into consideration in 452
the water mixes. The water absorption considered in the mortar composition with RFA used in 453
dry condition is equal to 5.3%, and equal to 9.8% for immersed RFA as shown in Table 6. 454
Table 6 Mortar compositions for the evaluation of mechanical performances
455 Cement (g) Limestone filler (g) Fine aggregate (g) Effective water (g) Absorbed water Weff/ (Cement+limestone filler) LFA 0% 1344 895 3968 1 209 39.7 0.54 LFA 40% 1344 895 3968 1 325 39.7 0.59 LFA 60% 1344 895 3968 1 382 39.7 0.62 DRY RFA 0% 1344 895 2943 1 209 156 0.54 DRY RFA 40% 1344 895 2943 1 325 156 0.59 DRY RFA 60% 1344 895 2943 1 382 156 0.62 24 hours IM 0% 1344 895 2943 1 209 288 0.54 24 hours IM 40% 1344 895 2943 1 325 288 0.59 24 hours IM 60% 1344 895 2943 1 382 288 0.62 456
According to De Larrard [42], the compressive strength of concrete or mortars is related to the 457
compressive strength of cement matrix and is given by (Eq. 10). 458
Rc= 𝑝×𝑅𝑐𝑚
𝑞×𝑅𝑐𝑚+1……….(10)
459
Rcm: compressive strength of the cement matrix
460
Rc: compressive strength of mortar
461
p: adhesion quality between the aggregate and cement matrix 462
p/q: characterize the ceiling effect which the limiting effect of the aggregate on the 463
mechanical behavior of the mortar or concrete. 464
The compressive strength of the cement matrix is computed by (Eq. 11). 465 Rcm= 13.4×Rc28×( 𝑉𝑝 𝑉𝑝+𝑉𝑤+𝑉𝑎)2.85×MPT -0.13…………..(11) 466
Rc28: represents the compressive strength of the standard mortar made with cement and
467
limestone powder with the same proportion as showed in Table 3 at 28 days. 468
Vp, Vw, V𝑎: represent the volume of powder, water and air. The volume of air is 469
measured with air content CONTROLS/1L. 470 1 2 3 4 5 6 7 8 9 10 11 12 13 14 15 16 17 18 19 20 21 22 23 24 25 26 27 28 29 30 31 32 33 34 35 36 37 38 39 40 41 42 43 44 45 46 47 48 49 50 51 52 53 54 55 56 57 58 59 60
MPT: the maximum paste thickness between two close aggregates computed from 471 (Eq. 12). 472 MPT= Dmax×(√ 𝑔∗ 𝑔 3 − 1)…………..(12) 473
Dmax: maximal size of aggregate
474
g: the aggregate volume for a unit volume of mortar. 475
g*: the granular packing density, computed with eq (Eq. 13). 476
g*=1-0.45×(𝑑𝑚𝑖𝑛 𝑑𝑚𝑎𝑥)
0.19…………..(13)
477
dmin: diameter corresponding to 10% passing.
478
dmax: diameter corresponding to 90% passing.
479
According to De Larrard [42], for high matrix strengths, the mortar strength is equal to Rc=p/q;
480
but for low matrix strengths, it is equal to Rc=p×Rcm. In this work, a high W/P ratio is used to
481
allow for a total immersion of RFA in water during the saturation phase. This high W/P ratio 482
leads to low matrix strengths. This is consequently mainly the adherent parameter (p) and its 483
effect on the mechanical resistance which are of interest here. 484
Table 7 presents the compressive strength of the different mortars. Mortars with LFA showed 485
a higher compressive strength than those made with RFA, whatever their saturation state. Also, 486
the compressive strength of the mortar made with dry RFA is larger than that of the mortar 487
made with saturated RFA. The air content was higher for RFA mortars than LFA mortars. 488
Moreover, the air content is larger in the mortar made with dry RFA than in the mortar with 489
saturated RFA. The larger air contents of mortars made with RFA in comparison to those made 490
with LFA can certainly be attributed to differences in surface rugosity of particles, probably 491
larger for RFA than for LFA. The larger air content of mortars made with dry RFA in 492
comparison to saturated RFA is certainly due to the air present in the non-saturated particles. 493
In section 4, a difference of 4.5% of WA is observed between the saturated and dry RFA. This 494
difference in water absorption could increase the air content in mortars made with dry RFA by 495
3.5%. According to the air contents presented in Table 7, a difference of 2.5% is obtained 496
between the mortar made with dry RFA and saturated RFA. This result confirms that the 497
increase in air content for mortars made with dry RFA is due to the air still present in the pores 498
which are not filed with water. So, for the application of the De Larrard model [42], the same 499
air content for the matrix of the mortar made with saturated RFA is going to be used for the 500
mortar made with dry RFA. 501 1 2 3 4 5 6 7 8 9 10 11 12 13 14 15 16 17 18 19 20 21 22 23 24 25 26 27 28 29 30 31 32 33 34 35 36 37 38 39 40 41 42 43 44 45 46 47 48 49 50 51 52 53 54 55 56 57 58 59 60 61
Table 7 Compressive strength of mortars, and details for the investigation of the “ceiling effect”
502
LFA RFA dry IM 24H RFA
Weff/P 0.54 0.59 0.62 0.54 0.59 0.62 0.54 0.59 0.62 Vair/Vtotal in mortar (%) 1 1 1 7 7 7 4.5 4.5 4.5 Vair in paste /Vtotal (%) 1 1 1 4.5 4.5 4.5 4.5 4.5 4.5 g 0.43 0.42 0.41 0.41 0.39 0.39 0.42 0.40 0.40 g* 0.76 0.76 0.76 0.76 0.76 0.76 0.76 0.76 0.76 MPT 0.68 0.73 0.75 0.76 0.80 0.83 0.73 0.77 0.79 Rc28(MPa) 25.03 25.03 25.03 25.03 25.03 25.03 25.03 25.03 25.03 Rcm(MPa) 22.34 18.88 17.42 18.73 15.90 14.69 18.73 15.90 14.69 Rc(MPa) 26.99 24.42 20.29 17.37 15.55 14.89 14.35 13.03 10.34 p 1.222 0.948 0.766 503
As explained above, the De Larrard model is presented only with the p parameter because of 504
the low cement matrix. The adhesion between LFA and paste is better than the one between 505
RFA and paste. Using RFA in dry condition allows for a better adhesion than when saturated. 506
This result is in accordance with the study of Zhao et al. [40] 507
Higher compressive strengths obtained for mortars with LFA than for mortars with RFA can 508
therefore be attributed to two parameters: a higher air content in the paste of mortars made with 509
RFA comparing to the one made with LFA and a better adhesion between the LFA and new 510 paste. 511 512
6. Conclusions
513As this is very difficult to study the real effect of substitution, a natural by a recycled fine 514
aggregate, an original method has been proposed for preparing a natural model aggregates and 515
comparing it with recycled one. Specific physical characterisation carried out on both 516
aggregates shows that they present very similar granular characteristics (particle size 517
distribution, elongation, and packing density). Comparison of mortars made with LFA and 518
saturated RFA shows that these two mortars present very close fresh state properties, showing 519
that LFA is a good natural model aggregate for a rigorous comparison with RFA. 520 1 2 3 4 5 6 7 8 9 10 11 12 13 14 15 16 17 18 19 20 21 22 23 24 25 26 27 28 29 30 31 32 33 34 35 36 37 38 39 40 41 42 43 44 45 46 47 48 49 50 51 52 53 54 55 56 57 58 59 60
Using the two previous aggregates, mechanical properties of mortars made with RFA in various 521
saturation conditions are compared to those of mortars made with LFA of identical composition 522
(same Weff/C ratio and same paste volume). Results show that the compressive strengths of
523
mortars made with LFA are systematically larger than those of corresponding mortars made 524
with RFA. The lower compressive strengths can be attributed to a lower quality of the bond 525
between aggregates and cement matrix and to a larger air content in mortars made with RFA. 526
Results also show that mortars containing saturated RFA present lower air contents than those 527
with dry RFA, because of the air contained in non-filled voids of aggregates in the latter. 528
However, the compressive strengths of mortars made with dry RFA are systematically larger 529
than those of saturated RFA, because of a better adhesion between aggregates and cement 530
matrix. 531
Acknowledgment
532
This research work has been carried out in the frame of the VALDEM project (convention n°1.1.57 of Interreg
533
France-Wallonie-Vlaanderen 2014-2020), partly financed by the European Regional Development Funds and
534
Wallonia.
535
Conflict of interest
536
The authors declare that they have no conflict of interest. 537
References
538
[1] R. PN, “Complete recycling of concrete,” 2012. [Online]. Available: http://www.pnrecybeton.fr/.
539
[2] FEREDECO, “Guide pour l ’ utilisation des granulats recyclés en Wallonie,” 2016.
540
[3] F. Rodrigues, M. T. Carvalho, L. Evangelista, and J. De Brito, “Physical-chemical and mineralogical
541
characterization of fine aggregates from construction and demolition waste recycling plants,” J. Clean.
542
Prod., vol. 52, pp. 438–445, 2013.
543
[4] M. S. de Juan and P. A. Gutiérrez, “Study on the influence of attached mortar content on the properties
544
of recycled concrete aggregate,” Constr. Build. Mater., vol. 23, no. 2, pp. 872–877, 2009.
545
[5] F. Delobel, D. Bulteel, J. M. Mechling, A. Lecomte, M. Cyr, and S. Rémond, “Application of ASR tests
546
to recycled concrete aggregates: Influence of water absorption,” Constr. Build. Mater., vol. 124, pp.
547
714–721, 2016.
548
[6] Z. Zhao, S. Remond, D. Damidot, and W. Xu, “Influence of hardened cement paste content on the water
549
absorption of fine recycled concrete aggregates,” J. Sustain. Cem. Mater., vol. 2, no. 3–4, pp. 186–203,
550
2013.
551
[7] Z. Zhao, L. Courard, F. Michel, and S. Remond, “Influence of granular fraction and origin of recycled
552 1 2 3 4 5 6 7 8 9 10 11 12 13 14 15 16 17 18 19 20 21 22 23 24 25 26 27 28 29 30 31 32 33 34 35 36 37 38 39 40 41 42 43 44 45 46 47 48 49 50 51 52 53 54 55 56 57 58 59 60 61
concrete aggregates on their properties,” Eur. J. Environ. Civ. Eng., vol. 8189, no. March, p. 0, 2017.
553
[8] Z. J. Grdic, G. A. Toplicic-Curcic, I. M. Despotovic, and N. S. Ristic, “Properties of self-compacting
554
concrete prepared with coarse recycled concrete aggregate,” Constr. Build. Mater., vol. 24, no. 7, pp.
555
1129–1133, 2010.
556
[9] K. Kapoor, S. P. Singh, and B. Singh, “Durability of self-compacting concrete made with Recycled
557
Concrete Aggregates and mineral admixtures,” Constr. Build. Mater., vol. 128, pp. 67–76, 2016.
558
[10] L. Oksri-Nelfia, P. Mahieux, O. Amiri, P. Turcry, and J. Lux, “Reuse of recycled crushed concrete fines
559
as mineral addition in cementitious materials,” Mater. Struct., vol. 49, no. 8, pp. 3239–3251, 2016.
560
[11] C. Diliberto, A. Lecomte, J.-M. Mechling, L. Izoret, and A. Smith, “Valorisation of recycled concrete
561
sands in cement raw meal for cement production,” Mater. Struct., vol. 50, no. 2, p. 127, 2017.
562
[12] M. Braga, J. De Brito, and R. Veiga, “Incorporation of fine concrete aggregates in mortars,” Constr.
563
Build. Mater., vol. 36, pp. 960–968, 2012.
564
[13] C. Neno, J. de Brito, and R. Veiga, “Using fine recycled concrete aggregate for mortar production,”
565
Mater. Res., vol. 17, no. 1, pp. 168–177, 2014.
566
[14] I. Vegas, I. Azkarate, A. Juarrero, and M. Frías, “Design and performance of masonry mortars made with
567
recycled concrete aggregates,” Mater. Construcción, vol. 59, no. 295, pp. 5–18, 2009.
568
[15] D. Pedro, J. de Brito, and L. Evangelista, “Structural concrete with simultaneous incorporation of fine
569
and coarse recycled concrete aggregates: Mechanical, durability and long-term properties,” Constr.
570
Build. Mater., vol. 154, pp. 294–309, 2017.
571
[16] D. Carro-Lopez, B. Gonzallez-Fonteboa, F. Martinez-Abella, I. Gonzallez-Taboada, J. De Brito, and F.
572
Varela-Puga, “Proportioning, Microstructure and Fresh Properties of Self-compacting Concrete with
573
Recycled Sand,” Procedia Eng., vol. 171, pp. 645–657, 2017.
574
[17] S. Omary, E. Ghorbel, G. Wardeh and D. Nguyen, “Mix Design and Recycled Aggregates Effects on the
575
Concrete’s Properties,” Int. J. Civ. Eng., 2017.
576
[18] C. C. Fan, R. Huang, H. Hwang, and S. J. Chao, “Properties of concrete incorporating fine recycled
577
aggregates from crushed concrete wastes,” Constr. Build. Mater., vol. 112, pp. 708–715, 2016.
578
[19] J. Hu, Z. Wang, and Y. Kim, “Feasibility study of using fine recycled concrete aggregate in producing
579
self-consolidation concrete,” J. Sustain. Cem. Mater., vol. 2, no. 1, pp. 20–34, 2013.
580
[20] B. M. Vinay Kumar, H. Ananthan, and K. V. A. Balaji, “Experimental studies on utilization of coarse
581
and finer fractions of recycled concrete aggregates in self compacting concrete mixes,” J. Build. Eng.,
582
vol. 9, no. December 2016, pp. 100–108, 2017.
583
[21] M. Omrane, S. Kenai, E. Kadri, and A. Aït-mokhtar, “Performance and durability of self compacting
584
concrete using recycled concrete aggregates and natural pozzolan,” Clean. Prod., vol. 165, pp. 415–430,
585
2017.
586
[22] S. C. Kou and C. S. Poon, “Properties of self-compacting concrete prepared with coarse and fine
587
recycled concrete aggregates,” Cem. Concr. Compos., vol. 31, no. 9, pp. 622–627, 2009.
588
[23] D. Carro-López, B. González-Fonteboa, J. De Brito, F. Martínez-Abella, I. González-Taboada, and P.
589
Silva, “Study of the rheology of self-compacting concrete with fine recycled concrete aggregates,”
590
Constr. Build. Mater., vol. 96, pp. 491–501, 2015.
591
[24] I. M. Krieger and T. J. Dougherty, “A Mechanism for Non-Newtonian Flow in Suspensions of Rigid
592 1 2 3 4 5 6 7 8 9 10 11 12 13 14 15 16 17 18 19 20 21 22 23 24 25 26 27 28 29 30 31 32 33 34 35 36 37 38 39 40 41 42 43 44 45 46 47 48 49 50 51 52 53 54 55 56 57 58 59 60
Spheres,” Trans. Soc. Rheol., vol. 3, pp. 137–152, 1959.
593
[25] F. De Larrard, “Structures granulaires et formulation des bétons,” Etudes Rech. des Lab. des ponts
594
chaussées, vol. OA 34, p. 414 p., 2000.
595
[26] A. Lecomte, “The Measurement of Real and Virtual Packing Density of Soft Grains,” Mater. Struct., vol.
596
39, no. 1, pp. 63–80, 2007.
597
[27] K. H. Khayat and A. F. Omran, “Evaluation of SCC Formwork Pressure,” Concr. InFocus, no. june, pp.
598
16–21, 2009.
599
[28] R. Cepuritis, S. Jacobsen, S. Smeplass, E. Mørtsell, B. J. Wigum, and S. Ng, “Influence of crushed
600
aggregate fines with micro-proportioned particle size distributions on rheology of cement paste,” Cem.
601
Concr. Compos., vol. 80, pp. 64–79, 2017.
602
[29] H. Huan, L. Courard, E. PIrard, and Fr. MIchel, “SHAPE ANALYSIS OF FINE AGGREGATES USED
603
FOR CONCRETE,” Image Anal Stereol, pp. 159–166, 2016.
604
[30] E. 1097-6, “Tests for mechanical and physical properties of aggregates – Part 6: Determination of
605
particle density and water absorption .,” 2013.
606
[31] IFSTTAR. Test Methode No.78, “Tests on granulats in concrte: measurment of total water absorption of
607
crushed sand,” 2011.
608
[32] T. Le, S. Rémond, G. Le Saout, and E. Garcia-Diaz, “Fresh behavior of mortar based on recycled sand -
609
Influence of moisture condition,” Constr. Build. Mater., vol. 106, pp. 35–42, 2016.
610
[33] A. Bordy, A. Younsi, S. Aggoun, and B. Fiorio, “Cement substitution by a recycled cement paste fine:
611
Role of the residual anhydrous clinker,” Constr. Build. Mater., vol. 132, pp. 1–8, 2017.
612
[34] I. Mehdipour and K. H. Khayat, “Understanding the role of particle packing characteristics in
rheo-613
physical properties of cementitious suspensions: A literature review,” Constr. Build. Mater., vol. 161,
614
no. December 2017, pp. 340–353, 2018.
615
[35] A. Schwartzentruber and C. Catherine, “La mdthode du mortier de bdton quivalent ( MBE ) - Un nouvel
616
outil d'aide à la formulation des bdtons adjuvantds,” Mater. Struct., vol. 33, no. October, pp. 475–482,
617
2000.
618
[36] N. Roussel and P. Coussot, “‘Fifty-cent rheometer’ for yield stress measurements: From slump to
619
spreading flow,” J. Rheol. (N. Y. N. Y)., vol. 49, no. 3, pp. 705–718, 2005.
620
[37] M. Fourmentin et al., “NMR observation of water transfer between a cement paste and a porous
621
medium,” Cem. Concr. Res., vol. 95, pp. 56–64, 2017.
622
[38] V. H. Nguyen, S. Remond, and J. L. Gallias, “Influence of cement grouts composition on the rheological
623
behaviour,” Cem. Concr. Res., vol. 41, no. 3, pp. 292–300, 2011.
624
[39] H. Maimouni, S. Remond, F. Huchet, P. Richard, and V. Thiery, “Quantitative assessment of the
625
saturation degree of model fine recycled concrete aggregates immersed in a filler or cement paste,”
626
Constr. Build. Mater., vol. 175, pp. 496–507, 2018.
627
[40] Z. Zhao, S. Remond, D. Damidot, and W. Xu, “Influence of fine recycled concrete aggregates on the
628
properties of mortars,” Constr. Build. Mater., vol. 81, pp. 179–186, 2015.
629
[41] T. Le, G. Le Saout, E. Garcia-Diaz, D. Betrancourt, and S. Rémond, “Hardened behavior of mortar based
630
on recycled aggregate: Influence of saturation state at macro- and microscopic scales,” Constr. Build.
631 Mater., vol. 141, pp. 479–490, 2017. 632 1 2 3 4 5 6 7 8 9 10 11 12 13 14 15 16 17 18 19 20 21 22 23 24 25 26 27 28 29 30 31 32 33 34 35 36 37 38 39 40 41 42 43 44 45 46 47 48 49 50 51 52 53 54 55 56 57 58 59 60 61
[42] A. de Larrard, F. Belloc, “The influence of Aggregate on the compressive Streght of Normal-and
hight-633
Stregth Concrete,” ACI Mater. J., vol. 99, no. 5, 1997.
634 635 1 2 3 4 5 6 7 8 9 10 11 12 13 14 15 16 17 18 19 20 21 22 23 24 25 26 27 28 29 30 31 32 33 34 35 36 37 38 39 40 41 42 43 44 45 46 47 48 49 50 51 52 53 54 55 56 57 58 59 60