HAL Id: insu-01645044
https://hal-insu.archives-ouvertes.fr/insu-01645044
Submitted on 22 Nov 2017
HAL is a multi-disciplinary open access
archive for the deposit and dissemination of
sci-entific research documents, whether they are
pub-lished or not. The documents may come from
teaching and research institutions in France or
abroad, or from public or private research centers.
L’archive ouverte pluridisciplinaire HAL, est
destinée au dépôt et à la diffusion de documents
scientifiques de niveau recherche, publiés ou non,
émanant des établissements d’enseignement et de
recherche français ou étrangers, des laboratoires
publics ou privés.
Daniel Coelho, Slimane Bekki, Jean-François Thovert, Pierre Marie Adler
To cite this version:
Daniel Coelho, Slimane Bekki, Jean-François Thovert, Pierre Marie Adler. Uptake on fractal particles
1. Theoretical framework. Journal of Geophysical Research: Atmospheres, American Geophysical
Union, 2000, 105 (D3), pp.3905-3916. �10.1029/1999JD900815�. �insu-01645044�
JOURNAL
OF GEOPHYSICAL
RESEARCH,
VOL.
105,
NO.
D3,
PAGES
3905-3916,
FEBRUARY
16,
2000
Uptake on fractal particles
1. Theoretical
framework
Daniel Coelho,
1 Slimane
Bekki,
Pierre M. Adler I2 Jean-Francois
Thovert,
3 and
Abstract. We develop a detailed flamework for calculating uptake rates of gases on fractal particles. Aggregates with a fractal dimension between 1.6 and 2.6 are generated numerically. Three-dimensional simulations of uptake on these aggregates are performed for a large range of conditions. The numerical results can be expressed
by a single
physically
based
formula as a function of the usual parameters
(gas phase
diffusion
coefficient,
uptake coefficient)
and of morphological
parameters
(aggregate
gyration radius, size of the monomers
composing
the aggregate,
fractal dimension).
The expression for the uptake flux on an aggregate is generalized to a lognormal distribution of aggregates. The results for an isolated aggregate are compared to calculations used for spherical particles. The importance of accounting for the fractal character of aggregates in the calculation of the uptake flux is highlighted. The magnitude of the errors also depends on which aggregate equivalent size is usedas the characteristic radius for mass transfer.
1. Introduction
Carbonaceous aerosols produced by combustion pro- cesses, also called smoke or soot, often consist of ag-
gregates which are composed of numerous elementary particles or monomers. These aggregates exhibit a
self-similar structure which implies a fractal morphol- ogy in that the number of monomers and the radius
of gyration of the aggregate are 1inked by a power
law relationship [Forrest and Witten, 1979; Mandelbrot, 1982; Schmidt-Oft, 1988; Meakin, 1991]. Carbonaceous
aerosols are found throughout the lower atmosphere with biomass burning and fossil fuel combustion being
the main sources in the troposphere [Penner et al., 1993; Cooke and Wilson, 1996]. They have long been recog-
nized as a major local pollutant in urban areas. They are also considered as a significant contributor to cli- mate forcing because they strongly absorb solar radia-
tion and may act as cloud condensation nuclei [Haywood
and Shine, 1995; Intergovernmental Panel on Climate
Change, 1996; Schult et al., 1997]. Finally, by inter-
acting with gaseous chemical species, they may play a
Xlnstitut de Physique du Globe de Paris, Paris.
2Service d'Ag•ronomie du Centre National de la Recherche Sci- entifique, Universit(• P. et M. Curie, Paris.
3Laboratoire des Ph•nomsnes de Transport dans les M•langes,
Futuroscope, •rance.
Copyright 2000 by the American Geophysical Union.
Paper number 19993D900815.
0148-0227 / 00 / 1999 J D900815509.00
significant
role in atmospheric
chemistry
[Pueschel
et
al., 1992; Blake and Karo, 1995].Uptake processes on carbonaceous aerosols have been
increasingly studied recently. Atmospheric measure- ments indicate that water uptake on aircraft-generated carbonaceous aerosols might contribute to contrail and
cloud formation [Karcher et al., 1996; Minnis et al.,
1998;
Strom and Ohlsson,
1998]. Cloud
nucleating
prop-
erties and water uptake on carbonaceous material are
also actively investigated
in laboratory [Lainreel
and
Novakov, 1995; Chughtai et al., 1996; Weingartner et al., 1997]. In addition, chemical observations combined with modeling studies suggest that uptake, reactive ornot, of certain gases on carbonaceous aerosols could
influence the nitrogen and ozone budget in the tro-
posphere
and lower stratosphere
[$myth et al., 1996;
Jacob et al., 1996; Hauglustaine
et al., 1996; Lary et
al., 1997; Bekki, 1997; Aumont et al., 1999; Lary et
al., 1999].
Several
laboratory
experiments
have
already
been devoted to the determination of the uptake coef-
ficients
[Tabor et al., 1994; Fendel
et al., 1995; Smith
and Chughtai, 1996; Rogaski et al., 1997; Kalberer etal., 1996; Atomann et al., 1998]. Interestingly,
uptake
of chemical
species
such as ozone alters the physico-
chemical
properties
of the carbonaceous
surfaces
and,
consequently, influences the water uptake properties[ Vartiainen
et al., 1996;
Kotzick
et al., 1997].
This un-
derlines the link between heterogeneous chemical reac- tivity and cloud nucleating properties of carbonaceous
aerosols.
Most of these laboratory and modeling studies would probably benefit from a rigorous framework for calcu-
lating mass transfers and uptake rates on fractal mate- 3905
rial (S.G. Jennings et al., Carbonaceous aerosol fractal
surface area: Implications for heterogeneous chemistry,
submitted to Geophysical Research Letters, 1999). The
uptake rate depends on a number of parameters such as the reaction probability, also called accommodation coefficient in the case of a nonreactive uptake, the size or surface area of the particle and a correction factor. This correction factor allows the continuum regime dif- fusion equation to be used for the transition and free molecular regime; it accounts for the competition be- tween diffusion of the chemical species in the gas phase
and accommodation or reaction at the surface. The surface area and the correction factor are usually cal-
culated using some size characterization specific to an instrument technique. Comparing these various sizes is not trivial because they may describe radically dif- ferent particle dynamics. The uptake is often assumed to be reaction limited, giving a simple proportional de- pendency of the rate on the surface area. Methods for calculating the surface area can differ considerably. In some studies, the surface area is assumed to be equal
to the sum of the surfaces of the monomers composing
the aggregates. In other studies the fractal structure of
the particles or material is completely neglected. For
example, the surface area of a carbonaceous sample in laboratory experiments is often taken as the geometric surface area of the macroscopic sample.
The purpose of this work is to provide a framework for calculating rates of uptake, reactive or not, on frac- tal aggregates and to assess how much information on
the aggregate morphology is required in order to per-
form accurate calculations. The paper is organized as
follows. The second section is devoted to some back-
ground on the numerical generation of fractal aggre- gates and on the resolution of the diffusion/reaction
equation. A large range of fractal particles is consid-
ered in this study. They have morphologies similar to
observed carbonaceous aerosols. The third section de- scribes the numerical three-dimensional simulations of
uptake on isolated aggregates. The main results are
discussed. Simple physically based relationships are de-
rived from the numerical results in section 4. The im-
portant parameters regarding the particle structure are
highlighted. Finally, in section 5 the new relationships
are compared to the expressions of the spherical parti- cles. The importance of taking into account the fractal character of aggregates in this type of calculations is highlighted.
2. Modeling
2.1. Aggregate Generation
An aggregate
or cluster
can be characterized
by its
gyration radius R6 which may be defined asN
2N
2 •, (r,•-rm)
2 ,
(1)
n,m--1
where N is the total number of particles of the aggre- gate; n and m denote the number of any two monomers and r• is the position vector of particles. For the sake of numerical simplicity in the present study, each
monomer is supposed to be a cube of size a.
The fractal dimension DF may be introduced by the
relation
-
a(2)
where • is the compacity of the aggregate.
Many procedures have been proposed in the literature
[Jullien and Borer, 1987] for generating aggregates with
various fractal dimensions. Three of them have been se-
lected here to study the dependence of the results on the
mode of construction of the aggregates [Coelho et al., 1997]. Since theses models have been described in de-
tail previously, we only recall briefly the different ways
the fractal aggregates are constructed and the relevant characteristics of the aggregates. Note that our model- generated aggregates are very similar to carbonaceous
aerosols observed in the atmosphere [Bekki et al., this issue].
A modified Witten and Sander scheme was used in
order to accelerate the convergence to the asymptotic
regime [ Witten and Sander, 1981]. The random particle
does not stick to the aggregate when it is on a site
adjacent to occupied sites, but it is moved until it is
on an occupied site; then its final position is supposed to be the previous one. Such a scheme yields a fractal dimension of 2.64, which is slightly larger than the value of 2.5 obtained with the original Witten and Sander
scheme.
The hierarchical model with linear trajectories was
applied without any modifications [Sutherland, 1970];
two aggregates of same size N are assumed to stick when they occupy adjacent sites. Their resulting fractal di-
mension is difficult to measure with precision because of
the large statistical fluctuations due to the model itself;
it was found to be close to 1.9.
The last model is a hierarchical model where the
fractal dimension is tuned by selecting the orienta-
tion and the sticking
point of aggregates
of size 2 (p-l)
where p is the iteration number [Thouy and Jullien, 1994]. Four values of the fractal dimension were stud-ied, namely, 1.6, 1.9, 2.2, and 2.5. For comparison pur-
poses, two of them were chosen close to the values of
the Witten-Sander aggregate and to the standard hier-
archical model.
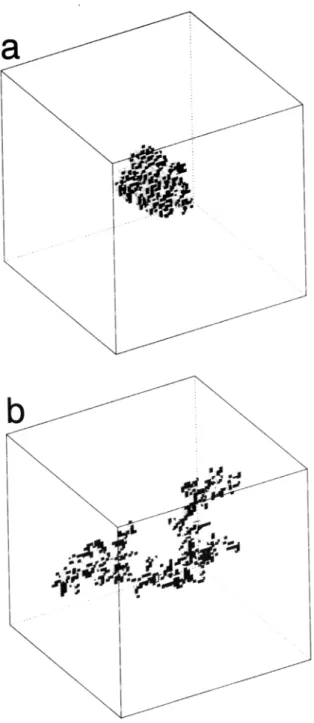
The structures of some of the aggregates are repre- sented in Figure 1. Each aggregate is placed inside a large cubic cell of size Nc.a and its properties computed. Nc was chosen equal to 32, 48, 64, and 96. In order to minimize the influence of the finite size of the cell, the center of gravity of each aggregate is assumed to be located at the center of this cubic cell. Usually, Nc.a is taken large enough with respect to the gyration ra- dius so that the resulting fraction of the large cubic cell volume occupied by solid particles is smaller than 0.02.
COELHO ET AL.: UPTAKE ON FRACTAL PARTICLES, 1 3907
Figure 1. Examples of fractal aggregates composed of
cubic particles of size a; they are located inside cubic
boxes of size 64a. (a) The aggregate was built with a modified Witten and Sander scheme. (b) The aggregate
was built with the hierarchical model.
where k0 is called the prefactor or structural coefficient
and is equivalent to (; r is the radius of the spherical monomers. If the spherical monomers of such aggre- gates are replaced by cubic monomers of size equal to
the diameter of the spherical monomers, the radius of
gyration
remains
unchanged.
Therefore
combining
(2)
and (3) gives
k0 • •/2 Dr.
A number of three-dimensional numerical simulations
[$orensen
and Roberts,
1997; Oh and $orensen,
1997]
and laboratory experiments [Cai et al., 1995; $orensen and Feke, 1996] have been performed on soot with a
fractal dimension of about 1.8. They found that k0
ranges between 1.2 and 1.3 for most cases. The .pref- actor k0 calculated from ( and Dr given in Table 1
varies from i to 1.3 for aggregates with Dr close to 1.8
(Dr=l.9 and 1.6), which
is consistent
with the previous
results.
2.2. Mass Transfer and Boundary Conditions
For numerical reasons, aggregates must be repre-
sented within a limited three-dimensional domain, the
external cell. Consider a chemical species whose con-
centration is C, which diffuses from the walls 0• of the
cell to the surface of the aggregate where it undergoes a pseudo-first-order loss or chemical conversion. If a constant concentration C• is maintained on 0<;, a per- manent concentration field is obtained in the cell. The situation, where the size of the cell is very large com- pared to the size of the aggregate, is the most relevant to atmospheric problems, where aggregates are immersed
in an infinite fluid, the air, with uniform concentration
far from the aggregates.
The steady state mass transfer to the aggregate is
ruled in the bulk by the classical diffusion equation
V. (DVC) = 0, (4)
where D is the gas phase diffusion coefficient of the
species.
Boundary conditions are as follows. At the surface of
the cell,
c = (5)
At the surface $f,•t• of the aggregate with the unit external normal n
The morphological parameters relative to these ag-
gregates are summarized in Table 1. The values of frac-
tal dimension considered here cover approximately the
range of values observed in atmospheric carbonaceous
aerosols
(see
Table 2 of the companion
paper [Bekki
et
al., this issue]).
Values
of the compacity
• can be com-
pared to previous studies of soot aggregates composed
of spherical monomers. In this case, the relationship equivalent to (2) is
-
-- ,(a)
n. DVC = Ks C on Sœr•ct•l ,
(6)
where Ks is the surface reaction rate constant, which may be called the uptake velocity. It is related to the re-
action probability 7 (or sticking probability in the case of a nonreactive uptake), which is defined as the ratio
of the number of reactive collisions to the total number
of collisions, by the following relationship
Ks=7 'v
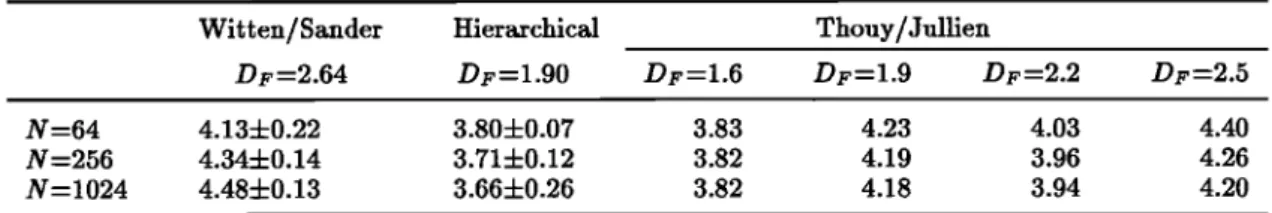
4 'Table 1. The Fractal Dimension Dr and the Compacity • of the Various Types of Aggregates Witten/Sander Hierarchical Thouy/Jullien
D1•=2.64 Dl•=l.90 Dl•=l.6 Dl•-l.9 D•,=2.2 DF=2.5
N =64 4.13 4- 0.22 3.80 4-0.07 3.83 4.23 4.03 4.40 N =256 4.344-0.14 3.714-0.12 3.82 4.19 3.96 4.26 N-1024 4.484-0.13 3.664-0.26 3.82 4.18 3.94 4.20
In this steady state regime, one is mostly interested by the mass flux J of a diffusing species which reacts at the surface of the aggregate. J is given by
j - f D vc,
(7)
where S is any closed surface which surrounds the ag-
gregate.
2.3. Analytical Results for Spheres
We start by recalling the case of compact spheres
because analytical results are available and should help
to interpret the numerical results on fractal aggregates. Let us consider two concentric spheres of radii Ri and
Re. Equations
(5) and (6) hold on the external
and the
internal spheres, respectively. Because of the spherical symmetry, the concentration field is easily calculated as
well as the flux J,
(• I )-1
J - 4x
D C• Ri
+ PeDa '
(8)
where i I 1=
(0)
Ks RiPeDa
- D '
(10)
where PeDa, called the Peclet-DahmkShler number, is
the correction factor mentioned in the introduction. It is a dimensionless quantity which compares the surface
chemical rate to the gas phase diffusion rate. It is some-
what similar to the diffuso-reactive parameter which is used in the calculation of loss rates in liquid spheres when the chemical reaction takes place within the liq-
uid [Hanson et al., 1994]; the diffuso-reactive parameter
compares the chemical rate to the liquid diffusion rate.
For clarity we will call the Peclet-DahmkShler number
the reaction/diffusion ratio.
The most relevant case here is an isolated particle of
radius R (immersed in an infinite fluid, so Re -• oc). '
Hence R- Ri - R and the flux can be written as
1 )-•
Jsphere
-- 4•r
D C• R 1 + PeDa
(11)It is convenient to introduce a dimensionless quantity, the Nusselt number Nu, which is defined as the ratio of the actual flux J to the diffusion flux, which would be the actual flux if the uptake was diffusion limited.
leading to
J
Nu - 4•'
D C• R '
(12)
1 )-x
Nu- 1 + PeDa '
(13)We will call Nu the scaled flux. When PeDa>>l, Nu - 1. The uptake is said to be diffusion limited and
the flux is given by
Jsphere -- 4•r D C• R .
When PeDa<<l, Nu - PeDa. The uptake is reaction limited and the flux becomes proportional to the surface area,
Jsphere
-- 4•' Ks C• R 2 ,
Between these two established regimes lies the transi- tion regime where the uptake is controlled by both pro-
cesses and the full relationship (11) has to be used. Equations (10) and (11) can be found under other equivalent forms in the literature [Turco et al., 1989;
Ghosh et al., 1995; Seinfeld and Pandis, 1998]. For
example, the flux can also be expressed as a function
of 7 and the Knudsen number Kn which compares the mean free path la of the diffusing species in the fluid,
here air, and the size of the sphere,
la
Kn- •.
(14)
When Kn<<l (i.e., the mean free path of the diffusing species is much smaller than the size of the sphere), the
sphere is said to be in the continuum regime. In the
limit of Kn>•l, the sphere is said to be in the free
molecular or kinetic regime.
Since l•=3D/v [Turco et al., 1989; $einfeld and Pan- dis, 1998], PeDa can be expressed as a function of Kn,
3'),
(15)
PeDa
- 4 Kn '
Mass transfer in the diffusion limited regime implies necessarily a continuum regime. We prefer to use PeDa instead of Kn for characterizing the nature of the up- take because, unlike Kn, PeDa also accounts for the number of collisions leading to the uptake of the species. In the following sections, non-spherical aggregates in a cubic cell are considered and the diffusion equation is solved numerically.
COELHO ET AL.' UPTAKE ON FRACTAL PARTICLES, 1 3909
3. Numerical Results
Equation
(4) and the related
boundary
conditions
(5)
and (6) were
discretised
in three
dimensions
(see
Figure
1) by the finite volume technique and solved by an im-proved version of conjugate gradient; this represents an extension and a significant progress on the first versions
of this technique
[Thovert
et al., 1990].
The geometry of the problem is characterised by sev-
eral parameters which can be listed as follows: the size
Nc.a of the cell, the number N of monomers of the ag-
gregate
(or equivalently
its gyration
radius RG), and
some statistical characteristics of the geometry of the aggregate such as its fractal dimension D F.
The size Nc.a of the cell is not a physically mean-
ingful parameter for our purposes; it is only of interest here in the limit Nc.a --> oc. Similarly, the number N
of monomcrs of the aggregate should be large enough so that it is in the limiting fractal regime (i.e., D F in-
dependent
of N or size of the aggregate).
In order to study these parameters, two sets of nu- merical simulations were performed over wide intervals of variations. Six kinds of random aggregates with frac- tal dimensions ranging from 1.6 to 2.64 were considered
(see
Table 1). In the first series
of simulations,
Nc and
N were set equal toN•:32, 48, 64, 96 N=64, 256, 1024
Also, eight different values of the reaction coeffi- cient Ks were used, corresponding to a dimensionless
coefficient Ks.a/D equal to I0 N with n=-4,-3,-2,-1,- 0.5, 0, 0.5, 1. For each case, 10 aggregates were gener-
ated and the resulting concentration fields solved nu-
merically.
In addition to the first series, a second series of sim- ulations was designed to study the diffusion limited
regime specifically. The boundary condition (5) was
replaced by a Dirichlet condition at the surface of the
aggregate:
C = 0 on Sfractal
(i.e., Ks.a/D -.• oc).
A larger set of values for Nc and N was used in the
second series,
N•=32, 48, 64, 80, 96
N= 32, 64, 128, 256, 512, 1024
By analogy with spherical aggregates, the scaled flux
Nu and the reaction/diffusion ratio PcDa are initially
based on the gyration radius,
(PeDa) G = Ks RG
D
(Nu)• =
4z' D C• R•
In order to limit the range
of values
on the flux axis,
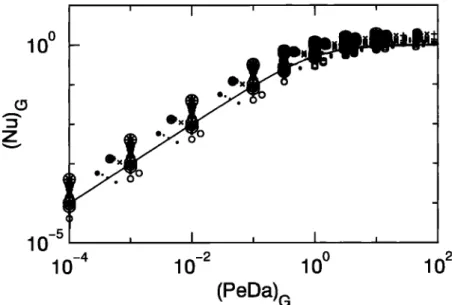
results for the first series of simulations are representedunder
the form of (Nu)• as a function
of (PeDa)• in
Figure 2. The solid line correspond.• to the scaled flux
calculated
from (11). Numerical
results
are the sym-
bols. This representation
shows
a lot of scatter,
sug-
gesting that Nu and PeDa defined from the radius ofgyration cannot fully account for the results. This scat-
10 0
10 -5
,
I
,
I
,
10
-4
10
-2
10
ø
10
2
(PeDa)G
Figure 2. Scaled
flux (Nu)G as a function
of the reaction/diffusion
ratio (PeDa)• for the first
series
of simulations.
The solid
line corresponds
to Nu calculated
from the uptake
flux given
by
(11). Each
point represents
an average
over 10 simulations.
Data symbols
are crosses
in circles
for the modified
Witten and Sander
model (D•=2.64), pluses
in circles
for the hierachical
model
with linear
trajectories
(D•=l.9), circles
for the Th0uy
and Jullien
model
(D•=l.6), pluses
for
the Thouy
and
Jullien
model
(Dl•-l.9), crosses
for the Thouy
and
Jullien
model
(D1•-2.2)
and
asterisks
for the Thouy and Jullien
model (D1•=2.5).
ter originates from the fact that, unlike spheres, a length scale is not sufficient for characterizing the morphology of fractal aggregates. More parameters are required.
4. Derivation of Physically Based
Relationships
The general strategy for simplifying this complex pic- ture is to study the dependence of the numerical re-
sults on these parameters and derive physically based fits which are consistent with the analytical results of
the sphere, the final aim being to cast the results into
a form similar to (11) with adequate definitions of the
various quantities. This will be done by considering the two asymptotic regimes, large and small values of PeDa.
In the diffusion limited regime (PeDa>> 1), a charac-
teristic length of the aggregate, henceforth referred to
as diffusion equivalent radius Rd, is defined in such a way that
J = 4•r D C• Rd. (16)
In the reaction
limited regime (PeDa<<l),
J = Ks $fr•ct•l C•, (17)
where $fr•ct•l is the surface area of the aggregate. Hence
PeDa can be expressed as
Ks •fract al
PeDa
- 4•rDRd
'
(18)
By fitting the upper and lower limits, it is hoped that the whole set of numerical results will lie on the curve
calculated using (18). The following section is devoted
to the determination of Rd and $f•c•.
4.1. Determination of the Diffusion Equivalent
Radius
Let us first analyze the influence of the artificial pa- rameter Nc.a which is the size of the external cell. By
analogy with (9), 1/Rd derived from the numerical re-
suits is plotted as a function
of 1/(Nc.a) in Figure 3.
Each straight line corresponds to a specific aggregate
inside cells of various sizes. Within few percents, the slopes are identical and equal to 2, which demonstrates
that Re and N•.a/2 are equivalent. An expression sim- ilar to (9) can then be derived,
i i 2
Rd
= Rd• N•.a
'
(19)
where Rd• is the diffusion equivalent radius of an ag- gregate in an infinite fluid.
The next step consists of analysing the relationship which exists between the diffusion equivalent radius and the gyration radius. On physical grounds, Rdo• is ex- pected to be proportional to Ro. Rd• is displayed as a function of Ro in Figure 4. Each straight line corre- sponds to aggregates built according to the same rule, but with different Ro. Hence the linear relationship which is supported by the numerical results is given by
=
+
(20)
In the following,
/•(Dr) can be neglected
for suffi-
ciently large aggregates.
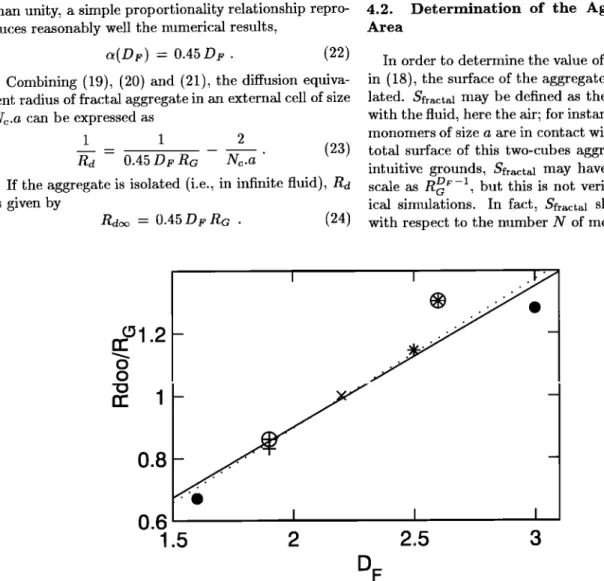
The last step consists of analysing a as a function of Dr. This is done in Figure 5, where the scale tends to magnify the variations. A linear regression fit yields
a(Dr) = 0.4755.Dr - 0.0537,
(21)
with a regression coefficient of 0.96. Since Dr is greater
0.3 0.1 I I
0
I
I
I
0 0.01 0.02 0.031/(Nc.a)
Figure 3. Inverse
diffusion
radius 1/Rd as a function
of 1/(N•.a) for the second
series
of simu-
lations (PeDa -• oc). Each straight
line corresponds
to a given aggregate
(Dr and N constant)
inside cells of different sizes. Each point represents an average over 10 simulations. Data symbols are the same as in Figure 2; data for spheres are represented by solid circles.
COELHO ET AL' UPTAKE ON FRACTAL PARTICLES, 1 3911 20 15 o o I I I
0
5
10
15
20
25
R
G
Figure 4. Diffusion
equivalent
radius
Rdo•
as a function
of the gyration
radius
Ro. Each line
corresponds
to the same
type of aggregates.
Data symbols
are the same
as in Figure 3.
than unity, a simple proportionality relationship repro-
duces reasonably well the numerical results,
•(DF) - 0.45DF.
(22)
Combining
(19), (20)and (21), the diffusion
equiva-
lent radius of fractal aggregate in an external cell of sizeNc.a can be expressed as
1 1 2
- . (23)
Rd 0.45 D• R• Nc.a
If the aggregate
is isolated
(i.e., in infinite
fluid), Rd
is given by
Rdoo -- 0.45 D•, Ro . (24)
4.2. Area
Determination of the Aggregate Surface
In order to determine the value of PeDa as expressed
in (18), the surface of the aggregate needs to be calcu-
lated. $fr•ct•l may be defined as the surface in contact
with the fluid, here the air; for instance, when two cubic monomers of size a are in contact with one another, the
total surface
of this two-cubes
aggregate
is 10.a
2. On
intuitive grounds, $fr•ct•l may have been expected to
scale
as R• F-• but this is not verified
by our numer-
ical simulations. In fact, $f•t•l should be expressed with respect to the number N of monomers composing
•12
n' ß o on-
1
0.8 2D F
I I 0.61.5
2.5
3
Figure 5. RagIRo as a function
of the fractal
dimension
D F. The dotted
line corresponds
to the linear
regression
fit (22) and
the solid
line
to the proportionality
relationship
(23). Data
4000 3000 2000 lOOO o I
-
3oo
I
/
200
1
0
10
20
100 200 300(RG/a)
DF
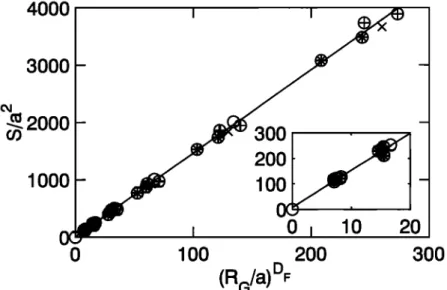
Figure 6. Scaled
surface
area $fracta•/a
2 as a function
of (Ra/a) D•'. The subplot
is an enlarged
view for small aggregates.
The solid line corresponds
to the linear regression
fit (27). Data
symbols are the same as in Figure 3.
the aggregate,
$•ract•l - s N (25)
and
R• • is valid
for all fractal
aggregates.
In addition,
only a limited range of Dr has been tested.
with 4.3. Uptake Flux on an Isolated Fractal
Aggregate
s - Fso,
For practical purposes it might be useful to go back
where
So,
s and F are thesurface
of an isolated
monomer to dimensional
quantities. We limit ourselves
to the
(= 6 a2), the averaged
free surface
area
of the monomers
(surface in contact with the fluid, which is air here), and
the averaged fraction of free surface on the monomers, respectively.
By substituting N, (25) becomes
Sfrac•a•
- F 6 a 2 • --
.
(26)
All the numerical data are plotted as functions of
R• • in Figure
6. A linear
regression
yields
Sf•cta•
a 2= 14.4
--
,+ 10
(27)
with a correlation coefficient of 0.9991. For large aggre- gates the constant 10 can be omitted.
It is somewhat remarkable that the proportionality
coefficient
between
Sf•½•l
and R• • is the same
for all
the type of aggregate considered here. The mode of construction of the aggregates does not appear to have any influence. This indicates that the averaged fraction
of free surface area F of the monomers is inversely pro-
portional to the compacity ( of the aggregate. In our calculations, ( varies from 3.6 to 4.5, which is equiva-
lent to F• varying from 53% (on average, 3.2 faces out
of the 6 faces of the cubic monomers •e in contact with
the fluid) to 67% (4 faces). In view of the rather limited
number of aggregate types considered in this study, we cannot claim that the proportion•ity between Sf•l
case of an isolated aggregate within an infinite fluid. Since the diffusion equivalent radius Rd• and $f•½•1
are given
by (24) and (27), respectively,
the flux Jfract•l
may be expressed as
( 1)
J•ct•l - 5.65
D Co•
DF Ra 1 + PeDa
-1(28)
wherePeDa-KsRo
D DF
2.55
.
(29)
The fact that J•cta• scales as R6 in the diffusion lim-
ited
regime
and
as R• • in the reaction
limited
regime
is
generally
consistent
with previous
calculations
[Meakin
et al., 1989; Schmidt-Oft et al., 1990]. However, in the reaction limited regime (which corresponds to the freemolecular/kinetic
regime
for a high reaction
probabil-
ity 7), we did not find that Jf•ct•!
scales
as R• for
D• > 2 [Schmidt-Oft
et al., 1990].
It might be possible
that one needs to consider aggregates composed of an
extremely large number of monomers in order to detect
this dependency
[Meakin
et al., 1989].
Equation
(28) can be tested
for the extreme
case
of
compact
spheres
(i.e.,
Rc- v•R, a - R and
D• - 3).
In the diffusion limited regime, Jf•½•l is equal to Jsphere within 5%. However, in the reaction limited regime
(when
J is proportional
to the surface
area), Jf•act•l
and
Jsphe•
differ
by almost
a factor
2. This may correspond
COELHO ET AL.: UPTAKE ON FRACTAL PARTICLES, 1 3913
10
o
•_.
10
-2
0.4T
I
-4..
I
10
0 I
1@
1010
-4
10
-2
10
ø
10
2
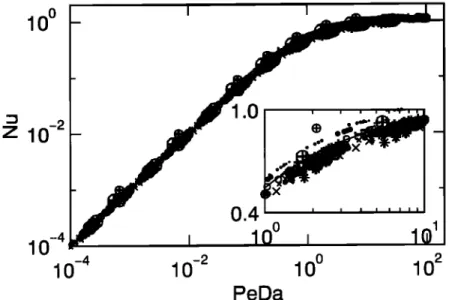
PeDaFigure 7. Scaled
flux Nu as a function
of the reaction/diffusion
ratio PeDa. The solid
line
corresponds
to Nu calculated
from the uptake
flux given
by (28). Each point represents
an
average
over 10 simulations.
The subplot
is an enlarged
view of the transition
regime. Data
symbols are the same as in Figure 3.
to the distinction between the free surface area $e which
is in contact with the external fluid (fluid connected to infinity) and the surface area $i which bounds closed
fluid cavities within the aggregate. As long as D l, is not too close to 3, $fr•ct•l • $e- However, when aggregates are highly compact with Dl, approaching 3, some closed fluid cavities may form and $i becomes significant. This
type of extreme case is not often encountered in the at-
mosphere and therefore no further numerical study was
devoted to this topic. Overall, when D l, tends towards
3, it is preferable to use the relationship (11).
In order to test (28) for more common cases of fractal
aggregates, the scaled flux Nu can be plotted as a func-
tion of the reaction/diffusion ratio PeDa, as in Figure
2. For clarity, Nu is recalled to be
J
Nu - 5.65
D C• Dl,
Rc '
(30)
All the numerical results (symbols) are displayed in1-•. ? ___1 .... ,,1_ ..1 •-• •-t..• •-t..
lationship
(28). The agreement
between
the numerical
results
and (28) is found to be excellent;
an enlarged
view of the transition regime is given in the subplotof Figure
7. The improvement
on relationship
(11) is
most obvious when comparing Figures 2 and 7. This demonstrates that the new framework performs in a
satisfactory manner.
4.4. Extension to a Lognormal Distribution of
Aggregates
Equation
(28) corresponds
to isolated
single
size
frac-
tal aggregates and hence can only be applied directly to monodispersed size distributions of aggregates. Beforebeing applied
to realistic
cases,
it needs
to be general-
ized to aggregate
populations
with wider size
distribu-
tion.The total flux Jt of a chemical species onto a distri- bution of fractal aggregates is given by
Jt -
Jfr•ct•i
N(Rc) dR• ,
(31)
where
N(R•) is the size
distribution.
Since
many
soot
distributions
tend to be lognormal
[Pueschel,
1996;
Pueschel
et al., 1998;
Reid
and
Hobbs,
1998;
Reid et al., •9981,
N(R•) is taken
as
•2
N(R•)
dRc
-- No
2•rexp(- )dot (32)
•-with
ln(R•)- ln(RG,mod)
Ct
--
ln(a)
'
where
No, RG,mod,
and rr are the total concentration,
the mode radius, and the geometric standard deviation
(also
called
the width)
of the distribution
of soot
aggre-
gates.
Equation
(31) can be integrated
analytically
in the
two asymptotic regimes using
i• N(RG)
dRG
-- /•,rnod
N0
ß2•r
• •xp(•t
•n(•)•
- -7)
In the diffusion
limited regime
(PeDa>>
1), the uptake
flux becomes
ln
(o"})
. (33)
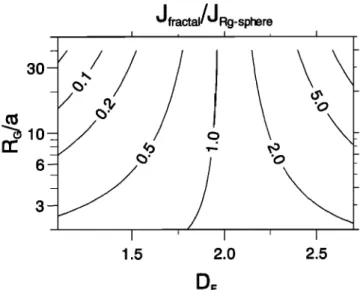
J fractal/J
Rg-sphere
I I
DF
'0
Figure
8. Ratio
of the
uptake
fluxes
Jfractal/JRg-sphere
as a function
of the fractal dimension
Dr and (RG/a).
In the reaction
limited regime
(PeDa<<l),
Jr-teac 14.4
ß =
K8 Ca a (2-m•) m•
RG,mo
d No.
2
If the size distribution is not too wide, the uptake
flux in the transition regime can be approximated by
Jt(•pprox.)
- 5.65
D Co•
Dr
R• N(R•) dry.
--1
1 + 2.55
K8 ' f•'•
R•
•' N(R•)dRG
After integration,Jr(approx.)
-- 5.65
D Ca Dr RG,mod
No ß
(ln22(rr))
( 1 )-1
exp
i q- PeDa
with ß (36)PeDa
- K• R•,moa
2.55.
D Dr(RG,mod)
(DF-2)
exp((1
--
D•*)
ln2
(rr))
. a 2As expected, this expression of PeDa is equal to Jt-reac./Jt-diff..
Once the flux is determined, the time constant r for
the uptake of a chemical species on a population of frac-
tal aggregate
can be derived
from [Ghosh
et al., 1995]
Jfrac•al
The uptake rate for the pseudo-first-order process is
simply the reciprocal of r.
5. Fractal Versus Spherical Geometry
Some previous calculations of mass transfer to aggre-
gates have been based on the assumption that the ag- gregates are compact spheres. In order to illustrate the errors generated when the fractal character of the aggre- gate is neglected, the uptake flux on a fractal aggregate
Jfr•c•l is compared to the flux on a sphere. In order to
estimate the magnitude of the errors, the sphere radius is arbitrarily taken to be equal to the gyration radius
R•. We call the flux of a sphere, defined with the gyra-
tion radius,
JRg-sphere.
In the diffusion
limited regime,
combining
(11) and (28) yields
to the ratio of the fluxes
Jfracml/JRg-srhere
-- 0.45Dr.
(37)
In this regime, Jfr•c• is independent of the small-
scale features such as the size of the monomers. The
aggregate acts as a sphere of a radius equal to the gy- ration radius multiplied by about half of the fractal di- mension.
In the reaction limited regime, uptake fluxes are di- rectly proportional to the surface area. The ratio of the
fluxes is given by
Zfrac•M/ZRg-sphere-
1.15 --
.
(38)
It is displayed as a function of R•/a and Dr in Fig-ure 8. For a fractal dimension close to 2, aggregates can be treated as spheres with a radius equal approx- imatively to the gyration radius. However, when Dr
deviates significantly from 2, Jfr•l and JRg-sphere can differ substantially (up to an order of magnitude for large elongated branch-like aggregates). It must be em- phasized that the expressions (37) and (38) result from
the use of the aggregate gyration radius as a sphere ra-
dius in (11). Other choices of equivalent size such as the
aggregate volume mean radius or hydrodynamic radius
would lead to different flux ratios and hence to different
errors which could be substantially larger. The question of which aggregate equivalent size provides the best es-
timate of the mass transfer equivalent radius is tackled
in the companion
paper [Bekki et al., this issue]. The
variations seen in Figure 8 reflect the dependency of
the surface
area on RG/a and Dr. According
to (26),
increasing
R•/a at fixed gyration
radius (i.e., reducing
the size of the monomers) has two opposite effects on$fr•½•l: it increases the number N of monomers com-
posing the aggregate, but it also decreases the surface
area of the monomers. The overall effect is controlled
by the aggregate structure, which is characterized by
the fractal dimension.
In conclusion, the results reported here suggest that neglecting the fractal character in the calculation of up- take rates on aggregates may lead to flawed results, es- pecially in the reaction limited regime for large aggre-
COELHO ET AL.' UPTAKE ON FRACTAL PARTICLES, 1 3915
Comparisons with three-dimensional numerical simula-
tions show that relatively accurate calculations can be
performed
using the simple
relationships
presented
in
this paper. A full morphological characterization of thefractal aerosols is required in some cases.
Acknowledgments. The support of the French Pro-
gramme National de la Chimie Atmosphg•rique (PNCA) is
gratefully acknowledged.
References
Ammann, M., M. Kalberer, D.T. Jost, L. Tobler, E. Rossler, D. Piguet, H.W. Gaggeler, and U. Baltensperger, Hetero- geneous production of nitrous acid on soot in polluted air
masses, Nature, 395, 157-160 , 1998.
Auraout, B., S. Madronich, M. Atomann, M. Kalberer, U. Baltensperger, D. Hauglustaine, and F. Brocheton, On the NO2 plus soot reaction in the atmosphere J. Geophys.
Res., 10•, 1729-1736, 1999.
Bekki, S., On the possible role of aircraft generated soot in middle latitude ozone depletion, J. Geophys. Res., 102,
10751-10758, 1997.
Bekki, S., C. David, K. Law, D.M. Smith, D. Coelho, J.-F. Thorerr, and P.M. Adler, Uptake on fractal particles, 2, Applications, J. Geophys. Res., this issue.
Blake, D.F., and K. Karo, Latitudinal distribution of black carbon soot in the upper troposphere and lower strato- sphere, J. Geophys. Res., 100, 7195-7202, 1995.
Cat, J., N. Lu, and C.M. Sorensen, Analysis of fractal cluster
morphology parameters- Structural coefficient and den-
sity autocorrelation function cutoff, J. Colloid Interface
Sci., 171, 470-473, 1995.
Chughtai, A.R., M.E. Brooks, and D.M. Smith, Hydration of black carbon, J. Geophys. Res., 101, 19,505-19,514, 1996. Coelho, D., J.-F. Thorerr, R. Thouy, and P.M. Adler, Hy-
drodynamic drag and electrophoresis of suspensions of fractal aggregates, Fractals, 5, 507-522, 1997.
Cooke W.F., and J.N. Wilson, A global black carbon aerosol model, J. Geophys. Res., 101, 19,395-19,409, 1996.
Fendel, W., D. Matter, H. Burtscher, and A. Schmidt-Oft,
Interaction between carbon or iron aerosol-particles and ozone, Atmos. Environ., 29, 967-973, 1995.
Forrest, S.R., and T.A. Witten, Long-range correlations in smoke-particule aggregates, J. Phys. A Math Gen., 12,
109-117, 1979.
Ghosh, S., D.J. Laxy, and J.A. Pyle, Estimation of hetero- geneous reaction rates for stratospheric trace gases with particular reference to the diffusional uptake of HC1 and
C1ON02 by polar stratospheric clouds, Ann. Geophys.,
12, •O• •12, 1995.
Hanson, R.H., A.R. Ravishankara, and S. Solomon, Hetero-
geneous reactions in sulfuric acid aerosols- A framework
for model calculations, J. Geophys. Res., 99, 3615-3629,
1994.
Hauglustaine, D.A., B.A. Ridley, S. Solomon, P.G. Hess,
and S. Madronich, HNOa/NOx ratio in the remote tro-
posphere during MLOPEX 2: Evidence for nitric acid re-
duction on carbonaceous aerosols?, Geophys. Res. Left.,
23, 2609-2612, 1996.
Haywood, J.M., and K.P. Shine, The effect of anthropogenic sulfate and soot aerosol on the clear-sky planetary radia-
tion budget, Geophys. Res. Left., 22, 603-606, 1995.
Intergovernmental Panel on climate Change, Climate Change 1995: The Science of Climate Change, edited by J.T. Houghton et al., Cambridge Univ. Press, New York,
1996.
Jacob, D.J., et al., Origin of ozone and NOx in the tropical
troposphere: A photochemical analysis of aircraft obser-
vations over the South Atlantic basin, J. Geophys. Res.,
101, 24,235-24,250, 1996.
Jullien R., and R. Borer, Aggregation and Fractal Aggre-
gates, World Sci., River Edge, N.J., 1987.
Kalberer, M., et al., Heterogeneous chemical processing of (NO2)-N-13 by monodisperse carbon aerosols at very low
concentrations, J. Phys. Chem., 100, 15,487-15,493, 1996.
Karcher, B., T. Peter, U.M. Biermann, and U. Schumann, The initial composition of jet condensation trails, J. At-
mos. $ci., 53, 3066-3083, 1996.
Kotzick, R., U. Panne, and R. Niessne, Changes in conden- sation properties of ultrafine carbon particles subjected to
oxidation by ozone, J. Aerosol Sci., 28, 725-735, 1997. Lainreel, G., and T. Novakov, Water nucleation properties of
carbon-black and diesel soot particles, Atmos. Environ.,
29, 813-823, 1995.
Lary, D.J., A.M. Lee, R. Toumi, M.J. Newchurch, M. Pirre, and J.B. Renard, Carbon aerosols and atmospheric pho- tochemistry, J. Geophys. Res., 102, 3671-3682, 1997. Lary, D.J., D.E. Shallcross, and R. Toumi, Carbonaceous
aerosols and their potential role in atmospheric chemistry,
J. Geophys. Res., 10•, 15,929-15,940, 1999.
Mandelbrot, B.B., The Fractal Geometry of Nature, W.H.
Freeman, New York, 1982.
Meakin, P., Fractal aggregates in geophysics, Rev. Geophys.,
29, 317-354, 1991.
Meakin, P., B. Donn, and G.W. Mulholland, Collisions be- tween point masses and fractal aggregates, Langmuir, 5,
510-518, 1989.
Minnis, P., D.F. Young, D.P. Gaxber, L. Nguyen, W.L. Smith Jr., and R. Palikonda, Transformation of contrails into cirrus during SUCCESS, Geophys. Res. Left., 25,
1157-1160, 1998.
Oh, C., and C.M. Sorensen, The effect of overlap between
toOhomers on the determination of fractal cluster mor-
phology, J. Colloid Interface Sci., 193, 17-25, 1997. Penner, J.E., H. Eddieman, and T. Novakov, Towards the
development of a global inventory for black carbon emis- sions, Atmos. Env., 27, 1277-1295, 1993.
Pueschel, R.F., Stratospheric aerosols: Formation, proper- ties, effects, J. Aerosol Sci., 27, 383-402, 1996.
Pueschel, R.F., D.F. Blake, K.G. Suetsinger, A.D.A. Hansen, S. Verma, and K. Karo, Black carbon (soot)
aerosol in the lower stratosphere and upper troposphere, Geophys. Res. Lett., 19, 1659-1662, 1992.
Pueschel, R.F., S. Verma, G.V. Ferry, S.D. Howard, S. Vay,
S.A. Kinne, J. Goodman, and A.W. Straws, Sulfuric acid
and soot particle formation in aircraft exhaust, Geophys.
Res. Left., 25, 1685-1688, 1998.
Reid, J.S., and P.V. Hobbs, Physical and optical properties _ryc. tiiig ... vid,,d biunl• •ll-• h, Brazil, Y.
v.i. D///•k/.I•C œœUJ. JJ. 111Ul
Geophys. Res., 108, 32,013-32,030, 1998.
Reid, J.S., P.V. Hobbs, R.J. Ferek, D.R. Blake, J.V. Mar- tins, M.R.Dunlap, and C. Liousse, Physical, chemical, and optical properties of regional hazes dominated by smoke in Brazil, J. Geophys. Res., 108, 32,059-32,080, 1998. Rogaski, C.A., D.M. Golden, and L.R. Williams, Reactive
uptake and hydration experiments on amorphous carbon
treated with NO•, SO•, Os, HNOa, and H•SO•, Geophys.
Res. Left., 24, 381-384, 1997.
Schmidt-Oft, A., New approaches to in situ characterisation
of ultrafine agglomerates, J. Aerosol Sci., 1•, 553-563,
1988.
Schmidt-Oft, A., U. Baltensperger, H.W. Gaggeler, and D.T. Jost, Scaling behavior of physical parameters de-
scribing
agglomerates
J. Aerosol
$ci., 21, 711-717,
1990.
Schult, I., J. Feichter, and W.F. Cooke, Effect of black car-bon and sulfate aerosols on the Global Radiation Budget, J. Geophys. Res., 102, 30,107-30,117, 1997.
Seinfeld, J.H., and S.N. Pandis, Atmospheric Chemistry and Physics, John Wiley, New York, 1998.
Smith, D.M., and A.R. Chughtai, Reaction kinetics of ozone
at low concentrations with n-hexane soot, J. Geophys. Res., 101, 19,607-19,620, 1996.
Smyth, S.B., et al., Factors influencing the upper free tro-
pospheric distribution of reactive nitrogen over the South Atlantic during the TRACE A experiment, J. Geophys.
Res., 101, 24,165-24,186, 1996.
Sorensen, C.M., and G.D. Feke, The morphology of macro-
scopic soot, Aerosol $ci. Technol., 25, 328-337, 1996. Sorensen, C.M., and G. Roberts, The prefactor of fractal
aggregates, J. Colloid Interface $ci., 186, 447-452, 1997.
Strom, J., and S. Ohlsson, In situ measurements of enhanced
crystal number densities in cirrus clouds caused by aircraft
exhaust, J. Geophys. Res., 103, 11,355-11,361, 1998. Sutherland, D.N., Chain formulation of fine particle aggre-
gates, Nature, 226, 1241-1242, 1970.
Tabor, K., L. Gutzwiller, and M.J. Rossi, The heterogeneous interaction of NO2 with amorphous carbon at ambient temperatures, J. Phys. Chem., 98, 6172-6186, 1994. Thouy, R., and R. Jullien, A cluster-cluster aggregation
model with tunable fractal dimension, J. Phys. A Math Gen., 27, 2953-2963, 1994.
Thorerr, j._F., F. Wary, and P.M. Adler, Thermal con-
ductivity of random media and regular fractals, J. Appl.
Phys., 68, 3872-3883, 1990.
Turco, R.P., O.B. Toon, and P. Hamill, Heterogeneous
physicochemistry of the polar ozone hole, J. Geophys. Res., 9•, 16,493-16,510, 1989.
Vaxtiainen, M., S.R. McDow, and R.M. Kamens, Water up- take by sunlight and ozone exposed diesel exhaust parti- cles, Chemosphere, 32, 1319-1325, 1996.
Weingaxtner, E., H. Burtscher, and U. Baltensperger, Hy-
groscopic properties of carbon and diesel soot particles,
Atmos. Environ., 31, 2311-2327, 1997.
Witten, T.A., Jr., and L.M. Sander, Diffusion limited aggre-
gation, a kinetic critical phenomenon, Phys. Rev. Left., 4/7, 1400-1403, 1981.
P.M. Adler and D. Coelho, Institut de Physique du Globe de Paris, Tour 24, 4 Place Jussieu, F-75252 Paris, France.
(e-mail: [email protected])
S. Bekki (corresponding author), Service d'Ag•ronomie du
Centre National de la Recherche Scientifique, Universit(• P. et M. Curie, Paris, Boite 102, Couloir 15-14, 5 •"• etage, 4
place Jussieu, 75230 Paris Cedex 05, France. (e-mail: sli- [email protected])
j._F. Thorerr, Laboratoire des Phg•nom•nes de Trans-
port dans les Mg•langes (LPTM), SP2MI, BP 179, 86960- Futuroscope Cedex, France. (e-mail: [email protected])
(Received April 7, 1999; revised July 27, 1999;