The contribution of anthropogenic SO[subscript 2]
emissions to the Asian tropopause aerosol layer
The MIT Faculty has made this article openly available.
Please share
how this access benefits you. Your story matters.
Citation
Neely, R. R., P. Yu, K. H. Rosenlof, O. B. Toon, J. S. Daniel, S.
Solomon, and H. L. Miller. “The Contribution of Anthropogenic
SO[subscript 2] Emissions to the Asian Tropopause Aerosol Layer.”
J. Geophys. Res. Atmos. 119, no. 3 (February 15, 2014): 1571–1579.
© 2014 American Geophysical Union
As Published
http://dx.doi.org/10.1002/2013jd020578
Publisher
Wiley Blackwell
Version
Final published version
Citable link
http://hdl.handle.net/1721.1/99160
Terms of Use
Article is made available in accordance with the publisher's
policy and may be subject to US copyright law. Please refer to the
publisher's site for terms of use.
RESEARCH ARTICLE
10.1002/2013JD020578 Key Points:• The ATAL is of anthropogenic ori-gin but not solely due to emissions from Asia
• Asian emissions contribute 30% of the sulfate aerosol extinction in the ATAL
• Moderate volcanic activity precludes observation of the ATAL
Correspondence to: R. R. Neely III, rneely@ucar.edu
Citation:
Neely III, R. R., P. Yu, K. H. Rosenlof, O. B. Toon, J. S. Daniel, S. Solomon, and H. L. Miller (2014), The contribution of anthropogenic SO2emissions to the Asian tropopause aerosol layer, J.
Geophys. Res. Atmos., 119, 1571–1579,
doi:10.1002/2013JD020578.
Received 17 JUL 2013 Accepted 13 JAN 2014
Accepted article online 16 JAN 2014 Published online 15 FEB 2014
The contribution of anthropogenic SO
2
emissions to the Asian
tropopause aerosol layer
R. R. Neely III1,2,3, P. Yu4,5, K. H. Rosenlof2, O. B. Toon4,5, J. S. Daniel3, S. Solomon6, and H. L. Miller2,3
1Advanced Study Program, National Center for Atmospheric Research, Boulder, Colorado, USA,2Cooperative Institute for
Research in Environmental Sciences, Boulder, Colorado, USA,3Earth System Research Laboratory, NOAA, Boulder, Colorado,
USA,4Department of Atmospheric and Oceanic Sciences, University of Colorado Boulder, Boulder, Colorado, USA, 5Laboratory for Atmospheric and Space Physics, University of Colorado Boulder, Boulder, Colorado, USA,6Department of
Earth, Atmospheric and Planetary Sciences, Massachusetts Institute of Technology, Cambridge, Massachusetts, USA
Abstract
Recent observations reveal a seasonally occurring layer of aerosol located from 0◦to 100◦E, 20◦ to 45◦N and extending vertically from about 13 km to 18 km; this has been termed the Asian tropopause aerosol layer (ATAL), and its existence is closely associated with the Asian summer monsoon circulation. Observational studies argue that the ATAL is a recent phenomenon, as the layer is not observed in the satellite record prior to 1998. This suggests that the ATAL may be of anthropogenic origin associated with a shift in the dominant regional emission of sulfur dioxide (SO2) to China and India in the late 1990s.Here we test the hypothesis that SO2emitted from Asia led to the formation of the ATAL using an aerosol
microphysical model coupled to a global chemistry climate model. This is the first modeling study to specifically examine the ATAL and its possible origin. From our results, we conclude that the ATAL is most likely due to anthropogenic emissions, but its source cannot solely be attributed to emissions from Asia. Specifically, the results indicate that Chinese and Indian emissions contribute ∼30% of the sulfate aerosol extinction in the ATAL during volcanically quiescent periods. We also show that even small volcanic eruptions preclude our ability to make any conclusions about the existence of the ATAL before 1998 with observations alone.
1. Introduction
Sulfur dioxide (SO2) emissions are the dominant source of anthropogenic sulfate aerosol in the Earth’s
atmosphere [Thomason and Peter, 2006; Lamarque et al., 2010; Smith et al., 2011; Granier et al., 2011]. Anthropogenic emissions of SO2are known to alter the global distribution of sulfate aerosol, which in turn
significantly impacts the radiative forcing of Earth’s atmosphere [Charlson et al., 1992; Langner et al., 1992]. Anthropogenic SO2emissions are mainly a result of combustion processes (e.g., coal and wood burning) and
have been rapidly increasing in developing parts of the world, especially Asia, since about the late 1990s [Lu et al., 2010, 2011; Smith et al., 2011]. Prior to this period, total global SO2emissions had been decreasing
since a peak in the 1970s, due to reductions in developed countries. An accurate understanding of the fate of aerosol precursors is required to predict the net radiative forcing consequences due to changes in the regional distribution of emissions and the impact of emission control measures [Andreae et al., 2005; Bond
et al., 2013]. In this study we examine the impact of regional and globally emitted anthropogenic SO2on a
recently identified layer of aerosol in the upper troposphere and lower stratosphere (UTLS) over Asia [Vernier
et al., 2011a].
2. Aerosol and the Asian Summer Monsoon
Satellite observations compiled from Stratospheric Aerosol and Gas Experiment II (SAGE II) and Cloud-Aerosol Lidar with Orthogonal Polarization (CALIOP) reveal the existence of a layer of aerosol, from 0◦to 100◦E, 20◦to 45◦N and extending vertically from about 13 km to 18 km, termed the Asian tropopause aerosol layer (ATAL) and strongly associated with the Asian summer monsoon [Vernier et al., 2011a; Thomason and Vernier, 2013]. The Asian summer monsoon includes a persistent anticyclonic circula-tion located in the UTLS over Asia and the Middle East during boreal summer [Li et al., 2005; Fu et al., 2006;
Randel and Park, 2006; Park et al., 2007, 2008, 2009; Randel et al., 2010]. This large-scale circulation acts to
Journal of Geophysical Research: Atmospheres
10.1002/2013JD020578
and modeling of hydrogen cyanide (HCN), a known tropospheric pollutant produced in biomass burning, clearly show a region of enhanced HCN in the UTLS of the Asian monsoon. Randel et al. [2010] demonstrate that this is due to rapid vertical transport of emissions from the surface to the upper troposphere where it is locally confined and lofted further up by the large-scale anticyclonic circulation.
The ATAL forms in June with the onset of the Asian summer monsoon and dissipates around October with the breakup of the associated UTLS anticyclonic circulation [Vernier et al., 2011a; Park et al., 2009]. The observed aerosol extinction occurs mainly above 12 km, which is the main region of deep convective out-flow, and straddles the climatological tropopause [Park et al., 2007, 2009]. This location suggests that the existence of the layer is tied to large-scale vertical transport in the anticyclone.
Using SAGE II observations, Thomason and Vernier [2013] argue that the ATAL is a recent phenomenon because the ATAL is not observed in the satellite record prior to 1998. Considering the ATAL’s recent appear-ance in the satellite record, the transport mechanism provided by the Asian summer monsoon and the coincidental increase in anthropogenic SO2, from increased industrial activity in China and India, it is
hypothesized that the ATAL is an anthropogenic phenomenon. Thus, the Asian summer monsoon may be acting as a gateway for anthropogenic aerosol precursors and aerosol to enter the stratosphere in a similar manner to the behavior observed for other species [Randel et al., 2010].
Once in the stratosphere, sulfate aerosol has the potential to affect both the radiation and chemistry. Neely
et al. [2013] showed that trends in Asian emissions of SO2from 2000 to 2010 had minimal effect on the
radiative forcing due to stratospheric aerosol above 20 km compared with the observed moderate vol-canic injections of aerosol during the same period [Solomon et al., 2011; Vernier et al., 2011b]. Yet aerosol and aerosol precursors entering the stratosphere via monsoonal transport may be a significant source of the total extinction and surface area density of aerosol in the lowermost stratosphere of the Northern Hemisphere during volcanically quiescent periods due to poleward transport along the lower branch of the Brewer-Dobson circulation [Holton et al., 1995].
Due to limitations of current remote and in situ observations, the composition of aerosol in the ATAL has not been fully determined. Compositional information will be key in the effort to fully understand and attribute the ATAL to a specific source. Currently, evidence suggests that the ATAL is most likely com-posed primarily of sulfate but also includes contributions of black carbon, dust, and organic aerosol [Vernier et al., 2011a].
3. Method
In this work we address the importance of global and regional SO2emissions on the ATAL using a
three-dimensional general circulation model with sulfur chemistry (Whole Atmosphere Community Climate Model, version 3; WACCM3) coupled to a aerosol microphysical model (Community Aerosol and Radiation Model for Atmosphere, CARMA) that was previously used to study stratospheric sulfate aerosol and mete-oritic smoke [Turco et al., 1979; Toon et al., 1979, 1988; Garcia et al., 2007; Bardeen et al., 2008, 2010; Mills et al., 2008; English et al., 2011, 2012, 2013; Neely et al., 2011, 2013]. The sulfate in this model includes contributions from carbonyl sulfide (OCS) and SO2, which are the dominant sources of sulfur needed to maintain the
back-ground stratospheric aerosol layer [English et al., 2011, 2012, 2013; Neely et al., 2011, 2013]. We specifically use the version of WACCM/CARMA described and validated in Neely et al. [2011, 2013]; here we have only changed the SO2emission inventory files at the model surface to assess how different emission scenarios impact the ATAL.
In this version of the model, we omit in-cloud production of sulfate. The impact of this omission is to pre-clude the direct transport of sulfate aerosol to the upper troposphere. We justify this omission as being insignificant to the sulfate contributing to the ATAL. Contributing to this justification is that in-cloud oxi-dation and sulfate production are most important in the lower troposphere where liquid water clouds are found. Harris et al. [2013] have also shown that the dominant pathway of in-cloud oxidation occurs primarily on coarse mineral dust by way of transition metal ion catalysis. As such, in-cloud oxidation may produce sul-fate aerosol with significantly shortened lifetimes, though others have previously suggested that metal ion pathways have minimal impact on global sulfate lifetimes [Alexander et al., 2009].
Central to this experiment are the SO2emissions used within the model. Here we use emissions that come
Figure 1. Baseline boreal summer mean SO2surface mixing ratio depicted from 50◦S to 70◦N.
surface concentrations resulting from the model emission inventory files for boreal summer 2000 may be seen in Figure 1; this clearly shows that Eastern Asia represents the largest source region of SO2in 2000. Large SO2concentrations are also observed in northern Europe and the eastern United States of America. Year 2000 is used for baseline emissions in this study because these emissions are representative of emission levels when the ATAL was first observed, within the error of the underlying inventories used to create the model files [Smith et al., 2011]. Large SO2concentrations also occur over India.
In this study, three emission scenarios will be examined. The first is the baseline scenario which uses year 2000 sulfur emissions repeated for each model year. The second scenario only includes natural SO2
emissions (referred as the run with “no anthropogenic SO2” below). The third scenario does not include
anthropogenic SO2emissions contributed by China and India (referred to as the run with “no Chinese or
Indian SO2” below). Although the SO2emissions from India are ∼3 times smaller than Chinese emissions,
India is centrally located within Asian summer monsoon upwelling so its emissions may contribute propor-tionally more to the ATAL. For this reason we include both Chinese and Indian emissions together within our study. The experiment was accomplished by branching the second and third scenarios from the baseline model state and running model scenario until the simulated aerosol distributions reached a steady season-ally varying state (i.e., no global trends were observed in aerosol extinction). Each scenario was then run for 20 additional years so that a monthly climatology could be made to help remove any dynamical variabil-ity that may impact the comparison to observations. From the monthly climatology for each scenario, the extinction ratio at 1024 nm and lidar scattering ratio (i.e., the backscatter ratio) at 532 nm were calculated and compared with the SAGE II 1999–2005 climatology compiled by Thomason and Vernier [2013] and the 2006–2008 CALIOP observations [Vernier et al., 2011a], respectively. All optical calculations followed a tra-ditional Mie theory treatment based on van de Hulst [1981] using the explicit size distributions derived for each aerosol type from CARMA [Neely et al., 2013].
As mentioned above, the model also includes other sources of sulfur that lead to the formation of sulfate aerosol. Most notably, this includes OCS. Documentation of the full set of sulfur sources and validation of the specific model used in this study may be found in Neely et al. [2011, 2013]. Brühl et al. [2012] show that as much as 33% of OCS is anthropogenic in origin. OCS is most significant as a source of sulfate aerosol well above the tropopause where photolysis converts the OCS to sulfuric acid [Whitten et al., 1980]. The majority of the ATAL is below this level. Therefore, we have omitted anthropogenic OCS from our attribution anal-ysis although this may lead to a small underestimation of the amount of anthropogenic sulfate aerosol attributed to the source regions examined.
4. Results
Figure 2a presents the mean derived 1020 nm extinction ratio of the baseline model runs averaged over boreal summer (June, July, and August or JJA) from 15◦N to 45◦N. This latitude band and the 1020 nm extinction ratio were chosen to directly compare with published observations from SAGE II [Thomason and
Vernier, 2013]. Figure 2b shows the lidar scattering ratio for the same mean aerosol distribution depicted
Journal of Geophysical Research: Atmospheres
10.1002/2013JD020578
a)
b)
Figure 2. ATAL representation from the baseline model. (a) The JJA mean 1020 nm extinction ratio averaged from 15◦N to 45◦N to match the representation of SAGE II observations in Thomason and Vernier [2013, Figures 9 and 10]. (b) The same mean aerosol distribution as Figure 2a but is represented as the 532 nm lidar scattering ratio to match the presen-tation in Vernier et al. [2011a, Figure 3]. The smaller magnitude of the scattering ratio at 532 nm, relative to the extinction ratio at 1020 nm, is mainly due to the strong wavelength dependence of the molecular scattering and the change in definition from aerosol extinction only to the sum of aerosol and Rayleigh backscatter. The white line in each panel represents the mean model tropopause over the same region.
shows that the baseline model results correspond well to the vertical extent and magnitude of the aerosol observed by both Thomason and Vernier [2013] and Vernier et al. [2011a].
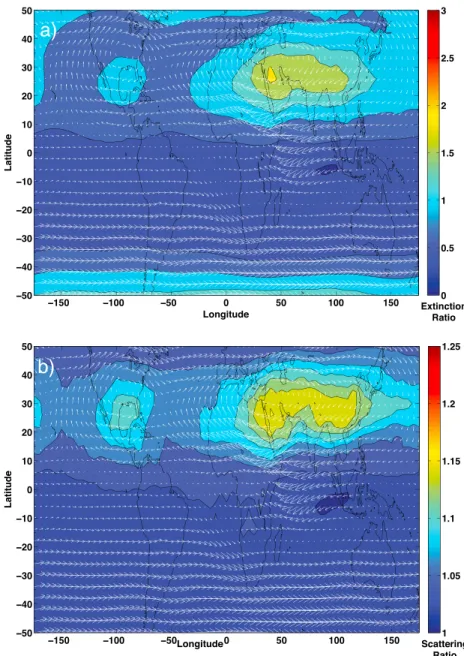
Figure 3 is similar to Figure 2 but shows a horizontal view of the model results at 100 hPa (about 16 km to 18 km in Figure 2). The results are also very similar to the horizontal extent and magnitude observed by
Thomason and Vernier [2013] and Vernier et al. [2011a]. Figure 3 also displays the mean horizontal winds from
the model. From these, it is seen that the highest aerosol extinctions are contained within the model’s Asian summer monsoon anticyclone.
Figure 4 shows the results of the three SO2emission schemes on the modeled aerosol distribution. In all
panels of this figure we only show the aerosol distribution as represented by the 1020 nm extinction ratio for direct comparison with the results of Thomason and Vernier [2013]. Figures 4a and 4d represent the baseline
a)
b)
Figure 3. Both panels correspond to the same quantities described in the corresponding panels of Figure 2 except all that panels here are shown at 100 hPa from 50◦S to 50◦N for all longitudes. Vectors represent relative mean horizontal winds. The winds depicted here are representative of the horizontal at 100 hPa winds of all the model runs in this study.
model and are identical to Figure 2a and Figure 3a. Figures 4b and 4e are the result of the model run with no anthropogenic emission of SO2. Notice that in this case the ATAL is nonexistent and the extinction due to the aerosol above 20 km is reduced by ∼25%. In comparison to the high aerosol concentrations of Figures 4a and 4c, the low aerosol loading in Figure 4b suggests that sulfate aerosol derived from anthropogenic SO2
emissions dominates over aerosol derived from OCS as the source of extinction at 100 hPa outside of the polar regions. Figures 4c and 4f present the aerosol distribution resulting from the removal of only the Chinese and Indian SO2emissions. When emissions from China and India are excluded, the extinction of the
ATAL is reduced in magnitude compared to the ATAL with all anthropogenic SO2emissions; however, the total spatial extent of the ATAL is similar.
It should be noted that the aerosol feature over North America in Figures 2 and 3 also compares well to the observations of Thomason and Vernier [2013] and Vernier et al. [2011a]. This layer appears to be associ-ated with the North America summer monsoon and is termed the North American tropopause aerosol layer (NATAL). Figures 4c and 4f also show a reduction in the NATAL corresponding to the decrease in Asian emis-sions. The reduction suggests that aerosol in the Northern Hemisphere UTLS are impacted by the global
Journal of Geophysical Research: Atmospheres
10.1002/2013JD020578
a)
b)
c)
d)
e)
f)
Figure 4. JJA mean 1020 nm extinction ratio at 100 hPa for (a) 2000 level anthropogenic SO2emissions (as in Figure 3a); (b) no anthropogenic SO2emissions; (c) 2000 level anthropogenic SO2emissions excluding the Chinese and Indian contributions. JJA mean 1020 nm extinction ratio averaged from 15◦N to 45◦N with the mean model tropopause in white for (d) 2000 level anthropogenic SO2emissions (as in Figure 2a); (e) no anthropogenic SO2emissions; (f ) 2000 level anthropogenic SO2emissions excluding the Chinese and Indian contributions.
pattern of surface emissions, as the modulation of surface emissions in China and India reduces the peak extinction ratio of this layer at 100 hPa from 1.02 to 0.86 (15%).
The reduction of NATAL implies that SO2or sulfate has a sufficient lifetime in the free troposphere to be
transported intercontinentally within the Northern Hemisphere. Such hemispheric transport has been previously observed to impact the lower troposphere by Heald et al. [2006]. The impact of both Asian emis-sions on the NATAL and global emisemis-sions on the ATAL presented by this study, suggests the existence and
a)
b)
Figure 5. Modeled JJA 1020 nm extinction ratio mean profiles of the sulfate distributions including the impact of mod-erate volcanic activity observed in 2009 due to the Sarychev eruption. (a) Directly comparable to Figures 2a and 4d–4f. (b) Directly comparable to Figures 3a and 4a–4c.
importance of the long-range transport of sulfate aerosol precursors and aerosol. A more detailed examina-tion of possible mechanisms for this transport is beyond the scope of the present study.
5. Discussion
Thomason and Vernier [2013] argue that the ATAL is a recent phenomenon because the layer is not
evi-dent in the SAGE II observations before 1998. This implies that the ATAL was created primarily by increases in anthropogenic emissions of aerosol constituents in Southeast Asia during the late 1990s. However, Figures 4c and 4f clearly show that even without any contribution from China and India, the ATAL is still present, though it is significantly reduced in magnitude.
From June of 1991 to 1998, the ability to observe the ATAL using SAGE II was likely overwhelmed by the high aerosol loading due to the Mount Pinatubo eruption. Niwano et al. [2009] clearly show that the SAGE II extinction observations were influenced by the Mount Pinatubo eruption until 1998. Prior to the Mount Pinatubo eruption in 1991 several additional volcanoes, including El Chichón (April 1982), Nevada del Ruiz (November 1985), Heard (January 1985), Lokon-Emping (March 1986 and April 1988), Ebeko (April 1989), and Kelut (February 1990), contributed to aerosol loading in the upper troposphere and stratosphere sim-ilar to that observed during the period of moderate volcanic activity in the late 2000s. Vernier et al. [2011a] clearly show that even the moderate volcanic aerosol loading of 2009 makes it difficult to discern the ATAL from the surrounding regions. The enhanced levels of volcanic aerosol in the late 1980s likely hindered SAGE II from observing the coherent structure of the ATAL. The reduced volcanic loading in 1998, coupled with the enhancement from large increases in Asian emissions [Thomason et al., 1997, 2008; Niwano et al., 2009; Thomason and Vernier, 2013] provided ideal conditions for SAGE II to make the first observations of the ATAL.
Journal of Geophysical Research: Atmospheres
10.1002/2013JD020578
As a specific example, in 2009 the ATAL was masked by the Sarychev eruption (the eruption occurred in June, 2009, 48◦N 153◦E). This masking was observed by CALIOP and is documented in Vernier et al. [2011a]. Here we have modeled the Sarychev eruption within the baseline model framework to examine the ATAL in the presence of volcanic aerosol loading. Figure 5 shows the modeled aerosol distribution during JJA of 2009 in the ATAL region. The panels of Figure 5 are directly comparable to Figures 4a and 4d. Results shown in Figure 5 are presented as 1020 nm extinction ratio, but also show strong similarities to the struc-ture of the aerosol distribution found with the lidar scattering ratio observations of Vernier et al. [2011a]. Most significant in the structure of the aerosol distribution in Figure 5a and the CALIOP observation is the apparent low aerosol concentration in the ATAL region below the tropopause. Comparison of Figures 5a and 5b to Figures 4a and 4d shows similar amounts of aerosol in the ATAL. In both panels of Figure 5, the higher aerosol abundance due to the volcanic eruption masks the normally prominent ATAL and NATAL morphology that typically stands out from the low aerosol concentrations in the UTLS.
The interaction of the aerosol created from the 2009 Sarychev eruption with the Asian monsoon also pro-vides further evidence that the large-scale circulation isolates the ATAL region from aerosol injections into the upper troposphere outside the anticyclone. Bourassa et al. [2012] have also shown this isolating phe-nomenon for aerosol trapped in the anticyclone. Specifically, Bourassa et al. [2012] show that when volcanic injection of SO2is within the bounds of the anticyclone it remains trapped and is transported upward into the lower stratosphere. Thus, even moderate volcanic activity outside the anticyclone creates a pattern in the global aerosol distribution of the UTLS that masks the ATAL, which is identified in current observations based on an enhancement of aerosol extinction in the Asian monsoon region compared to the aerosol extinction in the UTLS at other longitudes at the same time.
6. Conclusion
We have used model simulations to further our understanding of the ATAL by exploring the sensitivity of the aerosol distribution to various emission schemes. We find that model results of the ATAL match well with current satellite observations of backscatter and extinction. The results indicate that the ATAL is not created solely from Asian SO2emissions, but likely originates from a wider range of source regions. Specifically, the
results of this study show that Chinese and Indian SO2emissions contribute only ∼30% of the sulfate aerosol
extinction in the ATAL during volcanically quiescent periods. The modeled aerosol from China and India that contributes to the ATAL is proportional to the emission of SO2from these countries and is in line with
stud-ies that have examined the attribution of sources of other pollutants found in the anticyclone of the Asian monsoon [Smith et al., 2011; Park et al., 2009]. These results also suggest that the ATAL is not a recent phe-nomenon as suggested by observations [Thomason and Vernier, 2013]. Instead, the ability to easily observe the ATAL in the satellite record starting in 1998 is most likely due to the coincidental occurrence of low vol-canic activity coupled with increases in Asian SO2emissions that may have enhanced the ability to identify
the ATAL during the same period. Curiously, we also find that the sulfate in the NATAL may have a modest (15%) contribution from Asia.
References
Alexander, B., R. J. Park, D. J. Jacob, and S. Gong (2009), Transition metal-catalyzed oxidation of atmospheric sulfur: Global implications for the sulfur budget, J. Geophys. Res., 114, D02309, doi:10.1029/2008JD010486.
Andreae, M. O., C. D. Jones, and P. M. Cox (2005), Strong present-day aerosol cooling implies a hot future, Nature, 435(7046), 1187–1190. Bardeen, C., O. Toon, E. Jensen, D. Marsh, and V. Harvey (2008), Numerical simulations of the three-dimensional distribution of meteoric
dust in the mesosphere and upper stratosphere, J. Geophys. Res., 113, D17202, doi:10.1029/2007JD009515.
Bardeen, C. G., O. B. Toon, E. J. Jensen, M. E. Hervig, C. E. Randall, S. Benze, D. R. Marsh, and A. Merkel (2010), Numerical simulations of the three-dimensional distribution of polar mesospheric clouds and comparisons with Cloud Imaging and Particle Size (CIPS) experiment and the Solar Occultation For Ice Experiment (SOFIE) observations, J. Geophys. Res., 115, D10204, doi:10.1029/2009JD012451. Bond, T. C., et al. (2013), Bounding the role of black carbon in the climate system: A scientific assessment, J. Geophys. Res. Atmos., 118,
5380–5552, doi:10.1002/jgrd.50171.
Bourassa, A. E., A. Robock, W. J. Randel, T. Deshler, L. A. Rieger, N. D. Lloyd, E. T. Llewellyn, and D. A. Degenstein (2012), Large volcanic aerosol load in the stratosphere linked to Asian monsoon transport, Science, 337(6090), 78–81.
Brühl, C., J. Lelieveld, P. J. Crutzen, and H. Tost (2012), The role of carbonyl sulphide as a source of stratospheric sulphate aerosol and its impact on climate, Atmos. Chem. Phys., 12(3), 1239–1253.
Charlson, R., S. E. Schwartz, J. M. Hales, R. D. Cess, J. A. Coakley, J. E. Hansen, and D. Hofmann (1992), Climate forcing by anthropogenic aerosols, Science, 255(5043), 423–430.
English, J., O. Toon, and M. Mills (2011), Microphysical simulations of new particle formation in the upper troposphere and lower stratosphere, Atmos. Chem. Phys., 11, 12,441–12,486.
English, J. M., O. B. Toon, and M. Mills (2012), Microphysical simulations of sulfur burdens from stratospheric sulfur geoengineering,
Atmos. Chem. Phys., 12(10), 4775–4793.
Acknowledgments
This work utilized the Janus super-computer, which is supported by the National Science Foundation (award number CNS-0821794), the University of Colorado Boulder, the University of Colorado Denver, and the National Center for Atmospheric Research. The University of Colorado Boulder operates the Janus supercomputer. The work was partly supported by NSF ATM-0856007 and NASA grant NNX09AK71G. Ryan R. Neely III is currently supported by the National Center for Atmospheric Research’s Advanced Study Program; some of the work presented here was done while supported as a postdoctoral research associate by NOAA/ESRL. The authors would like to thank J.F. Lamarque, C. Granier, J.P. Vernier, M.J. Mills, C.G. Bardeen, W. Randel, and S. Tilmes for all the helpful conversations while writing this paper.
English, J. M., O. B. Toon, and M. Mills (2013), Microphysical simulations of large volcanic eruptions: Pinatubo and Toba, J. Geophys. Res.
Atmos., 118, 1880–1895, doi:10.1002/jgrd.50196.
Fu, R., Y. Hu, J. Wright, J. Jiang, R. Dickinson, M. Chen, M. Filipiak, W. Read, J. Waters, and D. Wu (2006), Short circuit of water vapor and polluted air to the global stratosphere by convective transport over the Tibetan Plateau, Proc. Natl. Acad. Sci., 103(15), 5664–5669. Garcia, R. R., D. R. Marsh, D. E. Kinnison, B. A. Boville, and F. Sassi (2007), Simulation of secular trends in the middle atmosphere,
1950–2003, J. Geophys. Res., 112, D09301, doi:10.1029/2006JD007485.
Granier, C., et al. (2011), Evolution of anthropogenic and biomass burning emissions of air pollutants at global and regional scales during the 1980–2010 period, Clim. Change, 109(1–2), 163–190.
Harris, E., et al. (2013), Enhanced role of transition metal ion catalysis during in-cloud oxidation of SO2, Science, 340(6133), 727–730. Heald, C. L., D. J. Jacob, R. J. Park, B. Alexander, T. D. Fairlie, R. M. Yantosca, and D. A. Chu (2006), Transpacific transport of Asian
anthro-pogenic aerosols and its impact on surface air quality in the United States, J. Geophys. Res., 111, D14310, doi:10.1029/2005JD006847. Holton, J., P. Haynes, and M. McIntyre (1995), Stratosphere-troposphere exchange, Rev. Geophys., 33(4), 403–439.
Lamarque, J.-F., et al. (2010), Historical (1850–2000) gridded anthropogenic and biomass burning emissions of reactive gases and aerosols: Methodology and application, Atmos. Chem. Phys., 10(15), 7017–7039.
Langner, J., H. Rodhe, P. J. Crutzen, and P. Zimmermann (1992), Anthropogenic influence on the distribution of tropospheric sulphate aerosol, Nature, 359(6397), 712–716.
Li, Q., et al. (2005), Convective outflow of South Asian pollution: A global CTM simulation compared with EOS MLS observations, Geophys.
Res. Lett., 32, L14826, doi:10.1029/2005GL022762.
Lu, Z., D. G. Streets, Q. Zhang, S. Wang, G. R. Carmichael, Y. F. Cheng, C. Wei, M. Chin, T. Diehl, and Q. Tan (2010), Sulfur dioxide emissions in China and sulfur trends in East Asia since 2000, Atmos. Chem. Phys., 10(13), 6311–6331.
Lu, Z., Q. Zhang, and D. G. Streets (2011), Sulfur dioxide and primary carbonaceous aerosol emissions in China and India, 1996–2010,
Atmos. Chem. Phys., 11(18), 9839–9864.
Mills, M., O. B. Toon, R. P. Turco, D. E. Kinnison, and R. R. Garcia (2008), Massive global ozone loss predicted following regional nuclear conflict, Proc. Natl. Acad. Sci., 105(14), 5307–5312.
Neely, R. R., III, J. M. English, O. B. Toon, S. Solomon, M. Mills, and J. P. Thayer (2011), Implications of extinction due to meteoritic smoke in the upper stratosphere, Geophys. Res. Lett., 38, L24808, doi:10.1029/2011GL049865.
Neely, R. R., III, et al. (2013), Recent anthropogenic increases in SO2from Asia have minimal impact on stratospheric aerosol, Geophys.
Res. Lett., 40, 999–1004, doi:10.1002/grl.50263.
Niwano, M., S. Hayashida, H. Akiyoshi, and M. Takahashi (2009), Seasonal cycles of Stratospheric Aerosol and Gas Experiment II near-background aerosol in the lower stratosphere, J. Geophys. Res., 114, D14306, doi:10.1029/2008JD009842.
Park, M., W. J. Randel, A. Gettelman, S. Massie, and J. Jiang (2007), Transport above the Asian summer monsoon anticyclone inferred from Aura Microwave Limb Sounder tracers, J. Geophys. Res., 112, D16309, doi:10.1029/2006JD008294.
Park, M., W. J. Randel, L. Emmons, P. F. Bernath, K. A. Walker, and C. D. Boone (2008), Chemical isolation in the Asian monsoon anticyclone observed in Atmospheric Chemistry Experiment (ACE-FTS) data, Atmos. Chem. Phys., 7, 13,839–13,860.
Park, M., W. J. Randel, L. K. Emmons, and N. J. Livesey (2009), Transport pathways of carbon monoxide in the Asian summer monsoon diagnosed from Model of Ozone and Related Tracers (MOZART), J. Geophys. Res., 114, D08303, doi:10.1029/2008JD010621. Randel, W. J., and M. Park (2006), Deep convective influence on the Asian summer monsoon anticyclone and associated tracer variability
observed with Atmospheric Infrared Sounder (AIRS), J. Geophys. Res., 111, D12314, doi:10.1029/2005JD006490.
Randel, W. J., M. Park, L. Emmons, D. Kinnison, P. Bernath, K. A. Walker, C. Boone, and H. Pumphrey (2010), Asian monsoon transport of pollution to the stratosphere, Science, 328(5978), 611–613.
Smith, S. J., J. van Aardenne, Z. Klimont, R. J. Andres, A. Volke, and S. Delgado Arias (2011), Anthropogenic sulfur dioxide emissions: 1850–2005, Atmos. Chem. Phys., 11(3), 1101–1116.
Solomon, S., J. S. Daniel, R. R. Neely, J. P. Vernier, E. G. Dutton, and L. W. Thomason (2011), The persistently variable “Background” stratospheric aerosol layer and global climate change, Science, 333(6044), 866–870.
Thomason, L. W., and T. Peter (eds.) (2006), Assessment of stratospheric aerosol properties, Tech. Rep. WCRP-124/WMO/TD-No. 1295/SPARC
Report no. 4, Toronto, Ontario, CA.
Thomason, L. W., and J. P. Vernier (2013), Improved SAGE II cloud/aerosol categorization and observations of the Asian tropopause aerosol layer: 1989–2005, Atmos. Chem. Phys., 13(9), 4605–4616.
Thomason, L. W., G. S. Kent, C. R. Trepte, and L. R. Poole (1997), A comparison of the stratospheric aerosol background periods of 1979 and 1989–1991, J. Geophys. Res., 102(D3), 3611–3616.
Thomason, L., S. Burton, B.-P. Luo, and T. Peter (2008), SAGE II measurements of stratospheric aerosol properties at non-volcanic levels,
Atmos. Chem. Phys., 8(4), 983–995.
Toon, O. B., R. P. Turco, P. Hamill, C. S. Kiang, and R. C. Whitten (1979), A one-dimensional model describing aerosol formation and evolution in the stratosphere: II. Sensitivity studies and comparison with observations, J. Atmos. Sci., 36, 718–736.
Toon, O. B., R. P. Turco, D. Westphal, R. Malone, and M. S. Liu (1988), A multidimensional model for aerosols—Description of computa-tional analogs, J. Atmos. Sci., 45(15), 2123–2143.
Turco, R., P. Hamill, O. Toon, R. Whitten, and C. Kiang (1979), A one-dimensional model describing aerosol formation and evolution in the stratosphere: I. Physical processes and mathematical analogs, J. Atmos. Sci., 36(4), 699–717.
van de Hulst, H. C. (1981), Light Scattering by Small Particles, Dover, New York.
Vernier, J. P., L. W. Thomason, and J. Kar (2011a), CALIPSO detection of an Asian tropopause aerosol layer, Geophys. Res. Lett., 38, L07804, doi:10.1029/2010GL046614.
Vernier, J. P., et al. (2011b), Major influence of tropical volcanic eruptions on the stratospheric aerosol layer during the last decade,
Geophys. Res. Lett., 38, L12807, doi:10.1029/2011GL047563.
Whitten, R., O. Toon, and R. Rurco (1980), The stratospheric sulfate aerosol layer: Processes, models, observations, and simulations, Pure

![Figure 2. ATAL representation from the baseline model. (a) The JJA mean 1020 nm extinction ratio averaged from 15 ◦ N to 45 ◦ N to match the representation of SAGE II observations in Thomason and Vernier [2013, Figures 9 and 10]](https://thumb-eu.123doks.com/thumbv2/123doknet/14475186.523065/5.918.329.792.142.790/representation-baseline-extinction-averaged-representation-observations-thomason-vernier.webp)