Publisher’s version / Version de l'éditeur:
Vous avez des questions? Nous pouvons vous aider. Pour communiquer directement avec un auteur, consultez la première page de la revue dans laquelle son article a été publié afin de trouver ses coordonnées. Si vous n’arrivez pas à les repérer, communiquez avec nous à PublicationsArchive-ArchivesPublications@nrc-cnrc.gc.ca.
Questions? Contact the NRC Publications Archive team at
PublicationsArchive-ArchivesPublications@nrc-cnrc.gc.ca. If you wish to email the authors directly, please see the first page of the publication for their contact information.
https://publications-cnrc.canada.ca/fra/droits
L’accès à ce site Web et l’utilisation de son contenu sont assujettis aux conditions présentées dans le site LISEZ CES CONDITIONS ATTENTIVEMENT AVANT D’UTILISER CE SITE WEB.
Technical Paper (National Research Council of Canada. Division of Building
Research), 1963-10-01
READ THESE TERMS AND CONDITIONS CAREFULLY BEFORE USING THIS WEBSITE. https://nrc-publications.canada.ca/eng/copyright
NRC Publications Archive Record / Notice des Archives des publications du CNRC :
https://nrc-publications.canada.ca/eng/view/object/?id=9729075b-737b-4536-8e0a-11bc3d2ea865 https://publications-cnrc.canada.ca/fra/voir/objet/?id=9729075b-737b-4536-8e0a-11bc3d2ea865
Archives des publications du CNRC
For the publisher’s version, please access the DOI link below./ Pour consulter la version de l’éditeur, utilisez le lien DOI ci-dessous.
https://doi.org/10.4224/20358920
Access and use of this website and the material on it are subject to the Terms and Conditions set forth at
Graphical Determination of Temperature Under Heated or Cooled Areas
on the Ground Surface
Ser THl N21-t2 ne . l-53 c . 2 BTG
Reeearch council as a contribution towards better buildiirg in Canada. It rnay therefore be reproduced, without arnend-m e n t p r o v i d e d o n l y t h a t t h e . D i v i s i o n i s a d v i s e d in advance and that full and due acknowledgrnent of this original publi-cation ls always made. No abridgment of thie report may be published without the written authority of the Dlvieion. E x t r a c t s m a y b e p u b l i s h e d f o r p u r p o s e s o f r e v i e w o n 1 y .
Publications of the Division of Building Re-search may be obtained by mailing. the appropriate remit-t a n c e , ( a B a n k , E x p r e s s , o r P o s remit-t O f f i c e Money Order or a c h e q u e m a d e p a y a b l e a t p a r i n O t t a w a , t o t h e Receiver Gene-r a l o f C a n a d a , c Gene-r e d i t N a t i o n a l R e s e a Gene-r c h Council) tothe pub-l i c a t i o n e S e c t i o n , D i v i s i o n o f B u i pub-l d i n g R e s e a r c h , Nationapub-l R e s e a r c h C o u n c l l , O t t a w a . S t a m p i s a r e n o t a c c e p t a b l e .
A coupon eystem has been introduced to rnake paymente for publications relatively simple. Coupona are available in denorninatione of 5; 25, and 50 cente and rrray b e o b t a i n e d b y m a k i n g a r e m l t r
-coupons may be ueed { search Council public Canadian Government Sp"
* F._
' i c a t e d
a b o v e . T h e e e rf all National
Re-acificatione of the
. . - - , o . f d .
NATIONAL RESEARCH COUNCIL CANADA
DIVISION OF' BUILDING RESEARCH
GRAPHICAL DE TERMINATION HEATED OR COOLED AREAS
OF TEMPERATURE UNDER
ON THE GROUND SURI'ACE by
W. G. Brown
Technlcal Paper No. 163 of the
Divlsion of Building Research
OTTAWA O c t o b e r 1 9 6 3
tntroductlon ..
Ternperature Reglme ln the Steady-State
Steady Ternperature Reglme in the Ground Near the
S i d e o f a L a r g e A r e a . . , t . . . . .
Temperature Distributlon Under a Long Strip on the Ground Surface
The Geothermal Gradient
T h e T e m p e r a t u r e U n d e r Rivers, Roads, Streets and Long Baeementless Buildings, Includlng the Effect of the
G e o t h e r m a l G r a d i e n t . . . . . . . . .
Effect of the Temperature Dependence of the Thermal Conductlvity of the Ground . . .. . . . The Steady Temperature Reglme Under a Corner
The Temperature Regime Under a Rectangle . Complex Buildlng Areas and Street Intereectlons
Irregular Areas
T h e T e m p e r a t u r e Regirne Varying with Tirne ... Sudden Change of Surface Temperature on a
Given Area
S t e a d y P e r l o d i c T emperature
Literature sources for Envrronrnentar rernperatures and Geotherrnal Gradlent
Discussion and Conclusion . . A c k n o w l e d g e m e n t s . . . . . . R e f e r e n c e s Appendix A P a g e t 5 5
z 4
6
9
I t l 3 l 5 l 8r g
2 lz 3
z 7
2 8 3 0 3 lGRAPHICAL DETERMINATION OF TEMPERATURE UNDER
HEATEp OR COOLED 4REA,S ON THE_GROUNp SURFACE
by W'. G, Brown
Fleld problems ln englneering often requrre knowledge of the temperature occurrlng ln the ground both before and after pro-poaed alteratlons to the terraln. For thie purpose mathematlcal
e;qrreaeions have long been avaLlable, but theee are usually extremely complex and often require a conelderable mathematlcal background on the part of the user. More recently attempts have been made, notably by Lachenbruch (5), to put the content of the mathernadce lnto applled terms for the beneflt of ueers wlthout advanced
mathematlcal trainlng. The present work ls intended to carry thls procedure further by offerlng graphical means for deterrnlnlng temperatureB in the ground.
A great many englneerlng and geologlcal probleme ln_ volwlng the temperature in the ground can be eolved by graphical methode, Thts study now reported deals wlth natural or engtneerlng structures lylng dlrectly on the ground eurface, and lncludes the following:
l) Shallow lakeg and rivers on unfrozen or fr ozen soll (permafrost),
Zl Basementless buildings, either heated or c o o l e d ,
3 ) I c e r l n k e ,
4 I C i t y s t r e e t s a n d s t r e e t l n t e r s e c t i o n s bordered by bulldlngs,
5) Roads and runways.
In all of these problems the ternperature tn the ground under and about the structure depends on the surface shape and area
covered by the structure and on the temperature of thie area,
together with the temperature of the rernaining ground surface and
the geotherrnal gradient for the reglon. Thus, for exarnple, the
ternperature in the ground under a flat bullding or lake would be dependent on the surface covered and on the terrrperaturea at which the building or lake and the external ground surface are maintalned, (the geotherrnal gradlent ls a permanent feature of any reglon, being the vertlcal ternperature gradient in the ground due to heat dlssipation frorn internal regions of the earth).
In additton to dependence on the surface conditions,
the ground ternperatures may or may not be time-dependent; for
lnstance, ln the case of a bullding, the inslde temperature rernalns
approxlmately constant whlle the ternperature at the ground surface
outBide varles durlng the year, and indeed, also dally. sirnllarly, when any structure is fl.rst put tnto operatlon there le always a tlrne lag before condltlons become steady. where there Ls freezlng
ln the ground, as ln structureB or areas lytng on permafrost, the
latent heat of freezing plays a part when time dependence le
lnvolved' and differences in the therrnal conductivlty of. the frozen and unfrozen soil occur in the steady situatlon.
Before attacklng problerns ln this field it would be well to establlsh a guide for the circurnstances ln which temperature6 carl
be expected to be either steady or time-dependent. To do thle,
consider a reglon of terraln ln middle ratitudes devoid of all
aur-face structures. Under the actlon of clirnate, rnalnly as evidenced
by air ternperature, the ground surface ternperature varies
cycllcally frorn year to year. This cycllcar variation, which is
approximately einusoidal, is imparted to the ground wlth an
arnplltude which decreases with increasing depth until, at about
3
-the year, its value being referred to as -the trrnean annual temperature. rt * In the absence of a geothermal gradient and aesumlng a constant apparent conductlvlty for the ground through-out the year, this mean annual ternperature is equal to the average
temperature at any depth, lncluding the ground surface. Considerlng
next a heated or cooled structure on the ground surface, it ls clear that the temperature under the structure at dlstances greater than about 30-50 ft from lts edges wlll be independent of annual weather variatlons and wlll depend only on the temperature of the structure, the geotherrnal gradient and the mean annual temperature of the
undlsturbed ground. Similarly, daily temperature cycles penetrate
only I or 2 ft lnto the ground, and their effects for depthe greater than thls can be neglected.
The magnltude of the times lnvolved in different problems is the next conslderation. In reglons of permafrost, for exarnple, times are geologic, that is, of the order of hundreds or thousands of years. under this circumstance it is reasonabre to assurne, in many cases dealing with rlvers and lakes, that
eteady conditiona are approached (exceptlng wlthln about 50 ft of t h e s u r f a c e ) , p r o v i d e d o f c o u r a e t h a t the position of the bodles of water does not change. An example involving long, but less than g e o l o g l c , t i m e s l s t h e t e r n p e r a t u r e regime under a clty. 'where buildlng sltes are rnore or less permarlently occrpled or where v e r y o l d b u l l d l n g s a r e l n v o l v e d ( 1 0 0 yearB or rnore) the
temperature between 30 ft aud about r00 to 200 ft deep tends to take on the steady-state value, and if the clty ltself is several centuries old the ternperature at depths of about I00 to zoo ft
As equatorlal reglons are approached, the depth at which rhe t e m p e r a t u r e l s c o n s t a n t b e c o m e s progressively less.
tends to take on a value nearly equal to the average temperature of the ground surface, including both covered and uncovered areas, The ehortest times of. ptactical lntereet are those of srnall
individual buildings, where several years are involved after the beglnning of heating or coollng before the ground temperatures
adjust to the new condltions and become steady-periodic followlng
the annual weather cycle. The effects of frost-heave under cooled
buildings lyitg on frost-susceptible soils are often not observed until after eeveral years of operatlon. Lr a few situatlons, it rnay aleo be of interest to account for dally arnbient temperature changes (diurnal
cycle). These considerations ernphasize the dependence of the times
i n v o l v e d o n t h e p a r t i c u l a r problern being considered.
All of the above aspects of heat transfer ln the ground can be treated at present by exlstlng mathematicar methods which,
how-everr are often formidable in appearance. These rnethods rely
intrlnslcally on the so-calred 'rnathematical principle of
super-position, Itwhich really means no rnore ln fact than the direct
additlon of partlal effects. Thus, for exarnple, the temperature
u n d e r a h e a t e d o r c o o l e d area can be treated ae the surn of three s e p a r a t e t e m p € r a t u r e s : ( I ) t h a t r e s u l t l n g f r o m keeplng the area at ,o "F higher or lower than the ternperature of the remaining
ground surface; l2l the amount by whlch the temperature ls higher
than that of the outside surface due to the geotherrnal gradlent; and (3) the actual temperature of the outslde ground surface, Ae thls process of summation is algebraic it can be carrled out graphically
or arithrnetically without the necessity of mathernatical formulae.
For that rnatter, the graphical procedure can be carried out without
recourse to mathematics any rnore complicated than sknple
arlth-m e t i c .
5
-graphical rnethod, for which, to ensure clarlty, examples will be
confined mainly to steady-state situations. The method to be uaed
when temperaturea vary wlth time is very elmllar and will be
consldered ln the concluding remarks. Development will begin
with the elernentary ternperature reglrne under the edge of a large, flat aurface, and then combine two or more such regrmes !o form the sltuation under parallel strlps such as rlvers or streets. More complex areaa wlll then be treated, as wlll the dependence of the thermal conductlvity on temperature (for example, frozen and un-frozen ground have dLff.erent thermal conductlvity).
TEMPERATURtr &FGIME IN THE STEADY-STATE
The derivations in the folrowlng sectlone are based on the
elementary equatlon of steady-state heat transfer. Thrs rs:
w h e r e :
Q = - k e A T ,
nG;
h e a t t r a n s f e r r a t e , B t u p e r hr,
thermal conductivity of the ground, Btu per h r p e r s q f t p e r d e g F per ft,
area in sq ft parallel to lines of constant t e m p e r a t u r e ,
ternperature difference in deg F between
two points An ft apart along the norrnal to lines of constant ternperature.
S T E A D Y TEMPERATURE REGIME IN THE GROUND NEAR THE
qIqE oF A
LARGEmIn the situation illustrated in Flgure l, a large prane area -for example, a shallow lake with a straight shorellne - is maintained at a teSnperature Tr, while the ground surface is at temperature Tr. The thermar conductlvity of the ground ls assurned to be everywhere c o n s t a n t a n d t h e r e is no geothermal gradient" Because of the
( r )
o
k
s)rrnmetry of the problem it will be recognlzed lmmediately that heat will flow along circular paths from the lake to the ground sur-face, while ieotherms (lines of constant temperature) extend
radially outward from the edge of the lake with equal temperature
differences being equally epaced in the tangential direction. Thus,
for example, the temperature directly under the edge has a value
halfway between those of the lake and the ground surface. The
numbers ln brackets in Figure I are the actual temperatures that would result with the lake at 39'F and the ground eurface at 30"F. (An identlcal situation would occur wlth a large, flat bullding except
that the temperatures would be different. ) That the ternperature
distrlbutlon actually satisfies Equation (l) is readlly seen, for e
must be constant along the heat flow path, and this is true, since both An and AT/An also remain constant along the same path.
Flgure I shows that all ternperatures in the ground are equal to the ground surface (base) ternperature T1 plus a fractlon
o f t h e t e r n p e r a t u r e d i f f e r e n c e ( T Z - T l ) . S e t t l n g 1tr-Tr) = , o
the temperature distribution could just as well have been
deter-mined as ln the idealized situatlon of Flgure z, where the base
temperature T', must be added to arl the temperature values shown
to glve the actual temperatures.
In the following sections
t e m p e r a t u r e w i l l b e assurned to be s u c h a s T ^ - T , w l l l b e r e f e r r e d t o
4 I
actual temperature at any locatlon
t h e b a s e t e m p e r a t u r e T , .
the external ground surface
0 " F , a n d t e m p e r a t u r e d i f f e r e n c e e
s i m p l y a s t e r n p e r a t u r e s . T h e
can then be obtained by adding
TEMPERATURE-DISTRIBUTION UNDER A LONG STRIP ON THE
GROUND SURFACE
edge of a very Large area on the ground surface. The next area to
be considered is that which forms a long strip on the surface. It
will be shown how the temperature distribution for this situatlon
is obtained by the superposition or addition of the temperature r e g i r n e s u n d e r t w o l a r g e p a r a l l e l a r e a a . T h e p r o c e d u r e ls
illustrated in Figure 3 and consists sirnply of laying two repllcates
of Figure 2 (one reversed) one over the other, with the distance between edges corresponding to the width of the strip (rlver, street,
etc. ). The resutting temperature at any point under the strip is
then the sum of the temperatures due to the two large separate areaa
(this is the superposition principle). To obtain the new lines of
constant ternperature, join the points of intersection of the
temperature lines emanating from the two edges that have the same
s u m ; f o r e x a m p l e , t h e l n t e r s e c t i o n o f the 0.8 yo and 0.4 vo t e r n p e r a t u r e l i n e s a n d t h e 6 . 9 vo and 0.3 vo lines gives two p o i n t s o n t h e L . 2 v o c o n s t a n t t e r n p e r a t u r e l i n e u n d e r t h e s t r i p . It will be seen that the summation procedure at the surface results in a temperatur e of 2 ,o on the strip and a temperature of vo
on the remainlng surface" The isotherms in this partlcular ca6e are
p e r f e c t c i r c l e s p a s s i n g t h r o u g h the edges of the strip. (The centres of these circles can be found independently by marking off angles of
9 deg, i. e. t/rc or. a right angle with a protractor praced at either
edge of the strip and projecting the radii back to cross the centreline of the strip. )
In order to obtain results ln a forrn similar to that of F i g u r e 2 , w h e r e t h e g r o u n d surface temperature is taken as 0"F, vo rnust be subtracted frorn all ternperatures in Figure 3. This gives
Figure 4, where, to obtain the actual temperature, the base
temperature T, must be added at all points. (The numbers in
brackets are the ternperatures which would be obtained, say, with a rlver ternperature 9"F higher than the surrounding surface
ternperature, Il, as in Figure I, the ground surface is at 30.r', then 30"F ie added to the bracketed nurnbers to obtain the actual t e m p e r a t u r e s . )
The 'graphical method of plottlng a given rsotherrn pro-ceeds rapidly when it ls noticed that adjacent points on it lie on
the opposite corners of quadrilaterals (dotted regions ln Figure 3).
In practlce, the entire procedure is best handled by maklng coplee
of the basic temperature distributions (in this ca6e Figure z) on
traclng paper' laying them one over another, and obtaining the flnal graphical result on another sheet of tracing paper.
Before accounting for the geotherrnal gradient in the earth lt should be noted that the above process of summatlon can agaln be
u s e d i f m o r e t h a n o n e strip is present. Furthermore, t h e
ternperatures of the strips rnay be different, so that the effect of a
number of narrow strips lying side by side can be surnmed, thereby
obtainlng the temperatures under a larger strip with varlable
ternperature. The ternperatures resulting from two nearby strips
o f d i f f e r e n t w i d t h s at the same temperature vo, e.E. t two rivere or roads, are -given in Figure 5a, and the temperature6 reeulting from the same strips at different temperatures are given ln Figure 5 b . I n t h i s c a s e t h e p o i n t s on the isotherms are defined bythe
intersections of circles about the two basic strip areasc AdJacent
points again lie on the opposite corners of quadrilaterals, which
are now curvilineal. (To avoid encumbering the drawing only a
few of the basic circular isotherrns are shown. ) Reviewing the
procedure, it will be seen that Figure 5 has been obtained, in
effect, by superirnposing the simple situation of Figure z on itself
t h r e e t i r n e s . T h e t e m p e r a t u r e s r e s u l t i n g from vo = !"F are
9
-be noted ln pasalng that the lsotherms obtalned in thre slmple problem already shov/ the distortlons characterlstlc of rnany situatlone ln the fleld. rt should aleo be noted that there ls no restrlctlon on the stgn of vo, that ie, Tl may be greater than Tras would be the caae wlth ice rlnks or cold etorage bulldings. THE GEOTHERMAL GRADIENT
Even in the absence of structures on the surface there
exlste in the ground a temperature gradlent due to heat generatlon
ln the central core of the earth. In generar, the rnagnitude of
thls gradlent in the vlclnlty of the ground surface depends on the
homogeneity of the ground and on ground therrnal conductiwlty.
For a hornogeneous materlal, as hae been assurned, however, the
ternperature varlee linearly with depth. lf the entlre ground
surface is everywhere at temperature 0"F and the geothermal
gradient ls GO degrees per hundred feet of depth, then the
temperature reglme ln the ground would appear as in Flgure 6
where lt ls agaln understood that T, must be added everywhere to obtain actual ternperatur es.
T T: r
LONG BASEMENTLESS BUIE=Yg:_P5AI
gBE lJ ryDE
R R IvE RS, R oAps, s rRE E rs ANp
T The value of GO varleshundred feet of depth as shown by the field.
* The rnethods given
Werenski.old (9) in
b e t w e e n l / 2 " F a n d 2 o F p e r
ternperatur e rneasurernents in
OT' THE GEOTHERMAL GRADIENT J,<
It wtll be noted lmrnediately that tf the temperatureg at
all points ln Ftgure 6 are added dlrectly to those at the
here appear to have been first used by eetimatlng temper atur es in fjorde.
correspondlng polnte in Figur es Z, 4 or 5 the surface temperature o u t s i d e t h e a r e a u n d e r c o n s i d e r a t i o n r e r n a i n s a t z e r o and that of the area lteelf remalne at vo ; at the satne tlme the
temperature increases contlnuarly with depth in accordance with the requlrernents of the geothermal gradient. Thls represente the
complete general problem of steady-state ternperatures under a^ strip area on the ground surface.
Before addlng the temperature effect of the geothermal gradient it is a simple matter to ensure that the final isotherms take on the values of sirnple declrnal fractions of ,o , To do this the depth in the ground should be determined at whlch the temperature resultlng from the geothermal gradient alone has the value vo, that ie, z = 100 ,o/Gotti thts distance ls then sub-dlvlded lnto slmple decimal fractlons. Lines should then be drawn parallel to the ground surface at these locations, and
l a b e l l e d a s 0 . L o , 0 . 2 v o , e t c . , p r e p a r a t o r y t o s u p e r r m p o s r t r o n of the temperature resulte obtained ln the prevlous sections.
Two examples of strlp areas for the condltlon" ,o = l 0 ' F a n d G - = I " F / I 0 0 L.I f t lZ = 1000 ftl are given l.n Flgure Z, the first representing, perhap6, a river 1000 ft wlde, and the
second corresponding to a smaller river (or road) wlth the aame GG, or to the same river (1000 ft wide) with a srnaller varue of G6r or also, to the aame river (1000 ft wide) with a larger value of vo. In order to avold encurnbering the drawlngs, only two or three of the basic lsotherms from Figure 4 (clrcres) and for the
geothermal gradient (horlzontal lines) have been included. The s u m o f t h e t e m p e r a t u r e s d u e to these two sets of temperature llnes at the few points of lntersection shown rnay be seen to equai. the value of the isotherm for the combined eltuation.
t I
-The problem of determinlng the poeltlon of the 32"F (freezing) leotherrn under a rlver Ioo0 ft wide ln an area of perrna-frost will now be considered. If the rnean annual temperature at the surface of the ground T, ls, a?y, 25'E and the mean
temperature of the rlver bottom is 35"F, then yo = 35 - 25 = 10"tr'. fr Gn = L"F/l0o ft, the conditions are'the sarne as those-U of Flgure 7a and the posltion of t]ne 32" tr' isotherm ls found from t h e f a c t t h a t v = 3 2 - 2 5 = 0 . 7 vo. ( I t s h o u l d b e n o t e d that v le always the difference between a given ternperature and the base ternperature. ) l'or thls eet of conditlons a rarge reglon of
un-f r o z e n g r o u n d l s t o b e un-f o u n d under the rrver. l f r l w e r e z z . 4 F w l t h t h e r i v e r a t 3 2 . 4 " F , then v = 32 - 22.4 = o.96 vo , and the unfrozen ground under the rlver would form a double prlsrnoidal region as shown in the flgure. These examples lllustrate the critical nature of the environrnental ternperatures (includlng the geothermal gradlent) in deterrnining the posltlon of the freezLng plane ln the ground.
Turnlng now to Flgure ?b, whrch may be considered to represent a smaller rlver, a road, or long basementless bulldlng, i t l e a g a i n a s s u m e d t h a t G G = l"f'/100 ft and vo = lOop. Under these conditlons the wldth of the strip in the flgure corresponde to a width of 100 ft in the field" The positlon of a given {sotherm under lhls smaller structure ls deterrnlned as before. It wlll also be noticed that wlth the srnaller strip wldth the lsotherrng near the surface tend to be simllar to those of Figure 4. con-sequently, exact knowredge of the geothermal gradient is not extremely knportant for smaller structures.
EFFECT OF THE TEMPERATUB.E DEPENDENCE OF THE THERMAL
to a greater or lesser extent on the absolute temperature. For soil, the thermal conductivity may also be as much aa z0 per cent,
or more, higher when frozet:- than when unfrozen (l). Although
the problem of accountlng for the temperature dependence of k
might be ercpected to be compricated, such ls not the caae: the
following substltutlon * ls rnade:
v=lr J"'
where k, and k are the thermal conductlvltles at the base
tempera-ture T, and at the varlable temperatempera-ture T. From Equatlon (z) v rs
simply the area under the curve ot k/kr plotted agarnst, temperature
dlfference y = T - Tr. Also, at the ground surface, the
geo-therrnal gradlent GU ln terrna of V is equal to GO.
An example of thle ls the rlver shown ln Flgure ?a, wlth T l = 2 5 " F , T r = 3 5 ' t r ' ( r o = l O ' F ) a n d G O = G V = I ' F / 1 0 0 f t a t t h e
ground Burface. For slmplictty it ls assumed that the thermal
conductivlty of frozen ground ls constant at k, and that the thermal c o n d u c t i v i t y o f u n f r o z e n g r o u n d ts 0.833 kl, i. e" , a zo per cent lower value.
( z l
F r o m V = o = and the value ofV = E q u a t l o n ( 2 ) :
*
" 1
f - o n
p z z5l + 0.833 k, (35
-L ' ,
7 + 2 . 5 = 9 . 5 " F , V c o r r e s p o n d l n g t o t h et
[u, pz - zilf
3r)l
3 2 " F i s o t h e r m l s = 7 " F = 0 . 7 3 2 V o .1 3
-To complete the problem, the procedure used in obtalning Figure 7a 7e repeated noting, however, that the depth at whlch the
ternperature due to G.,n atone is 9.5"F is now 950 ft.
In Flgure 8 the 32"F isotherrn for the condrtions above ls cornpared with that assumlng k everywhere constant. The dlfference in posltion of the two lines ls quite small for the glven b o u n d a r y t e m p e r a t u r e E . F o r t h e c a 6 e w h e r . T l = Z Z . 4 I . ,
T z = 3 2 . 4 " F ' ( v o = l 0 " F ) a n d G G = l " F / 1 0 0 f t , t h e p o s i t l o n s o f the two llnes were found to be practically indistinguishabre.
I'r reality the thermal conductlvity of soil does not make a complete change at 32"F because all water present does not f r e e z e a t 3 2 " 8 . M a k i n g u s e o f t e s t r e s u l t s f o r t h e percentage of unfrozen rnoisture in a sllty clay soil frorn an actual reglon of
permafrost in northern canada (3) the approxlrnate variatlon of
conductivity with temperature was calculated using a forrnula
given ln reference (zl. when thls was lnserted lnto Equatlon (z)
the results were lndistinguishable frorn those assuming a uniform
20 per cent hlgher value of k for temperatures less than 32"F. THE STEADY TEMPERATURE REGIME UNDER A CORNER
The examples of ground temperature' whlch have been
considered were confined to heat flow in two dirnensions, that is, to situatlons where the temperature does not vary in the
direction of a parallel strip or strips on the ground surface. It
h a s b e e n n o t e d how the steady temperature under areas on the ground surface can be determined by very sirnple graphical meana. up to this point the steps folrowed consisted only of drawlng very simple systems of lines on tracing paper, raying the sheets of paper one over another, and locating and joining the intersections
of the llnes whlch then represent lines of constant temperature in the ground.
The next problem to be considered is the ground
temperature distribution where the temperature reglrne is
three-dimensional. The first example ls the corner of a large
rectangular area lyhg on the ground surface, whlch, when co[r-bined with other slmilar corners, will yield the temperature distribution under basementless buildlngs" lce rlnks, and under s t r e e t l n t e r s e c t i o n s .
As in Figures I and 2, lsotherms under the rectangular corner (Flgure 9) radiate linearly from the apex of the corner but are no longer unlformly spaced, the spacing belng dependent on the dlrectlon frorn whlch the corner ls viewed. To avord thrs
complication attention should be confined to the plan view as in Figure l0 where the temperature regime is given in terms of. x/z and y/2" with x and y being coordinates ln the horlzontal directlon a''d z the depth. (The equatlons of the lsotherrn curves ln the flgure are given ln Appendix A for any corner angle. The com-p l e t e t h e o r y i s g i v e n i n r e f e r e n c e ( 4 ) . )
The ground surface, or boundary ternperatures, in
F l g u ' r e l 0 a r e t r e a t e d i n the same way as those for the strlp considered prewiously, that is, with y = 0 on the ground surface o u t s i d e t h e c o r n e r a n d vo = (Tz-Tr) inslde the corner. B y w a y of example ln determlning the ternperatures at a depth of z = 30 ft, all x and y distances in feet are exactly 30 times the scale dirnensions in the flgure, i. e. at the point indicated, x/z = B, y / r = 7 , w h e n c e x = 8 x 3 0 = 2 4 0 f t a n d y = ' l x 3 0 = Z l O f t . T h e temperature at this particular location is y = 0.-? vo in the absence of the geotherrnal gradient. with a geotherrnal gradlent
t 5
-present, all temperatures at the depth the amount GO *
,*9 as ln the earlier
z = 3 0 f t a r e l n c r e a s e d b y examples.
THE TEMPERATURE REGIME UNDER A RECTANGLE
Just as the temperatures under the strip area were obtalned by superlrnposlng and adding the temperatures under two large parallel areas, the same method can be used to obtain the ternperatures under a rectangle by superirnposlng the temperatures under corners. tr this instance, however, the procedure of
superposition must be carried out three tlrnes to obtaln the temperature distributlon. The reason for this is seen by
r e f e r r i n g t o F l g u r e I l a . I f t h e t w o c o r n e r s a r e s u p e r i m p o s e d a e shown and the temperatures at the ground surface are added, the temperature on the rectangle le 2 ro, and the remaining area of the ground surface is divided lnto two segrnents at temperatures 0 and v^. To ensure now that the entire ground surface outside
o
the rectangle ls at constant ternperature vo two rnore cornerB rnust be superirnposed as in Flgure lIb. The result ls a rectangle, lying on the ground, with surface ternperature Zvo and surrounding surface ternperature of vo.
By way of example, conslder how to obtain the ternpera-ture distribution 15 feet deep under a square area wlth 150-ft
sides. such an area mlght represent a commerclal building or a curling rink, The dlagonal of the square is 150 1fr * long.
P r o c e e d i n g n o w t o F i g u r e 1 0 , a s c a l e d i s t a n c e c '
, r x l z = - l 3 _
I L 5 o \ l z=
14.L4 on the x/z axls is measured off to obtain the position of the opposlte corner of the square area. Using this point as apex
a r e v e r s e d d u p l i c a t e o f F i g u r e I 0 d r a w n o n t r a c l n g paper is super-irnposed thereon and the points of intersection of isotherrns having
t h e e a m e 6 u ' n a r e j o i n e d . ( T h e a a m e p r o c e d u r e i s u e e d as that of developlng Flgure 3 except that the horizontal plane is used
lnetead of the vertlcal. ) on completlng thls lnterrnedlate set of
lsotherms, which corresponds to the condltlons of Flgure lla
the procedure ie repeated using Flgure l0 except that thle tlme an x/z distance of I4. l4ls rneaaured off along the negatlve axie and two corners correapondlng to the upper and lower corners of I ' l g u r e l I b a r e s u p e r i m p o s e d . W h e n t h e n e w s e t o f i n t e r
-rnediate isotherms has been obtained on tracing paper they are euperirnposed on the first set and agaln points are joined to
obtaln the flnal temperature distrlbutlon. The result ie glven ln
Figure I2 where the value vo has been subtracted from all
temperaturea resultlng in boundary temperatures of ,o and 0
on the surface. The temperature due to the geothermal .gradlent
can now be added to obtain the temperatures that would occur in
practlce.
If the floor of the bullding ls malntained at 70"F and
the mean annual ground surface temperature rs 4g"F, then vo
= 70 - 48 = 22"F. The ternperature at a depth of Ls ft due to Go = l " F / L 0 0 f t ls 0. 15"tr'. The resurtant temperatures for these conditlona are all glven ln Flgur e LZ. Had the building been an lce rlnk or cold storage warehouse with a floor ternperature of, s a y , 2 0 " F t h e n v o = 2 0 - 4 8 = - / g o p . T h e r e s u l t a n t t e m p e r a t u r e s for thls conditlon lncluding the effect of Go are aleo given ln
tr'igure 12.
Although thls last exarnple waa concerned wlth a depth of 15 ft under a aquare aTea with 150-ft sldes it wlll be rearrzed
that exactly the aarne temperatures would occur (in the absence
1 7
-80-ft square, that is, whenever the ratio of depth to side of square has the value 0. l. Furthermore, the effect of thermal conductivity varying with ternperature can be accounted for exactly as was done for the example of a river dlscussed earlier. For other ratioe of depth to side for any rectangular area the entire graphical procedure would be repeated as above.
To obtain the entlre ternperature distrlbution in the ground is often not the main objective, often rt is more lmportant to know the temperatures at a given polnt. In this case lt is oply necessary t o s u l n d i r e c t l y t h e t e m p e r a t u r e e f f e c t s d u e t o e a c h of the basic areas of which our given area is composed. For example, the square area treated above was formed frorn four corners, the centre of the square being at a distance of x/z = ?.0? units along the dlagonal. Entering Figure l0 viith thls dlstance on the plus and minus x/z axls for each o f t h e f o u r s u p e r l m p o s e d corners the resultlng temperature is found t o b e , r . 0 . 8 9 5 v * 0 . 8 9 5 v ^ + 0 . 0 2 y ^ * 0 . 0 2 y = l . g 3 v , o ' o W l t h t h e
o o o
h e l p o f F l g u r e l l i t ts recalled that the outside surface ternperature is now at vot hence in the absence of a geotherrnal gradient the actual t e m p e r a t u r e a t t h e c e n t r e o f t h e s q u a r e i s ( 1 . 8 3 _ l) yo = 0.83 vo higher than the outside surfaie temperature as in Figure lz.
* ReProduction has necessitated drawing only a few of the isotherrnE i n F i g u r e 1 0 , c o n s e q u e n t l y the procedure cannot be carrled out h e r e w i t h p r e c i s i o n " T h e i n t e r e s t e d r e a d e r c a n obtain a palr of
2 4 - b y 2 6 - i n . d u p l i c a t e s of Figure 10, one on traclng paplr, uy remitting $+. oo by rnoney order or cheque made p"y"fr.
at par in Ottawa to the Receiver General of Canada credtt National Research Council- The rernittance should be sent to the publicatlons Section, Division of Building Research, Nationar Research council, ottawa, Ontario. These enlarged graphs show the isotherrns for incrernents o f 0 . 0 1 v ^ a n d O . O Z y ^ a n d m a y b e u s e d t o obtaln an estimate of t h e s t e a d $ t " * p u t a t u r % s ; ; ; ; " s r r u c t u r e s , s u c h a s b a s e m e n t r e s s b u i l d i n g s o f v a r i o u s shapes, or under street intersections.
COMPLEX BUILDING AREA.s AND STREET INTERSECTIONS
Having obtained the temperatures under a rectangular
area, superimposition and summation will yield the ternperature
under irregular area6 with right-angled corners; for example, as
i n F i g u r e l 3 a w h e r e t h r e e a d j o i n i n g rectangles are superirnposed to forrn a complex building areai or in Figure l3b where three nearby areas contribute collectively to the ground temperature. r n F i g u r e 1 3 c t h e t e m p e r a t u r e u n d e r the area forrned by_two
adjoinlng squares is shown. The isotherrna in thls ca6e .were
obtalned dlrectly by superlmposing a copy of Figure 12 on itself,
hence they correspond to a depth which is ln the ratio of 0. I
to the side of the squares (the lnfluence of G^ has not been added). A s l m p l e s t r e e t i n t e r s e c t l o n a s i n F i g u r e l 3 d i s c o m
-posed of four corners; it is assumed that the area adjacent to the
intersection is entlrely covered by buildings. For condltlons ln
Southern Canada the rrrean annual temperature of the surface covered
by buildings will be about ?0"F whlle that of the streets wlll be
about 40'F to 50"F. For a street width of.66 ft and a depth of
33 ft the temperature at the centre of the intersection, for example,
is obtained by entering Flgure l0 on the negative x/z axis wlth the
v a l u e 3 3 V 1 2 / 3 3 - 1 . 4 I 4 a n d o b t a i n i n g t h e t e m p e r a t u r e v = 0 . 0 9 v o .
slnce four corners contribute equatly at this point the reeultant
t e r n p e r a t u r e i s 4 x 0 . 0 8 v o = 0 . 3 2 v o hlgher than the street
t e m p e r a t u r e . T a k l n g , o = 7 O - 5 0 = ZQ.F glves y = 0.32 xZO
= 6 . 4 " F " A t t h l s d e p t h t h e i n f l u e n c e o f G G = l " F / l O O f t i s 0 . 3 3 ' . 8 .
with r, = 50oF, the actual ternperature 33 ft deep at the centre ofL '
t h e t n t e r s e c t i o n w o u l d b e 5 0 + 6 . 4 + 0 , 3 3 = 5 6 . ? . F .
For areas bounded by straight edges but with corner
_ 1 9
-equally well. The basic isotherms, however, for these, cornera (slrnilar to those of Figure l0) must first be obtatned uslng the slmple equations glven in Appendix A, sectlon l.
I r r e g u l a r A r e a s
Except for bulldlnge, rnost of the problerns whlch w111 be rnet in the field are concerned with lrregular areaa such as lakes and rivere. Such surface areaa frequently occur ln groups, and although the methods given above could be applled by dlvtdlng the whole area into rectangular sectlons and surnrning the
ternperature effects due to each eection, lt will be reallzed that this procedure would be lrnposslbly tedious. To avold thls
dlfflculty a rnethod which conslsts of subdivtdlng the area lnto s e c t o r s o f a c l r c l e l s u s e d .
For the steady situatlon, Lachenbruch (5) gives an e>cpresslon (Equatlon (2) ln Appendtx A) for the temperature at any depth z under the apex of a clrcular sector having radiue R and angle e degrees, Thls e>cpression le plotted in Flgure l4 as curve o w h l c h r e l a t e s the term 3 6 0
i, f, to the ratlo of aector
radlus to depth R/z (the other .rr"r.3" ln Figure L4 are of no corr-cern here, as they are for the case of tlme dependence whlch will be discussed in the next sectlon). As ln all prevloue consideratlone, the sector area ls assurned to be at ternperature yo and the
rernaining eurface at zero ternperature. In passlng lt should be n o t e d t h a t f o r v e r y l a r g e R a n d 0 = 90" the value of v = O.25 vo obtalned from Flgure l4 ls the same as the value obtained frorn F l g u r e 1 0 .
The rnethod of uslng Flgure l4 can be illuetrated by an exarnple. If the problem is to determine the ternpera.ture at a
depth of z = 100 ft under the apex of a clrcular eector of radius R = 7 0 0 f t a n d a n g l e 0 = 3 0 ' , t h e r a t i o R / z = 7 O O / I O O = ? i s f o r m e d , and from curve 0 the correspondlng value of
# * ls found to o
b e 0 " 8 6 . H e n c e
v = 0 . t ,
#
, o = 0 . 8 6 * #
, o = 0 . O 7 Z v o .
I f t h e t e m p e r a t u r e o f t h e c l r c u l a r s e c t o r w e r e , E ? y , Z 0 " f ' h l g h e r than that of the surrounding ground surface then the temperature at t h e p o l n t i n q u e s t i o n w o u l d b e 0 . 0 7 2 x z 0 = r . 4 4 " F hlgher than the
ground surface temperature in the absence of a geothermal
g r a d l e n t . w i t h G G = l " E / L O o f t t h e t e m p e r a t u r e w o u r d b e I * r . 4 4 = 2.44" F hlgher than the ground surface temperature, and if the ground surface were rnaintalned at, aay, 47"8 then the actual t e m p e r a t u r e a t t h e p o i n t w o u l d b e 4 7 + 2 . 4 4 = 4 9 . 4 4 I . .
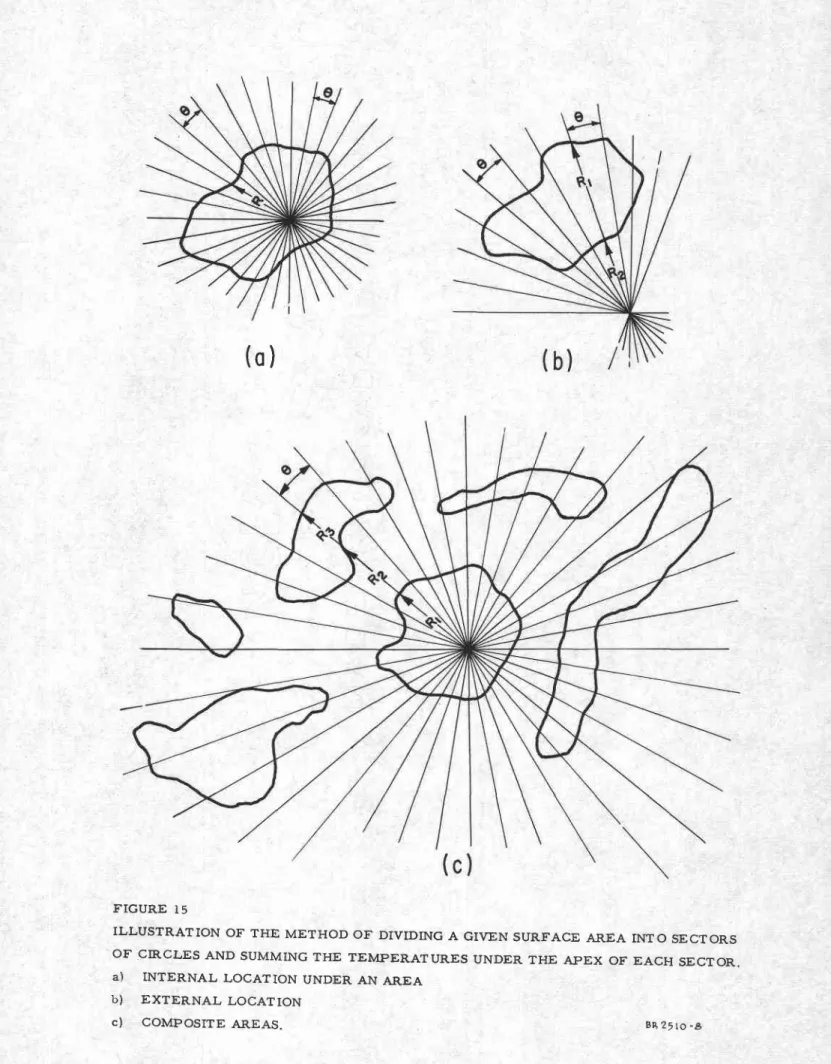
If now any glven surface area, such ae that in Flgure l5a, is subdivided into circular sectors each with the same angle e, only the ternperature effects due to each sector need be summed in order to obtain the resultant temperature at any polnt under the apex. In thls case the radlus R is lhe horizontal dlstance frorn the point ln questlon to the edge of the area. For locatlons in the
ground outside the area (Flgure I5b) it will be teaLized that the resultant temperature ls obtained by subtracting the temperature effects due to the sectors with radlus R, from those wlth radlus Rr. F o r h i g h l y c o m p r e x g r o u p s of areas such as those of Frgure l5c, whlch rnlght represent a group of lakes, or a nurnber of irregularly
shaped buildings, this procedure is extended naturally to include all radir extending to the boundaries of the areas ln questlon.
Two procedures are now available to determine the total temperature effect of all circular sectors. The flrst ls the completely graphical method of Lachenbruch, which consiets of a
z t
-chart subdivided into small area segments, each of whlch rnakes the sarne contribution to the ternperature. This chart ls
repro-d u c e repro-d a t a m u c h r e repro-d u c e repro-d s c a l e i n F l g u r e I 6 . T o u s e l t , t h e glven area ls drawn to the proper scale and superlmposed, and the nurnber of area elements enclosed by lt are counted. The nurnber of elernents enclosed divlded by I000 ts equal to the temperature under the centre of the chart as a decknal fractlon of v^ . To obtain the ternperature at a different depth z, It Le
o
necessary to draw either the area or the chart to a different s c a l e . F o r s i r n p l e a r e a s s u c h a s r e c t a n g l e s t h i s p r o c e d u r e presents no difflculty, but for cornplex and irregular areas lt would generally prove time -consuming.
The second rnethod of obtaining the temperature conslsts of rneasuring the varlous radil for all sectors as ln Flgure I5 then dividing each by the depth z and entering Flgure 14 (curve 0) with each value of. R/z to obtaln -A-
+ These values {e then summed arithrnetlcally and thelr total.
0 r o multiplied by
360 to obtain the resultant temperature. Wlth t h i s p r o c e d u r e , a s i l l u s t r a t e d i n T a b l e I , i t i s n e c e s s a r y to make only one set of measurements of radil for all depths
z "
It will be noted that the isotherms for irregular areas cannot be mapped dlrectly by graphs as was the case for areas of r e g u l a r s h a p e . F o r i r r e g u l a r a r e a s i t w o u l d b e n e c e s s a r y t o
obtaln the temperatures at a nurnber of points by the methods above and then determine the position of lsotherms by lnterpolatlon.
THE TEMPERATURE REGIME VARYING WITH TIME
T h e s t e a d y t h e p r e v i o u s s e c t i o n s , t e m p e r a t u r e s , w h i c h a p p l y t o l a r g e a r e a s h a v e b e e n o b t a i n e d in o n t h e g r o u n d surface
whlch have been subjected to heating or coollng for long perlods
of time. The steady-state riesults do not apply, however, for
shorter times, nor for depths Iess than about 30-50 ft near the edge of an area.
In the initial stagee of heatrng or cooling two separate t l m e e f f e c t s a r e p r e s e n t . T h e f l r s t o f t h e s e c a n b e t h o u g h t o f a e resultlng from changlng the surface ternperature of the area to a new valu" uo above the mean annual temperature of the external ground 6urface, whereas the second effect results frorn changlng or ellminating from the area the periodlc surface temperature varlatlon associated with the annual weather cycle,
No additional difficulty arlses in determinrng the ground
temperature in lts dependence on time. Exactly the sarne
pro-c e d u r e s a r e u s e d l n s u p e r i r n p o s i n g and adding temperatures as 'were used with the steady situation. The only difference ls that
different component temperature distributions are used. Thus,
for example, when a new bullding is more or less suddenly heated or cooled in a region where the undisturbed ground surface
temperature has a value p hlgher or lower than the mean annual
temperature the process is identlcal to that of changlng the
building temperature to a value vo htgher than the mean annual
temperature, while simultaneously darnplng pto 0 on the area
covered by the butlding" These two effects can be evaluated
separately: the resultlng temperatures can then be surnmed and
added to that caused by the geotherrnal gradient.
Lachenbruch (5) has developed the complete theory for
tirne-dependence, including both the effect of a sudden change in
s u r f a c e t e m p e r a t u r e , a s w e l l a s t h e e f f e c t o f a p e r i o d i c w e a t h e r c y c l e . T h e r n e t h o d u s e d l n t h e t h e o r y conslsts of agaln
sub 2 3 sub
-diwldtng the surface area lnto sectora of circles as lllustrated ln Flguree 15a to t5c and adding the temperature effects due to each sector. For the two eeparate caaes of a eudden change ln surface temperature, and for eteady-perlodic operatlon, l. €. after a number of years operation, Lachenbruch gtves graphlcal methode maklng use of Figure l5 cornbined wlth separate charts contalnlng welghting factors wlth whlch each area element of Flgure l6 ts to be rnultiplled for any specified tlme. Thle rnethod retalns the difflculty dlscuseed earrier for irregular areas, that either the chart (Flgure l6) or the surface area must be drawn to a new scale for each depth z. To avoid thls dlfflculty a procedure wlll be preeented slrntlar to that of Table I ln whlch the actual ecale of the drawlng or chart ie irnmaterial.
Sudden Ghange of Surface Te erature on a Given Area
For the sltuatlon ln which the surface temperature of a glven area ls suddenly ralsed to vo above the mean annual surface ternperature the procedure ls identlcal with that of Tab1e I except that the ternperature effect
# f.i" obtained from the other curves of Flgure l4 ln place of the steady ternperature curve k/Z{E = 0). These addltlonal curves have been calculated
ueing Lachenbruchrs Equal{e1 I.{o. (29) which is glven ln Appendtx A, sectlon 3. The dirndnstonless parameter z/Z\E contalns the required lnformatlon concerning the depth z Ln feet and the time t in hours. c ls the therrnal diffueivity of the ground ln ftz/hr and ls equal to the thermal conductiwlty divided by the speclflc heat per unit volume. Its value ranges from about o.ol ftz/hr for sandy
)
soil to 0. 04 ft" /t.'r for granite. By way of exarnple, Table II llluetrates the deterrnination of the temperature z0 ft deep under the centre of a 40- by loo-ft rectangurar bullding for a tirne of
1 . 7 y e a r s ( 1 5 , 0 0 0 h r ) and wtth the thermal diffusivity of the g r o u n d a s s u m e d t o b e 0.035 ftz/h". T h u s t h e v a l u e o f t h e t e r m
z/z ar is zo/z
1 5 0 0 0 x 0 . 0 3 6 = 0 . 4 3 . T h e a n g l e g w a s t a k e n as l0o glvlng nine sectors in each quarter of the rectangle( F l g u r e l 7 a ) . T h e f i n a l r e s u l t ( t a U t e I I ) is v/v
o = 0 . 3 8 5 . For the aame conditions Lachenbruch (5) obtainedv/vo = 0. 386 with the help of his chart.
St_eady Per iodlc T ernper atur e
After a surface area has had lts ternperature condltlons malntained for Bome tlme the resultlng situatlon is steady
periodlc, the outside ground surface ternperature being assumed to vary elnusoidally either with the annual or dairy weather cyc1e. Thls ls the condltion whlch would occur under a buildln g after several year6 of operatlon. For the case where the given atea 1e rnalntalned at constant temperature the procedure ls to add the steady ternperature effect obtained from Flgure I0 or by the rnethod of Table I to the effect which would result wlth the given
area maintalned at zero temperature whlle the remalnlng ground surface varies sinusoldally about zero temperature with an amplttude p^. To cornplete the.calculatlons ' o the effect of the geothermal gradlent would then be incruded" The eituation of greatest interest would generally be that of mld-wlnter or mid-aurnmer when the outside ground surface ternperature has tts mlnlmurn and rnaximurn value. To obtarn the periodlc portion of the ternperature solution the temperature which results from
summing the effects of all the sectors of the given area whose surface temperatures vary sinusoldally wlth the eaJ''e period and amplitude as that of the annual weather cycJ.e, rnust be
determined, the rernalning ground surface being assumed constant at zeto ternperaturel then the ternperature that would result
from the normal annual weather cycle over the entire ground surface lncluding the area under study is subtracted from the surn. This determines the temperature whlch resurte from
2 5
-rnalntalning the surface ternperature of the glven area at zeto
whlle the remalnlng ground surface varies periodlcally. The term
3 6 0 p
-- t' f frg which contains the temperature p which would result at varlous depths z under circular eectors of radi,us R at a tlme when
the eurface has its maximurn value llo is given in Flgure lg.
Here the terrn ,yf@6 a variable containlng the period pr €.g.,
for the annual cycle P = 8256 hr. (The equaflon for Figure Ig is given in Appendlx A, sectlon 4. ) hr Figure 19 the ternperature ln
the ground resultlng from the annual weather cycle over the
whole ground surface (Appendix A, section 5) has been computed for the tlme when the ground surface temperature has l,ts rnaxlrnurn value.
To llluetrate the procedure an example Is worked in Table rII for the same 40- by l00-ft bulldlng of rable II (thermal
dlffusivlty = 0. os6 ttz/nty. Two posltlons are consldered: one
f o t z = 2 0 f t ( 2 1 f u / e a = 2 . 0 ) u n d e r t h e c e n t r e ; a n d o n e f o t z = I f t
-lz\f /Pa = 0. I) under the edge at the centre of the 100-ft slde.
To complete the exarnples values that apply approxirnately to the
Ottawa, Canada, regions, are inserted, i. e.,
Tr, mean annual ground temperature at
outslde surface T
Z, surface temperature insi.de
building
Tmin, rninlrnurn rnonthly av€rage
ground surface temperatur e ln mid-winter GG, geotherrnal gradient = 49"F = 7 0 " t .
= 28'tr.
= t " r ' / l o o
Thus for poeltion No. I the actual ternperature would be:
and for position No. Z:
T = 4 9 + 0 , 4 5 0 ( ? 0 - 4 9 ) - 0 . 4 1 0 ( 4 9 - z g ) + 0 . 0 1 = 4 g . g " F . rt should be noted that the periodic temperature effect fot mid-summer ls just the negatlve of that in Table III. AIso, if the building is maintained at a temperature below T, then vo ls negative. Examples are glven in Table IV.
From theee two exarnples it can be lrnmedlately appreciated that the influence of the annual weather cycle is very emarl under the centre of the area but ls very important near the edge. The actuar temperature rn the ground depende not only on the eoil properties but arso on four independent varlables which may all be dlfferent in different locations throughout the wor1d. These are: the mean annuar tempera-ture at the ground surface Tr, the difference between the ternperature of the surface of the given area and the mean annual external ground surface temperature (T, _ tr) = uo, the arnplltude of the annual external surface temperature cycle (Tl T*irr) = Fo and the geothermal gradlent GO.
Exarnples of undisturbed ground surface temperatureB from reference (z) are glven in Figure z0 for three rocatrons. At Kpeve, Ghana (lat. 6" 4zt N. ) the rnean annuar surface tempera-ture is 83'F, the rnean monthly temperatempera-ture varying by only 4"tr. during the year. At Urbana, U. S. A- (lat. 40" O7t N. ) the mean annual temperature is 53"tr' and the range from surnrner to winter is 50'F, while at Resorute Bay, canada (Lat. 74"43r N.) the rpsal annual temperature is z.F and the summer to winter r a n g e l s 6 5 ' t r ' .
2 7
-Literature Sourcee for Environmental Te eratures and Geothermal Gradient
In order to carry out the foregoing calculatlons for any speclfic regi'on, records of the undisturbed ground surface
temperature as well ae values of the geothermal gradient must be available. o"Iy recently has this klnd of informatlon been eummarlzed for various locatlons throughout the world. In two vorumes of a Harvard unlversity report (z) Jen-hu-chang has compiled data f.or mean rnonthly grora.nd ternperatures from about 750 dlfferent weather statlons and has given generaLlzed world maps showing the approximate surface ternperature in January, Aprll, July and october. Alr temperatures for some regrons 'were
also compared with ground temperatureB, and, aa a conse-quence, the ground temperatures can be estimated frofn air temperature records for reglons where only these are available. About 400 entries of mean monthly air temperatures have been compiled by the smithsonian Institutlon ln the volumes r'W'orld weather Recordett (8). rre addltion to the Harvard and
Smithsonian reporte most countries, of course, maintaln meteorologlcal bureaus where specific information can be obtained.
The availabre information on the geothermal gradient ie somewhat llrnited" It has been found, however, that there is very little variatlon in the geothermal heat flow at different
locations around the world, lncruding the ocean bottom (Table v). The geothermal gradient is Just the ratro of the heat flux divlded by the thermal conducflvity of the ground; conae-quently, if the thermal conductivlty is elther measured or eetimated frorn data such as that contained ln reference (I)
then GO can be calculated directly. For example, wlth k = 0 . 6 4 B t u / ( h r ) ( " F ) ( f t ) t n a C a n a d i a n l o c a t i o n , t h e v a l u e o f GO would be about 0.02'E/ft ot Z"E/IO0 ft.
DISCUSSIOI{ ANp CONCLUSION
In the foregoing sections it has been ehown how to apply graphical rnethods to the determination of temperature at any locatlon in the ground under or near a surface area whose temperature ls different frorn that of its envlronrnent.
Beginning with the si,rnple example of a half plane and extending the rnethods to the strip, (corresponding to long buildings, rlvers or roadways), the corner, and the rectangular area (buildings), we eventually treated tlrne depen.dence and the lnfluence of the annual weather cycle for areas of any ehape (including heated and cooled buildings and lakes). Ln this connection it w111 be apparent that it ls not always nece6sary, ln uslng the given methods, that the surface area be flat. rnsofar as the contour of the heated or cooled surface falls on an lsotherrn of any of the complete ground temperature regirnes discussed in the previous sections, the temperature distrtbution may be ueed directly for this case. For example, lf the river bottom in F i g u r e 7 b h a p p e n e d t o h a v e t h e c o n t o u r o f t h e 0 . 6 ro
i s o t h e r m , t h e n ( T Z T r ) = 0 . 6 v o r e s u l t s a n d t h e o t h e r i s o t h e r m s l n F i g u r e ? b a r e d i v i d e d t h r o u g h b y 0 . 6 uo to obtain the temperature difference (T - T. ).
L
A factor that should be considered in dealing with small surface areas ls the influence of the heat transfer rfilrrr! coefficlent at the area surface. If the air above the area ls
malntained at a glven ternperature the ternperature of the surface will always be somewhat higher or lower due to convection and
_ 2 9 _
radiation of heat through the air I'film.!t To account for thie effect in detail would not be feasible; for practical purposes, however, the I'fiknttcan be treated ae an extra thlckness of eoil, I, over the ground surface ln accord with the relation-Bhlp.
! . = k / h , ( 3 )
where h ie the 'film'r coefficient in Btu/hr('r)ftz and k ie the thermal conductivity of soil la Btur/hr(.F)ft. In stiLl air h r a n g e s f r o m a b o u t l . I t o 1 . 6 a n d r e a c h e s a value of about 6.0 with rough surfaces in a wind of l5 mph velocity. For a soil with k = 1.0 Btu/hr( "F)ft the value of I would thus be between about 0.2 and 0.9 ft. Thus the boundary (air) temperature ie considered to be applied at this height above the true area eurface and therefore the ground surfaee ternperature can be calculated at z = !. Since, in effect, the elevation of the grormd has been raised over the area surface the sarne rnust be done for the rernaining external ground surface, so that the whole surface rernains a plane. To do this, the arnplltude of the external ground surface temperature cycre rs altered in accord with the sirnple relation, (obtalned from part 6 of. Appendb< A).
t s o = t s o
"
a* r o ( I +
a ( 4 ) where po is tb.e actual amplitude of ternperature variation at thea
external grormd surface and other symbols are a6 before. By way of exarnple using data frorn the last section and I = 0.9 ft, Equatlon (4) gives
r r o = ( 4 9 - z l l ( r + o . l @ y
= 2 3 . I " F ..,r/po l,
The rnethod of accountlng for variatlon of thermal conductivlty wtth ternperature can be applled, as well, to the determlnation of ternperatures varying with tlme. $r this case the solutlon w111 be sornewhat approxirnate, lt being necea€ary to assume that the thermal diffueiwlty does not
vary with temperature.
Two aspects of heattrng or coollng which have not been consldered ln this paper are (1) the amount of heat passlng through the surface area and (2) the ef.f.ect of t}:e latent heat of freezlng. The heat transfer rate at speclflc polnts can be obtained of course, although it is tedious, by differentiating the tempenature equations given ln Appendlx A and then obtaln-lng the total heat flow by lntegration over a given surface. The problem of the latent heat of freezing is exceedingly complex but
can be treated for the ldeal ca6e of a surface area whose temperature is suddenly changed to a new value when no other tlme effects are preBent. For the rnethod of treatrnent ln thls
c a a e t h e r e a d e r i s r e f e r r e d t o r e f e r e n c e ( 6 ) "
Calculatlons of temperature for complex sltuatlons caJr., of course, be carrled out by electronic cornputer and computer prograrna are now available for surface areas of any shape. Bendix Userg Project No. 698 allows calculation of the steady ternperature with the Bendlx G-15 and a rnore general prograrn
allowlng calculations of transient and steady perlodic tempera-tures has been compiled for the IBM 1620 by the Cornputatlon
Centre of the Natlonal Research Councll, Canada.
ACKNOWLEDGEMENTS
The author is and suggestions leading
lndebted to the to this paper:
following for discusslons Drs. D. G. Stephenson,