HAL Id: hal-00658791
https://hal.archives-ouvertes.fr/hal-00658791
Submitted on 11 Jan 2012HAL is a multi-disciplinary open access
archive for the deposit and dissemination of sci-entific research documents, whether they are pub-lished or not. The documents may come from teaching and research institutions in France or abroad, or from public or private research centers.
L’archive ouverte pluridisciplinaire HAL, est destinée au dépôt et à la diffusion de documents scientifiques de niveau recherche, publiés ou non, émanant des établissements d’enseignement et de recherche français ou étrangers, des laboratoires publics ou privés.
Analysis of index modulation of doppler microembolic
signals part II: in vitro discrimination
Jean-Marc Girault, Denis Kouamé, Sébastien Ménigot, Francesco Guidi,
Grégory Souchon, Jean-Pierre Remenieras
To cite this version:
Jean-Marc Girault, Denis Kouamé, Sébastien Ménigot, Francesco Guidi, Grégory Souchon, et al.. Analysis of index modulation of doppler microembolic signals part II: in vitro discrimination. Ultra-sound in Medicine & Biology, Elsevier, 2011, 37 (1), pp.102-111. �10.1016/j.ultrasmedbio.2010.10.014�. �hal-00658791�
Analysis of Index Modulation of Doppler
microembolic signals Part II: in vitro discrimination
Jean-Marc Girault,
aDenis Kouam´e,
bS´ebastien M´enigot,
aFrancesco Guidi,
cGr´egory Souchon,
aJean-Pierre Remenieras
aa
Universit´e Fran¸cois Rabelais de Tours, UMRS ”Imaging and Brain” U930 and CNRS ERL 3106, Tours, France.
b
Universit´e PAUL Sabatier de Toulouse 3, IRIT UMR 5505, France
c
University of Florence, Department of Electronics and Telecommunications, Italy
Corresponding Author: Jean-Marc Girault Inserm U930 - CNRS ERL 3106 - ´Equipe 5 UFR de M´edecine 10 boulevard Tonnell´e, BP3223 F-37032 TOURS CEDEX 1 Email: jean-marc.girault@univ-tours.fr Telephone: +33 (0)2 47 36 62 21 Elsevier
Ultrasound in Medicine & Biology, Volume 37, Issue 1, January 2011, Pages 102-111 DOI : 10.1016/j.ultrasmedbio.2010.10.014
Abstract
The purpose of this study was to validate through experiments that frequency modulation (FM) of microembolic signatures was principally due to the radiation force. Several experiments were required to prove that such a frequency modulation originates from micro-displacements in-duced by the radiation force acting on microbubbles. The first experiment was performed to verify that the diffraction effects due to the presence of a skull did not disturb the acoustic field appreciably and to validate that a radiation force in the brain was sufficient to create a detectable micro-displacement. A second in vitro experiment using a single gate transcranial Doppler (TCD) system was conducted to show discrimination feasibility and to check that microembolic frequency modulation signatures (FMS) and frequency modulation index (FMI) were the same as those observed in vivo and those calculated by simulation. A final in vitro experiment was performed using a multi-gate multi-channel TCD system to confirm the second experiment by directly measuring the micro-displacement induced by the radiation force. A new parameter, to be known as the position modulation index (PMI), is proposed. We showed that the radiation force is sufficient to induce detectable micro-displacements despite the presence of the skull. We also showed that the diffraction effects due to the skull induced a decrease in the ultrasound beam of 7.6 dB. Finally, we showed by using FMI and PMI that it is possible to dis-criminate gaseous from formed elements (< 100 microns ) despite the presence of the skull. The discrimination based on the FMI is an off-line technique allowing the analysis of standard TCD recordings. However, discrimination based on the PMI requires recordings obtained exclusively from a multi-gate system.
Introduction
1
More than two-thirds of all ischemic strokes are caused by cerebral embolisms related
2
to the intravascular migration of various particles. These particles can be of different
3
types, such as blood clots, fat particles or gas bubbles originating from the vascular bed
4
or trapped in the vasculature during a surgical procedure or intervention. In order to
5
provide an accurate diagnosis and suitable treatment, it is essential to establish the
pre-6
cise nature of emboli as quickly as possible. Embolus size is also an important criterion
7
which must be taken into account. Transcranial Doppler (TCD) systems have been used
8
in vivo, and various results have been reported in terms of detection rate and
characteri-9
zation. Analysis of the Doppler signal in well-controlled in vitro experiments can provide
10
valuable information concerning the characteristics and size of emboli. However, accurate
11
characterization cannot yet be fully achieved in clinical practice using current technology.
12
Many reports in the medical literature have proposed methods of differentiating gaseous
13
and particle microemboli. Many in vitro and in vivo studies have been published in
sci-14
entific and clinical journals (Rusell et al. (1992), Markus and Brown (1993), Georgiadis
15
et al. (1994), Droste et al. (1994),Smith et al. (1997), Smith et al. (1998), Devuyst et al.
16
(2000), Devuyst et al. (2001), to name but a few). They are mainly based on the
measure-17
ment of duration (or conversely bandwidth) (Smith et al. (1997), Devuyst et al. (2001)),
18
position-velocity-acceleration (or Doppler frequency, frequency modulation index,
posi-19
tion modulation index) (Smith et al. (1997), Girault et al. (2010)) or a combination (SVL)
20
(Smith et al. (1998)), and intensity or intensity ratio (Smith et al. (1997),Devuyst et al.
21
(2000)).
22
The present study focused on the experimental measurement of the frequency
modula-23
tion index (FMI) (Smith et al. (1998)), i.e. the slope of the embolus velocity (frequency
24
modulation signature) versus time, and the position modulation index (PMI) (Girault
25
et al. (2010)), i.e. the slope intensity of the position modulation signature. Our study
complements and experimentally validates the simulation studies (Girault et al. (2010))
27
in which we argued that the major contribution of the frequency modulation signature
28
(FMS) originates from an external force: the radiation force. However, this hypothesis
29
can be questioned for many reasons, the main reasons being firstly the beam distortion
30
due to the presence of the skull between the probe and the middle cerebral artery (MCA)
31
and secondly the attenuation due to the depth of the region being explored (> 50 mm).
32
Note that the middle cerebral artery is the vessel most typically monitored for
microem-33
boli in current practice. Eighty percent of the flow to the brain goes through the left and
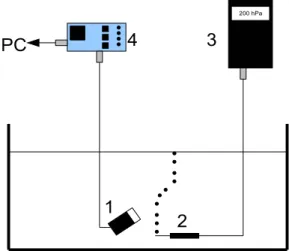
34
right middle cerebral arteries, and thus most microemboli will be trapped here. When the
35
middle cerebral artery is viewed from the temporal bone, the blood flow is mainly parallel
36
to the ultrasound beam axis. A detailed discussion of the influence of the temporal bone
37
on the US beam is presented in Deverson et al. (2000). However, we showed in this study
38
that, although the US beam was attenuated and distorted, the radiation force induced
39
was sufficient to move microbubbles.
40
The purpose of our study was to confirm experimentally that the radiation force is the
41
main physical phenomenon which explains the frequency modulation observed in
mi-42
croembolic signals (MES) in vivo. As an illustration, Fig.1 shows temporal and time
43
frequency representations of a gaseous microembolic Doppler signal from which FMI can
44
be evaluated manually: F MI = ∆f/∆t = 300/0.013 = 20kHz/s. According to Smith
45
et al. (1997), the FMS reported in Fig.1 belongs to the third type of FM, i.e. with a
46
rapid change. This confirms that the microembolus is of a gaseous nature. The question
47
which remains is whether the radiation force is sufficient to create a micro-displacement
48
detectable by a TCD system ? If the answer is positive, then differentiation between
49
gaseous and formed elements is possible.
50
In this study, the issue was approached in two ways. First, the acoustic field was measured
51
with and without a skull between the probe and area being explored. It was then shown
52
that it is possible to discriminate a gaseous from a formed element (piece of pork) by
53
using FMI and PMI. Finally, the most important parameters influencing the radiation
force were examined.
55
Materials and Methods
56
Three series of measurements were performed.
57
The first and the second were carried out in our laboratory. The first experimental setup
58
focused on mapping the ultrasound field refracted in water with and without a skull.
59
The skull sample used was an adult skull fixed in formalin ex vivo (skull donated by the
60
Anatomy Department of Bretonneau Hospital, Tours, France). The post mortem ex vivo
61
human skull consisted of the right half of the skull. The gender and exact age of the
62
cadaver were unknown. No visible damage or malformation was observed.
63
Using a commercial TCD system, the second study focused on measuring the frequency
64
modulation index (FMI) by means of a time-frequency representation of the Doppler
65
MES. Frequency and pressure levels (or voltage applied to the transducer) were constant.
66
The third series of measurements was carried out at the University of Florence with a
67
customized multichannel multigate system (MCMG) allowing two representations
(time-68
frequency and time-depth) of the microembolic Doppler signal.
69
Mapping of the Pressure field
70
The purpose of this experiment was to map the acoustic field in order to evaluate the
71
influence of the skull on the refracted ultrasonic beam and to quantify the corresponding
72
losses due to the presence of a human skull.
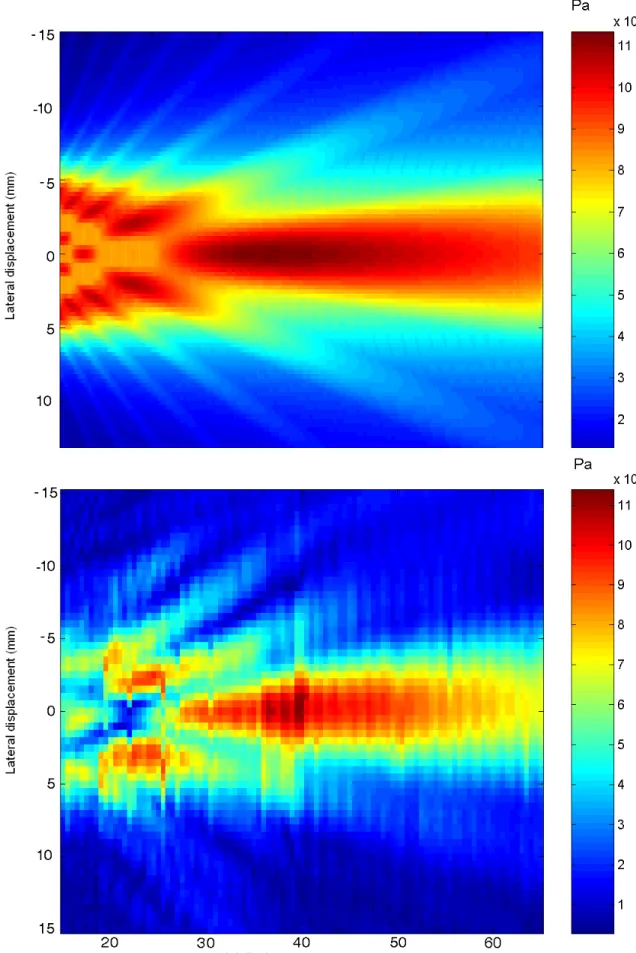
73
The US field refraction induced by bone has been the subject of many studies (for some
74
examples see: M.A. Moehring (1996), Deverson et al. (2000), Evans (2006)), and our work
75
complementing these previous studies. This research has been crucial because it has been
shown by Girault et al. (2010) that microembolus trajectories depend on both the shape
77
of the US beam and the spatial velocity distribution.
78
The experimental setup consisted of a waveform generator (HP 3314 A) connected to an
79
amplifier. The signal was sent to a transducer (Imasonic, 13 mm, 2 MHz) in contact with
80
the skull. The ultrasonic wave transmitted through the skull was received by a hydrophone
81
(Precision Acoustics Ltd) coupled to an amplifier (Gain 25 dB). The transducer and
82
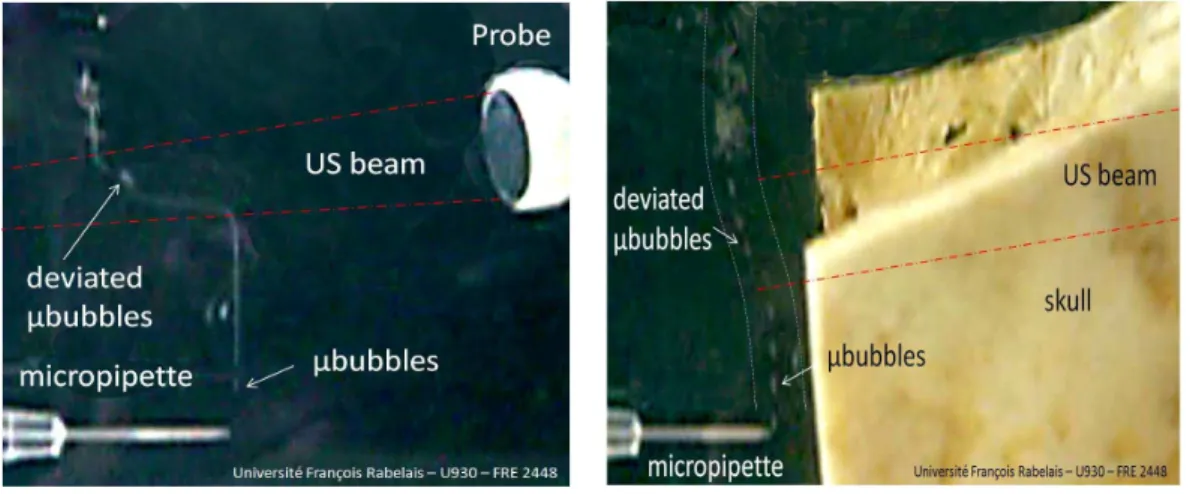
the hydrophone were submerged in a water tank. The pressure levels were obtained at
83
different positions using a displacement system (NTR system, resolution 0.5 mm). The
84
signal was digitized with an oscilloscope (Lecroy LT374M) and then sent to a computer
85
through a GPIB link. A photograph of the experimental setup is presented in Fig.2. In
86
the first experiments the pressure levels were obtained in water without the skull and
87
with a degassed skull inserted between the transducer and the hydrophone.
88
To confirm the impact of the skull on the ultrasound beam (diffraction effect), we
per-89
formed simulations based on a finite differences technique (details reported in references
90
Calle et al. (2005); Souchon et al. (2006); Bastard et al. (2009)).
91
In vitro measurement with TCD system
92
The purpose of this experiment was to measure the presence of microembolic ”additional
93
acceleration” due to the radiation force acting on a microbubble through measurement
94
of the frequency modulation index.
95
A diagram of the experimental setup is presented in Fig.3. A gear pump (4) circulates
96
degassed water in a tygon tube (2) of 5 mm internal diameter, 5 mm being slightly
97
larger than the mean diameter of 3.2 mm of the MCA, probably involving a lower beam
98
refraction compared to that observed in vivo. This tube crosses a water tank (1) in
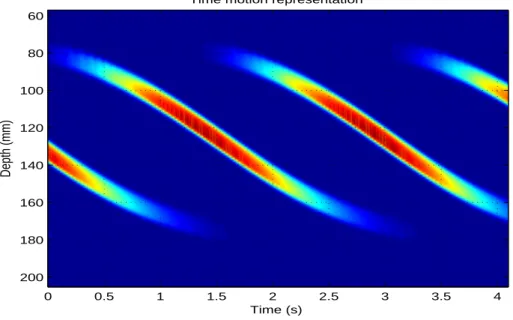
99
which a transcranial Doppler transducer (3) is immersed. Circulating emboli are then
100
detected by the pulsed wave (PW) Doppler system (5). In order to approximate the
clinical context, we used two types of configuration: one without and one with a degassed
102
skull inserted between the tube and the probe. The transcranial Doppler transducer used
103
was an unfocused Vermon probe of 2 MHz central frequency. The PW Doppler system
104
(DOP248 Ultrasons Technologies, Tours, France) operates at 2 MHz with pulses of N = 20
105
cycles (for example), a pulse repetition frequency (PRF) of 8 kHz and an acoustic intensity
106
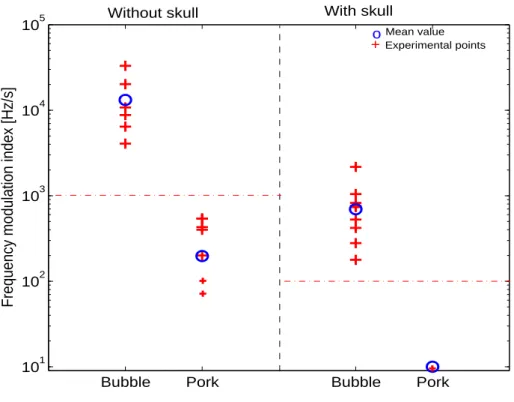
of Ispta= 450 mW/cm 2
. The corresponding pressure level at this intensity is:
107 P = s 2ZIspta N f P RF = 400kP a, (1) 108
where P RF = 8kHz, f = 2 MHz and N = 20, and where the acoustic impedance in water
109
is Z = 1.48 MRay and in the brain is Z = 1.6 MRay. Note that Ispta= 720 mW/cm 2
is
110
the upper-end value under the FDA guidelines.
111
Bubbles were produced naturally by cavitation in the gear pump used to circulate water
112
and they were all less than 300µm in size. Note that the size of the microbubbles was
113
measured on the basis of photographs where both microbubbles and reference objects of
114
known size were present (micropipette, US probe). The solid emboli were pieces of pork
115
(bought from a butcher) and they were all less than 300µm. Note that the size of the
116
fat particle was measured with a binocular magnifying glass. We believe that 300µm is a
117
value close to clinical situations. The velocity of the fluid in the tube was set at a constant
118
value to ensure no acceleration. Solid microemboli were injected into a second water tank
119
(6) and sucked into the tube. Gaseous and solid microemboli were detected when they
120
crossed the ultrasound beam, and each microembolus signal was computed.
121
In order to quantify the frequency modulation, we introduced the Frequency Modulation
122
Index (FMI), initially proposed by Smith et al. (1997). The FMI is defined as follows:
123 F MI = dFD(t) dt = 2f cosθ c dVb(t) dt + dVRF(t) dt ! . (2) 124
where FD(t) is the instantaneous Doppler frequency, Vb(t) the embolus velocity and VRF(t)
125
the additional velocity due to the radiation force (θ is assumed to be constant). In practice,
[
F MI was obtained manually (by means of a marker cursor) by measuring:
127 [ F MI = ∆f(t) ∆t = FD(t − ∆t/2) − FD(t + ∆t/2) ∆t ,
where ∆t is the temporal interval in which the modulation is significant. Note that this
128
approach is equivalent to applying a linear regression to the instantaneous frequency: the
129
greater the pressure on the bubble, the higher the FMI.
130
In vitro measurement with MCMG system
131
This experiment had two aims, the first being to verify that it was still possible to
132
detect micro-displacements induced by the radiation force using another TCD system.
133
The second aim was to measure the micro-displacement directly by means of a new
134
parameter, the position modulation index (PMI). It should be noted that the FMI does
135
not directly provide the value of the micro-displacement but yields an indirect value
136
through the Doppler frequency.
137
A diagram of the experimental setup is presented in Fig.4. A micropipette (2) connected
138
to a gas flow (3) (Eppendorf air generator) was immersed in a water tank. Microbubbles
139
were produced at the extremity of the micropipette and rose to the surface of the water
140
within the tank. An ultrasound beam (1) crossed the trajectory of the microbubbles.
141
Acoustic emission (2 MHz) and reception were performed with the MCMG board (4)
142
connected to a computer. Bursts of 25 cycles were emitted with a PRF of 1 kHz. As the
143
speed of the microbubbles was very slow in this in vitro experiment, we chose to reduce
144
the commonly used PRF of 8kHz to 1kHz. The direct consequence of this reduction was
145
a lower total displacement of the microembolus. The value of the radiation force was not
146
affected since the radiation force is independent of the PRF.
147
The MCMG board proposed by Guidi et al. (2003) provided acquisition of signals at 128
148
depths, the total depth covered being 128c/2fswhere c was the acoustic wave velocity and
fsthe fast time sampling rate programable in the range of 2−10 MHz. The signal detected
150
at each depth was analyzed with the Wigner-Ville transform of blocks of 256 points
151
obtained at 1 kHz PRF. The frequency resolution of our representation was therefore
152
f = 1.953 Hz. With these parameters and an insonification angle of 45 degrees, the
153
minimum velocity which could be measured was v = 1 mm/s. The temporal resolution
154
was 1/P RF = 1 ms (P RF = 1 kHz).
155
The MCMG board allowed direct display of the trajectory of an embolus crossing the
156
ultrasound beam. It could also be used to compute the time-frequency representation
157
from which the FMI could be evaluated. The magnitude of the displacement induced by
158
the radiation force could be evaluated directly by measuring of the Position Modulation
159
Index (PMI). In the case of a gaseous embolus, the Position Modulation Index (PMI)
160
defined by:
161
P MI(t) = dD(t) dt ,
where D(t) is the instantaneous embolus position, could be determined from the
time-162
depth representation by applying a linear regression to the trajectory of the embolus.
163
Finally, in practice the evaluated [P MI was obtained manually by means of a marker
164 cursor by measuring: 165 [ P MI(t) = ∆D(t) ∆t = D(t − ∆t/2) − D(t + ∆t/2) ∆t . Results 166
In this section we present the results obtained from in vitro measurements (see
Figs.8-167
10). Three kinds of experiment were performed. The first involved measurements of the
168
pressure level in water with or without a human skull. The second involved measurements
169
of the frequency modulation index (FMI) with a classical TCD system, and the third
170
involved measurements of FMI and PMI with a MCMG system.
Mapping of the US beam
172
Figs.5 and 6 illustrate the refracted acoustic field in water with and without the skull.
173
The experimental mapping of the pressure level was obtained by measuring the maximum
174
pressure at each position. The maximum pressure level measured in water without the
175
skull was about 110 kPa, while with the skull the level measured was about 46 kPa. The
176
presence of the skull induced a decrease of 7.6 dB and a lateral deviation (perpendicular
177
to beam axis) of the ultrasound beam since the maximum pressure level was not at 0 mm
178
(obtained without skull) but at 1.5 mm. Note that this loss of 7.6 dB included diffraction
179
effects, reflections and attenuation in water. Note also, as reported by Fry and Barger
180
(1978), that slight defocusing and small reductions in beam occurred.
181
For example, for a fixed depth of 5.0 cm the spatial distribution of the pressure level at
182
a fixed depth looked like a gaussian function (see Fig.2 in Deverson et al. (2000)). The
183
5.0 cm axial distance was chosen on the basis that most TCD recordings for the MCA
184
are acquired at approximately this depth.
185
In two previous studies (Souchon et al. (2005) and Biard (2005)) we measured the pressure
186
levels with a classical TCD system and with a hydrophone near the temporal bone, with
187
and without a skull. The presence of the skull immersed in water caused a decrease in
188
pressure of about 10 dB at 5 cm away from the skull compared to the 7.6 dB reported
189
above.
190
Even when the pressure level fell drastically (7.6 dB), it was still possible to detect bubble
191
displacement visually, as shown in Fig.7. Fig.7 shows a bubble flow when the trajectory
192
deviated in the presence or absence of a skull between the bubbles and the transducer.
193
In both cases the bubble flow deviated sufficiently to be observed by the human eye.
Analysis of Frequency and position modulation
195
Figs.1 and 8 show temporal and time-frequency representations of in vivo and in vitro
196
experiments, respectively. In these figures FMI were similar and of about 20 kHz/s.
197
Fig.1 shows a time frequency representation of a gaseous MES obtained from the middle
198
cerebral artery (depth 5 cm). The setting parameters of the TCD system were P RF = 8
199
kHz, N = 20 (number of cycles), f = 2 MHz, and Ispta = 450 mW/cm 2
. Fig.1 shows
200
temporal and time-frequency representations of an MES. Four phases can be seen in Fig.1
201
(bottom): i) constant speed of the bubble for a time position around 0.02 s, ii) increasing
202
speed between 0.02 s and 0.04 s, iii) decreasing speed between 0.04 s and 0.06 s, and iv)
203
constant speed beyond 0.06 s. The time-frequency embolic signature resembles a reversed
204
”V” shape. Note that valid explanations of the ”V” or reversed ”V” shape are reported in
205
Girault et al. (2010). The highest FMI was obtained in the decreasing phase where [F MI =
206
20 kHz/s. The reversed ”V” shape, which seemed to be representative of a gaseous MES,
207
was similar to that reported by Smith et al. (1997) (for similar acquisition parameters)
208
for which the FMI evaluated in the decelerating phase was ∆f/∆t = 800/0.020 = 40
209
kHz/s. Finally, when the time-frequency signature was monotonic, the FMI was simply
210
evaluated by measuring the slope. When the time-frequency was no longer monotonic,
211
the signature was split into two monotonic regions for which only the maximum slope was
212
retained. Note also that for greater time-frequency resolution we used the Wigner-Ville
213
representation, as suggested in Smith et al. (1997). Note that the scalloping effect present
214
in Fig.8b is due to the inner interference of the Wigner-Ville transform.
215
Fig.8 shows a time frequency representation for two types of embolus (gaseous and fat
par-216
ticle). Two time-frequency representations and two temporal representations of Doppler
217
MES obtained from the experimental setup depicted in Fig.3 are presented in Fig.8 as
218
examples. The bottom image, obtained for a solid embolus, did not show any frequency
219
modulation (type I FM) whereas the top image, obtained for a gaseous embolus,
strated detectable frequency modulation (type III FM). Note that the temporal Doppler
221
signature presented in Fig.8, obtained for emboli circulating in water, was very similar
222
to that reported by Smith et al. (1997) obtained for emboli circulating in blood.
223
Fig.9 shows the time-depth representation of four gaseous emboli (evaluated radius of
224
≈ 200µm) circulating in water obtained with the MCMG system as described in the
225
experimental setup in Fig.4. The setting parameters were f = 2 MHz, P RF = 1 kHz, N =
226
25, and P a = 500kPa. The position modulation index was ∆D/∆t= (180 − 80)/(3) ≈ 30
227
mm/s. This implies that the mean elementary displacement between two consecutive
228
emitting bursts is about 30 µm (P MI = 30 mm/s = 30 µm/ms) for a P RF = 1 kHz.
229
With the depth resolution of (200 −60)/128 ≈ 1.1 mm, microdisplacements of 30 microns
230
were detected each 30 ms. In terms of the shape of the microbubble trajectory, it can be
231
seen in Fig.9 that the microbubble deviates more and more as it crosses the US beam:
232
the closer the bubble approaches to the focal point, the more the bubble accelerates,
233
and the further the bubble moves away from the focal point the more it slows down. The
234
inflection point of the microbubble trajectory corresponds to the point where the pressure
235
is maximal. This is easily explained by supposing a unimodal US beam profile.
236
Discrimination
237
F MI assessed from the experimental setup of Fig.4 are shown in Fig.10 using a classical
238
TCD system for all gaseous and solid emboli (with and without a skull). Each cross in
239
Fig.10 represents one measurement. Several crosses are superimposed, and the mean value
240
of these measurements is represented by a circle. Measurements were very close in each
241
configuration, allowing easy discrimination of an embolus (bubble or fat).
242
• For a microbubble and a pressure level of 500 kPa (measured without skull), it can be
243
seen that the FMI measured was around 10 kHz/s (4 < [F MI(kHz/s)< 40), whereas
244
for a pressure level of 150 kPa (with skull), the FMI was around 0.8 kHz/s (0.2 <
[
F MI(kHz/s)< 2).
246
• Similarly, for a fat particle and a pressure level of 500 kPa (measured without skull),
247
it can be seen that the FMI was around 0.2kHz/s (60 < [F MI(Hz/s) < 600), whereas
248
for a pressure level of 150 kPa (with skull), the FMI measured was around 10 Hz/s.
249
F MI and P MI assessed from the experimental setup in Fig.3 using a MCMG TCD
sys-250
tem for all gaseous and solid emboli are shown in Table 1. By using thresholds (12.5Hz/s
251
for FMI and 7mm/s for PMI), it was possible to discriminate gaseous from fat particles
252
on the basis of F MI and P MI.
253
Discussion and Summary
254
The discussion focused on three essential areas. The first related to examination of the
255
impact of a skull on the modification of an US beam and discussion of the visible
de-256
viation of microbubbles in the presence of a skull. The second area was the validation
257
through in vitro experiments that the radiation force was the main physical phenomenon
258
that explained the different type of FMS, focusing on qualitative findings concerning the
259
similarities between our FMS results and those reported in the literature. The third area
260
was the discrimination between gaseous and fat particles.
261
Mapping of the US beam
262
As reported by Fry and Barger (1978), and depicted here in Figs.5 and 6, the presence
263
of the temporal bone distorted and attenuated the US beam.
264
In terms of beam distortion, the presence of a skull involves refraction of the ultrasonic
265
beam, explained by the concave shape of the skull which induces mechanical focusing in
266
some way. The maximum pressure was no longer x1 = 0 mm but x1 = −1.5 mm, proving
267
that the beam was deflected (lateral deviation perpendicular to beam axis). Note that
the principal lobe was distorted in its lower part both in simulation and experimentally.
269
We hypothesized that this was due to the presence of the extra thickness of the skull
270
bone, this extra thickness inducing a higher propagation velocity of the acoustic waves.
271
In clinical practice, it is not possible to know the exact beam modifications due to the
272
temporal bone. However, to overcome this lack of information, experts naturally and
273
spontaneously correct the beam deflection by modifying the beam-to-flow angle and the
274
depth of the Doppler window. On the other hand, as it is not possible to correct the
275
nonuniformity of the US beam, it is highly probable that the microbubble trajectory will
276
remain nonuniform. However, the trajectory modification did not confirm such
nonuni-277
formity in our study (see Fig.7) since the microbubble trajectory seemed monotonic, thus
278
suggesting that the US beam was not appreciably distorted.
279
In terms of attenuation, the presence of a skull induced reductions of 7.6 dB and 10 dB in
280
another study performed by Souchon et al. (2005). This variability of pressure reduction
281
was evidently due to the intra variability of skulls. However, it should not be concluded
282
that the presence of a skull would involve a decrease in the order of 10 dB each time.
283
Indeed, clinicians are well aware that the temporal window is very patient-dependent:
284
someone with a thin skull will have less pressure reduction whereas others with a thick
285
temporal bone will have considerable pressure reduction.
286
Another point requiring discussion was the spectacular deviation of the microbubble flow
287
by the US beam. This result was very interesting because the deviation of the microbubble
288
was still visible even when there was a human skull between the probe and the insonified
289
area. This shift of about 4 mm (with skull) led us to believe that it would still be
290
detectable by the TCD system in the presence of both skull and brain, bearing in mind
291
that microdisplacements in the order of a few hundred microns can be detected by a
292
Doppler system (see Girault et al. (2010)).
Analysis of Frequency and Position Modulations
294
The first finding to be discussed is the obvious resemblance between the FMS represented
295
in Fig.1 and those reported by Smith et al. (1997), i.e. i) no modulation was present for
296
type I FM, ii) gradual increase was observed over the whole duration of the microembolic
297
Doppler signal for type II FM, and iii) rapid change was observed in a small percentage
298
of the total durations of the Doppler microembolic signal for type III FM. Note that
299
the acquisition parameters in our experiment were similar to those reported by Smith
300
et al. (1997). The in vivo results obtained for gaseous microemboli were similar both
301
qualitatively and quantitatively (i.e. in shape and in terms of FMI values) to those of
302
”type III”. The same applied for type I FM, i.e. for formed elements. This confirmed that
303
type III FM found in the literature were also found in our in vivo study. Though the
304
acquisition parameters were different in our in vivo and in vitro studies, the FMS were
305
similar qualitatively, suggesting that the underlying physical phenomenon was probably
306
the same.
307
We believe that it is possible to obtain type II FM for other experimental settings and
308
for other microemboli (other materials)and that it is still possible to observe type II FM
309
for larger microemboli. The microembolus must not be too large because there is a risk
310
that it will be interpreted as a hazard to the patient.
311
Discrimination
312
The comments below on discrimination first address differentiation of microbubbles and
313
microparticles of fat. We then discuss the results demonstrated in Figure 10 and in Table
314
1.
315
This experimental study showed that the temporal bone influences the US beam in a
316
non-negligible manner. However, we also showed that the microdisplacements (few tens
of microns) induced by the radiation force were sufficient to be detected by a TCD system.
318
Moreover this study confirmed experimentally that type I FMS are due to solid particles
319
whereas type III FMS are exclusively due to gaseous microemboli. Finally, these in vitro
320
studies confirmed that both F MI and P MI are suitable tools to differentiate gaseous
321
from solid emboli, and we suggest that the discrimination techniques based on FMI and
322
PMI measurement remain off-line techniques.
323
However, this research is the first step towards a clinical application, and complementary
324
studies must be performed to explore and understand what really happens for large
325
microemboli.
326
Acknowledgements
327
This study was supported by the European Union (UMEDS Project) and by the French
328
Government (CASC Project). I wish to thank P. Tortoli for valuable discussions.
329
References
330
Bastard, C., Remenieras, J., Calle, S., Sandrin, L., 2009. Simulation of shear wave
prop-331
agation in a soft medium using a pseudospectral time domain method. Journal of the
332
Acoustical Society of America, 2108–2116.
333
Biard, M., 2005. Instrumentation and doppler signal analyze : study and characterization
334
of emboli. Ph.D thesis, Tours, France.
335
Calle, S., Remenieras, J., Matar, O. B., Elkateb, M., F.Patat, 2005. Temporal analysis of
336
tissue displacement induced by a transient ultrasound radiation force. Journal of the
337
Acoustical Society of America, 2829–2840.
338
Deverson, S., Evans, D., Bouch, D., 2000. The effect of temporal bone on transcranial
339
doppler ultrasound beam shape. Ultrasound in medecine and biology 26, 239–244.
340
Devuyst, G., Darbellay, G., Vesin, J.-M., Kemeny, V., Ritter, M., Droste, D., Moline,
C., Serena, J., Sztajzel, R., Ruchat, P., ang G. Dietler, C. L., Ringelstein, E., 2001.
342
Automatic classification of hits into artifacts or solid or gaseous emboli by a wavelet
343
representation combined with dual gated tcd. Ultrasound in medecine and biology 27,
344
2803–2809.
345
Devuyst, G., Vesin, J.-M., Despland, P.-A., Bogousslavsky, J., 2000. The matching pusruit
346
method: a new method of characterizing micro-emboli signals ? Ultrasound in medecine
347
and biology 26, 1051–1056.
348
Droste, D., Markus, H., Nassiri, D., Brown, M., 1994. The effect of velocity on the
ap-349
pearence of embolic signals studied in transcranial doppler models. Stroke 25, 986–991.
350
Evans, D., 2006. Embolus differentiation using multifrequency transcranial doppler.
351
Stroke 37, 1641.
352
Fry, F., Barger, J., 1978. Acoustic properties of the human skull. J. Acoust. soc. Am. 63,
353
1576–1590.
354
Georgiadis, D., Mackay, T., Kelman, A., Grosset, D., Wheatley, D., Lees, D., 1994.
Dif-355
ferentiation between gaseous and formed embolic materials in vivo. application in
pros-356
thetic heart valve patients. Stroke 25, 1559–1563.
357
Girault, J.-M., Kouame, D., Menigot, S., Souchon, G., Tranquart, F., 2010. Embolus
358
discrimination by means of ultrasound radiation force part i: Analysis of the frequency
359
modulation by means of simulations. Ultrasound in medecine and biology XX, XX–XX.
360
Guidi, F., Boni, E., Tortoli, P., 2003. Acoustic method for real-time visualization of
361
microbubble movements and rupture. IEEE Ultrasonics symposium, 1183–1186.
362
M.A. Moehring, J.A. Ritcey, A. I., 1996. Sizing emboli using pulse doppler ultrasound-ii.
363
effects of beam refraction. IEEE Trans on Biomed Eng, 581–588.
364
Markus, H., Brown, M., 1993. Differentiation between different pathological cerebral
em-365
bolic materials using transcranial doppler in a in vitro model. Stroke 24, 1–5.
366
Rusell, D., Brucher, R., , Madden, K., Clark, W., Sanset, P., Zivin, J., 1992. The intensity
367
of the doppler signal caused by arterial emboli depends on embolus type and size. Stroke
368
23, 158–162.
369
Smith, J., Evans, D., Bell, P., Naylor, R., 1998. A comparison of four methods for
guishing doppler signals from gaseous and particulate emboli. Ultrasound in medecine
371
and biology 29, 1133–1138.
372
Smith, J., Evans, D., Naylor, R., 1997. Analysis of the frequency modulation present
373
in doppler ultrasound signal may allow differentiation between partiulate and gaseous
374
cerebral emboli. Ultrasound in medecine and biology 23, 727–734.
375
Souchon, G., Call´e, S., Gomez, M., Remenieras, J., Girault, J., 2006. Etude num´erique et
376
exp´erimentale de la propagation d’onde au travers du crˆane : Application `a la d´etection
377
d’emboles. Congr`es Fran¸cais d’Acoustique, Tours, France, 371–374.
378
Souchon, G., Girault, J.-M., Biard, M., Kouam´e, D., Tranquart, F., 2005. Gaseous and
379
solid emboli differentiation using radiation force. IEEE Ultrasonics symposium,
Rot-380
terdam, 2070–2073.
List of Tables
382
1 Embolus differentiation based on FMI and PMI (MCMG system and
383
experimental setup illustrated in Fig.3) for bubbles R0 ≈ 100µm and fat
384
particles 100 < R0(µm) < 300 immersed in water. Ispta= 450 mW/cm2,
385
P RF = 1 kHz, N = 25, f = 2 MHz. 22
List of Figures
387
1 In vivo experiment (embedding medium: blood). Gaseous microembolic
388
signature obtained from the middle cerebral artery (depth 50mm).
389
Setting parameters: P RF = 2.7 kHz, N = 20 (number of cycles),
390
f0 = 2MHz, Ispta = 450 mW/cm 2
. a) Temporal representation of a
391
microembolic signal. b) Time frequency representation of the Doppler
392
signal from which the FMI evaluated in the decelerating phase is
393
∆f/∆t = 330/0.013 = 25kHz/s. The reversed ”V” shape, which seems
394
to be representative of a gaseous embolic signature, is similar to that
395
reported by Smith et al. (1997) for which the FMI evaluated in the
396
decelerating phase was ∆f/∆t= 800/0.020 = 40kHz/s. 23
397
2 Photograph of the experimental setup required to map the acoustic field. 24
398
3 Diagram of experimental setup. A gear pump (4) circulates degassed
399
water in a tygon tube (2). This tube crosses a water tank (1) in which a
400
transcranial Doppler transducer (3) is immersed. Circulating emboli are
401
thus detected by the pulsed wave (PW) Doppler system (5)(usual TCD
402
and MCMG systems). 24
403
4 Diagram of experimental setup. A micropipette (2) connected to a gas
404
flow (3) (Eppendorf air generator) was immersed in a water tank. Bubbles
405
were produced at the extremity of the micropipette and rose to the water
406
surface within the tank. An ultrasound beam (1) crossed the trajectory
407
of the bubbles. Acoustic emission and reception were performed by the
408
MCMG system (4) connected to a computer. 25
5 Map of US field without skull. Simulated US beam (Top) and Measured
410
US beam (bottom). The maximum pressure levels were reported for each
411
location. The focal area was near the point (0 cm, 4 cm). The principal
412
lobe and the secondary lobes can be recognized. 26
413
6 Mapping of US field with skull. Simulated US beam (Top) and Measured
414
US beam (bottom). The maximum pressure levels are reported for each
415
location. The focal area was near the point (2.1 cm, 2.7 cm). The principal
416
lobe and the secondary lobes can be recognized. 27
417
7 In vitro experiment (embedding medium: water). Trajectory of bubble
418
flow deviated by the US beam (2MHz). a) Without a skull the bubble
419
displacement was a few centimeters and b) with a human skull the bubble
420
displacement between the transducer and the bubble flow was a few
421
millimeters. P RF = 8 kHz, N = 20, Ispta = 450 mW/cm 2
. 28
422
8 In vitro experiment in water without a skull. a) time representation of
423
an MES, b) Time frequency representation (Wigner-Ville Transform
424
for improved time-frequency resolution) of a Doppler signal. MES were
425
obtained by means of a TCD system (Atys Medical) (P RF = 8kHz,
426
N = 20 cycles, f = 2MHz, Ispta = 450mW/cm 2
). Gaseous embolus
427
(R0 ≈ 100 µ m) circulating in a tube filled with water (in vitro experiment
428
depicted in Fig.3) (upper graph), ∆f/∆t= (600 − 200)/0.02 = 20kHz/s.
429
c) Time representation of an MES and d) Time frequency representation
430
of an MES. A fat particle (R0 ≈ 300 µ m) (piece of pork) circulating in
431
a tube filled with water (in vitro experiment depicted in Fig.3) (bottom
432
graph), ∆f/∆t ≈ 0 Hz/s. The speed of the fluid was identical for all
433
experiments. 29
Table 1
Embolus differentiation based on FMI and PMI (MCMG system and experimental setup illus-trated in Fig.3) for bubbles R0 ≈ 100µm and fat particles 100 < R0(µm) < 300 immersed in
water. Ispta= 450 mW/cm2, P RF = 1 kHz, N = 25, f = 2 MHz.
type/parameter FMI (Hz/s) PMI (mm/s)
fat 20 6
gas 5 8
9 Time-depth representation of four gaseous emboli (evaluated radius of
435
≈ 200 µ m) circulating in water obtained with the MCMG system as
436
described in the experimental setup in Fig. 4). f = 2MHz, P RF = 1kHz,
437
N = 25, P a = 500kPa. ∆D/∆t = (180 − 80)/(3) ≈ 30 mm/s. Note that
438
the thickness of the vertical signature corresponds to ct/2 = cN/f /2 =
439
1540m/sx25/2MHz/2 ≈ 10 mm. 30
440
10 Frequency modulation index (FMI) for gaseous and solid emboli in the
441
presence or absence of a skull in water (η = 1mPa). These measurements
442
were obtained from the experimental setup illustrated in Fig. 4. + =
443
one measurement (several crosses can be superimposed),o=mean of all
444 measurements. Ispta= 450 mW/cm 2 , N = 20, P RF = 8 kHz. 31 445 446
Fig. 1. In vivo experiment (embedding medium: blood). Gaseous microembolic signature ob-tained from the middle cerebral artery (depth 50mm). Setting parameters: P RF = 2.7 kHz, N = 20 (number of cycles), f0 = 2M Hz, Ispta = 450 mW/cm2. a) Temporal representation
of a microembolic signal. b) Time frequency representation of the Doppler signal from which the FMI evaluated in the decelerating phase is ∆f/∆t = 330/0.013 = 25kHz/s. The reversed
”V” shape, which seems to be representative of a gaseous embolic signature, is similar to that reported by Smith et al. (1997) for which the FMI evaluated in the decelerating phase was ∆f/∆t= 800/0.020 = 40kHz/s.
Fig. 2. Photograph of the experimental setup required to map the acoustic field.
Fig. 3. Diagram of experimental setup. A gear pump (4) circulates degassed water in a tygon tube (2). This tube crosses a water tank (1) in which a transcranial Doppler transducer (3) is immersed. Circulating emboli are thus detected by the pulsed wave (PW) Doppler system (5)(usual TCD and MCMG systems).
Fig. 4. Diagram of experimental setup. A micropipette (2) connected to a gas flow (3) (Eppendorf air generator) was immersed in a water tank. Bubbles were produced at the extremity of the micropipette and rose to the water surface within the tank. An ultrasound beam (1) crossed the trajectory of the bubbles. Acoustic emission and reception were performed by the MCMG system (4) connected to a computer.
Fig. 5. Map of US field without skull. Simulated US beam (Top) and Measured US beam (bottom). The maximum pressure levels were reported for each location. The focal area was
Fig. 6. Mapping of US field with skull. Simulated US beam (Top) and Measured US beam (bottom). The maximum pressure levels are reported for each location. The focal area was near
Fig. 7. In vitro experiment (embedding medium: water). Trajectory of bubble flow deviated by the US beam (2MHz). a) Without a skull the bubble displacement was a few centimeters and b) with a human skull the bubble displacement between the transducer and the bubble flow was a few millimeters. P RF = 8 kHz, N = 20, Ispta= 450 mW/cm2.
0.01 0.02 0.03 0.04 0.05 0.06 0.07 0.08 −1 −0.5 0 0.5 1 Amplitude (V) Time representation Time (in s) Frequency (in Hz) Wigner−Ville Transform 0.01 0.02 0.03 0.04 0.05 0.06 0.07 0.08 0 200 400 600 800 1000 1200 a) b) 0 0.05 0.1 0.15 0.2 −1 −0.5 0 0.5 1 Amplitude time ( in s) frequency (Hz) Wigner−Ville Transform 0 0.05 0.1 0.15 0.2 0 200 400 600 800 1000 1200 c) d)
Fig. 8. In vitro experiment in water without a skull. a) time representation of an MES, b) Time frequency representation (Wigner-Ville Transform for improved time-frequency resolution) of a Doppler signal. MES were obtained by means of a TCD system (Atys Medical) (P RF = 8kHz, N = 20 cycles, f = 2MHz, Ispta = 450mW/cm2). Gaseous embolus (R0 ≈ 100 µ m)
cir-culating in a tube filled with water (in vitro experiment depicted in Fig.3) (upper graph), ∆f/∆t = (600 − 200)/0.02 = 20kHz/s. c) Time representation of an MES and d) Time
fre-quency representation of an MES. A fat particle (R0 ≈ 300 µ m) (piece of pork) circulating in
a tube filled with water (in vitro experiment depicted in Fig.3) (bottom graph), ∆f/∆t ≈ 0 Hz/s. The speed of the fluid was identical for all experiments.
Time motion representation Time (s) Depth (mm) 0 0.5 1 1.5 2 2.5 3 3.5 4 60 80 100 120 140 160 180 200
Fig. 9. Time-depth representation of four gaseous emboli (evaluated radius of ≈ 200 µ m) circulating in water obtained with the MCMG system as described in the experimental setup in Fig. 4). f = 2MHz, P RF = 1kHz, N = 25, P a = 500kPa. ∆D/∆t = (180 − 80)/(3) ≈ 30
mm/s. Note that the thickness of the vertical signature corresponds to ct/2 = cN/f /2 = 1540m/sx25/2MHz/2 ≈ 10 mm.
Bubble Pork Bubble Pork 101 102 103 104 105
Frequency modulation index [Hz/s]
Without skull With skull
o Mean value
+ Experimental points
Fig. 10. Frequency modulation index (FMI) for gaseous and solid emboli in the presence or ab-sence of a skull in water (η = 1mPa). These measurements were obtained from the experimental setup illustrated in Fig. 4.+= one measurement (several crosses can be superimposed),o=mean of all measurements. Ispta= 450 mW/cm2, N = 20, P RF = 8 kHz.