OATAO is an open access repository that collects the work of Toulouse
researchers and makes it freely available over the web where possible
Any correspondence concerning this service should be sent
to the repository administrator:
[email protected]
This is an author’s version published in: http://oatao.univ-toulouse.fr/23230
To cite this version:
Safi, Carl
and Liu, Dylan Z. and Yap, Benjamin H. J. and Martin, Gregory J.
O. and Vaca-Garcia, Carlos
and Pontalier, Pierre-Yves
A two-stage
ultrafiltration process for separating multiple components of Tetraselmis suecica
after cell disruption. (2014) Journal of Applied Psychology, 26 (6). 2379-2387.
ISSN 0921-8971
DOI 10.1007/s10811-014-0271-0
A two-stage ultrafiltration process for separating multiple
components of Tetraselmis suecica after cell disruption
Carl Safi• Dylan Z. Liu • Benjamin H. J. Yap • Gregory J. O. Martin • Carlos Vaca-Garcia • Pierre-Yves Pontalier
Abstract A two-stage ultrafiltration process was applied to
the aqueous phase of Tetraselmis suecica after breaking its cell wall by high-pressure homogenization. Microscopie observa tion revealed that the cells were completely disrupted from 600 bar and cell fragmentation of the cells was also noticeable after 800 bar. In addition, the highest concentration of all the molecules of interest in the aqueous phase was observed at 1,000 bar and a temperature of 46 °C while preserving the integrity of the molecules of interest in the downstream pro cess. After centrifugation, the aqueous phase was submitted to ultrafiltration through two consecutive membranes of different molecular weight cutoffs. Complete retention of starch was possible with a 100-kDa membrane and separation of sugars from proteins with a 10-kDa membrane on the remaining mixture. After testing the process with model solutions, the transmembrane pressure selected was 2.07 bar, which succeeded in retaining starch and pigments during the first part of the process, and proteins during the second part. A linear correlation between the permeate flux rate and the pressure was observed in both parts of the process.
Keywords High-pressure homogenization • Proteins •
Pigments • Sugars • Starch • Ultrafiltration
C. Safi (C81) · C. Vaca-Garcia · P.-Y. Pontalier
INP-ENSIACET, LCA (Laboratoire de Chimie Agro-industrielle), Université de Toulouse, 31030 Toulouse, France
e-mail: [email protected]
C. Safi· C. Vaca-Garcia · P.-Y. Pontalier UMR 1010 CAl, INRA, 31030 Toulouse, France D. Z. Liu· B. H. J. Yap · G. J. O. Martin
Department of Chemical and Biomolecular Engineering, University of Melbourne, Parkville, Victoria 3010, Australia C. Vaca-Garcia
King Abdulaziz University, Jeddah, Saudi Arabia
Introduction
Microalgae are considered as a promising feedstock for bio fuel production due to their ability to couvert carbon dioxide into carbon-rich lipids (Wijffels and Barbosa 2010). They grow rapidly and do not need arable land. However, the feasibility of this new technology has not yet been exploited on an industrial scale due to its currently uncompetitive high production cost and its overall unsustainable production (Singh and Olsen 2011; Yang et al. 2011). The potential for large-scale commercial exploitation of these microorganisms is possible if they are completely valorised in the framework of a biorefinery (Wijffels and Barbosa 2010; Williams and Laurens 2010).
The majority ofresearch into microalgal biotechnology has focused on the production and accumulation of lipids (Converti et al. 2009; Widjaja et al. 2009), methods for ex traction (Araujo et al. 2013; Halim et al. 2012), analysis (Olmstead et al. 2013) and transformation oflipids to biofuel (Li et al. 2008). Sorne studies have also considered isolating other principal microalgal components such as proteins by solubilisation in alkaline solution followed by precipitation with acid (Barbarino and Lourenço 2005) or polysaccharides by precipitation with ethanol (Gloaguen et al. 2004; Shi et al.
2007).
In order to avoid using solvents and chemicals, alternative techniques to separate components by ultrafiltration already exist and can be scaled up to an industrial level (Susanto et al.
2008). For microalgae, this technique has so far been used mainly for harvesting the cells (Frappart et al. 2011; Zhang et al. 2010), but its use in separating microalgal biomass components in an integrated process has yet to be established. To date, few studies have investigated this technique on microalgae to purify a single component such as the polysac charides of Porphyridium cruentum (Patel et al. 2013), Spiru lina platensis and Chlorella pyrenoidosa (Pugh et al. 2001) or
to examine the role of exopolysaccharides of Chlore/la sp. and Porphyridium purpureum in the fouling of ultrafiltration membranes (Morineau-Thomas et al. 2002). However, there is currently a lack of studies in the literature dealing with separation of multiple components of microalgal biomass.
The microalga concemed in this study is Tetraselmis suecica, which is an ovoid unicellular green flagellated species of 9-13 µm in length and 7-8 µm in width (Renaud et al. 1999). lts biochemical composition covers a variety of potentially valuable components. In particular, its protein content can be high (up to 44 % dry weight) and it has a balanced amino acid profile including both essential and non-essential amino acids (Brown 1991; Lourenço et al. 1998; Schwenzfeier et al. 2011). Carbo hydrates represent 8-57 % dry weight, (D'Souza and Kelly 2000; Renaud et al. 1999; Whyte 1987), with starch being the dominant component when accumulated under nitrogen starvation and low irradiance (Yao et al. 2012). Glucose is the predominant intracellular monosaccharide, followed by galactose, xylose, rhamnose, mannose and arabinose that are present in the polysaccharide compo nents of the cell wall (Brown 1991; Schwenzfeier et al.
2011; Whyte 1987). Lipids can represent from 7 to 30 % of its dry weight, with a fatty acid composition suitable for biodiesel production (Dunstan et al. 1992; Fabregas et al. 1985; Volkman et al. 1989). Like all microalgae, its composition varies according to the growth conditions, which will affect the accumulation of the target components.
The present study investigates the effectiveness of a two-stage ultrafiltration process for separating intemal cell components of T. suecica disrupted by high-pressure ho mogenization. Two membranes with different molecular weight cutoffs are used to separate starch from proteins and sugars in the first step and then proteins from sugars in the second step. The process was first tested on model solutions containing starch, proteins and sugars and then applied to T. suecica.
Materials and methods
All chemicals and biomolecules including soluble starch (C12H22O11) and milk proteins (12-250 kDa) were purchased
from Sigma-Aldrich (USA) and used as received. The Lowry assay kit was purchased from Fisher Scientific.
Microalga Tetraselmis suecica (strain CS 187) was grown in outdoor photobioreactors in a medium with modified 'f-me dium' nutrients and trace elements. This consisted of
200 mg L-1 NaNO
3, 25 mg L-1 KH2PO4, 9.0 mg L-1 iron (III) citrate, 9.0 mg L-1 citric acid, 0.360 mg L-1 MnClz· 4H2O, 0.044 mg L-1 ZnSO4·7H2O, 0.022 mg L-1 CoClz·
6H2O, 0.020 mg L-1 CuSO4 · 5H2O, 0.008 mg L-1 Na2MoO4 ·
2H2O and trace levels of vitamins B 12, biotin and thiamine. Mixing in the photobioreactors was by compressed air aera tion, and temperature and irradiance were dependent on local weather conditions in Melbourne, Victoria, Australia.
Suspensions of T. suecica used in this study were obtained by mixing frozen microalgal paste (containing 5.5 % dry weight) in distilled water to a concentration of approximately 1 7 g L -l dry weight. Aggregates in suspension were dispersed
by stirring for up to 1 h prior to homogenization.
High-pressure homogenization A GEA Panda2K NS1001L high-pressure homogenizer (GEA Niro Soavi, ltaly) with a cell disruption valve (Re+valve) attached was used for cell disruption. T. suecica cells were suspended in distilled water at 17 g L -l and then passed through the homoge
nizer at different pressures ranging from 200 to 1,000 bar. Temperature of the homogenized suspension was moni tored to avoid denaturation of components in the medium. The aqueous extracts (supematants) were recovered after centrifugation at 10,000xg for 10 min at 21 °C for sub sequent processing and analyses.
Madel suspensions Model suspension 1 was composed of 40 % milk proteins (12-250 kDa), 35 % soluble starch and 25 % sugars. Model suspension 2 was composed of 60 % milk proteins (15-250 kDa) and 40 % sugars. Both suspensions were vigorously stirred for 2 h to ensure maximum solubilisation in distilled water (ratio 1 :5, w/v).
Ultrafiltration Model suspensions and the supematant of the homogenized aqueous phase of T. suecica were fractionated by two-step ultrafiltration using a Labscale™ TFF system (Millipore, USA). The TFF system includes a 500-mL acrylic reservoir with a base containing a magnetic stirrer and a diaphragm pump, plus two pressure gauges with the retentate gauge indicating the pressure of the fluid exiting the Pellicon XL 50 ( cm2
) device. Two different Pellicon XL 50 ( cm2)
polyethersulfone membranes cartridges were used with differ ent molecular weight cutoffs ( 100 and 10 kDa ).
Two modes were tested for the model solutions, recycling mode and concentration mode. During the recycling mode, both retentates and permeates were recycled in order to select the appropriate transmembrane pressure from 0.69 to 2.07 bar, and then during the con centration mode, the retentate was recycled while the permeate was recovered until it reached two thirds of the initial injected volume. During this step, samples were taken from both phases for further analysis, and the feed solution in both modes for each step of the process was filtered followed by the necessary analysis of the retentate and permeate. During both modes, the feed solution is constantly stirred in the feed chamber to ensure complete
solubilisation of the components in the extract. The per meate flux rate was evaluated from the following equa tion:
Permeate flux rate (kg h-1 m-2)
=
permeate mass recovered(kg)/time (h) x membrane surface (m2) After each run, the membranes were cleaned using the following procedure: flushing with distilled water, then cleaning with 0.1 M NaOH solution for 60 min and then rinsing with distilled water for 30 min at 1.38 bar.
Pigment analysis A total of 200 µL of supernatant was mixed with 1,300 µL pure methanol and then incubated in the dark for 1 h at 45 °C. Samples were centrifuged at 10,000xg for 10 min at 20 °C. The organic phase (methanol) containing the pigments was recovered, and constituents were determined using the equations ofRitchie (2006):
Total chlorophyll(mgL-1) = (9.3443 x A652) + (4.3481 x A665)
(1)
Totalcarotenoids ( mg L -I)
=
4 x A480 (2)Sugar analysis The procedure consists of adding 0.25 mL of the sample to 0.75 mL distilled water and 2 mL of DNS reagent. The mixture was vortexed and then heated at 90 °C for 5 min. Immediately after, 2 mL distilled water was added, and then the mixture was cooled at room temperature for 2-3 min after being vortexed. The colour of the mixture should be dark red and then mea sured by a spectrophotometer (Varian Cary 3E UV visible spectrophotometer) at 570 nm after being zeroed with the blank solution, consisting of the same mixture with only distilled water replacing the sample.
Starch-iodine assay The analysis consists of m1xmg 0.25 mL of supematant sample with 5 mL of iodine reagent. The mixture is then vortexed for 5 s and then stranded for 2-5 min for the colour to stabilize. Absor bance is measured at 620 nm against a blank of distilled water and iodine reagent.
Protein analysis Lowry assay: The procedure involves reac tion of proteins with cupric sulphate and tartare in an alkaline solution, leading to the formation of tetradentate copper protein complexes. The addition of the Folin Ciocalteu reagent leads to the oxidation of the peptide bonds by forming molybdenum blue with the copper ions. Therefore, a calibration curve was prepared using a con centration range of bovine standard albumin from O to
1,500 µg mL-1. In order to measure the protein content, 0.2 mL of each standard or sample containing the crude protein extract was withdrawn and then 1 mL of modified Lowry reagent was added to each sample. They were then vortexed and incubated for exactly 10 min. After incuba tion, 100 µL of Folin-Ciocalteu reagent (1 N) was added and again vortexed and incubated for exactly 30 min. The blue-coloured solution was then measured at 750 nm with a UV-1800 Shimadzu spectrophotometer after being zeroed with a blank sample containing all the chemicals minus the extract. SDS-PAGE: The protein content of the super natants, the permeates and the retentates was analysed by SDS-PAGE using a BioRad Criterion Cell electrophoresis unit (BioRad Laboratories, USA). The SDS-PAGE was performed by diluting the samples four times with distilled water. First, 20 µL of diluted samples was mixed with 22 µL of BioRad Laemmli buffer containing 5 % beta mercaptoethanol and placed in a boiling water bath for 5 min. Next, aliquots (10 µL) of samples were loaded into 8-16 % linear gradient precast Tris-HCl Criterion 18 well gels and run at 100 V for 130 min. Gels were stained with Biosafe Coomassie Blue (BioRad) and digitally scanned and quantified using a BioRad Gel Doc XR + Imager (BioRad, USA).
Optical microscopy All observations were performed using an Olympus BX51 light microscope with a DP72 digital camera attachment under white light without dyes.
Results
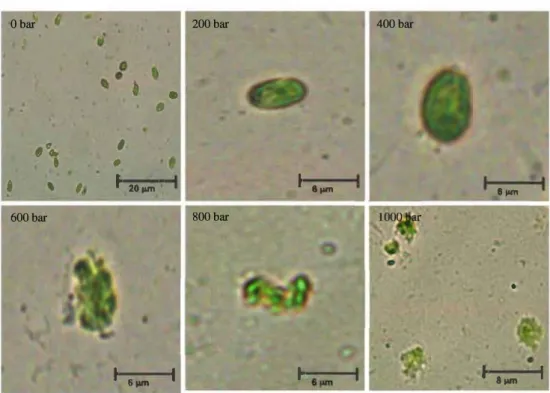
High-pressure homogenization was used to disrupt T suecica to allow recovery and subsequently fractionate its intemal components. The efficiency of cell disruption as a function of homogenization pressure was examined microscopically (Fig. 1) and quantitatively by measuring the concentration of the biomolecules released in the aqueous phase (Fig. 2). It can be seen that 1,000 bar was the best pressure in terms of cell disruption and release of biomolecules in the aqueous phase.
Correlation between the permeate flux rate and the different transmembrane pressures (TMP) was R2=0.88 (Fig. 3). Since the permeate flux rate for 30 min was greatest at 2.07 bar with a value of 47.83 kg h-1 m-2, and the fouling was no worse
than at lower pressures, 2.07 bar was used for subsequent tests performed in concentration mode. In the latter tests, the con centration was managed until a volumetric concentration ratio of2.32±0.04 was obtained after 30 min, with a final permeate flux rate of 42.8 ±1.3 kg h-1 m-2. Complete retention ofstarch
Fig. 1 Microscopie observation before and after cell disruption of
T. suecica. 1 Before disruption, 2 200 bar, 3 400 bar, 4 600 bar, 5 800 bar, 6 1,000 bar Obar
•
•
,o,-
'
•
'
.
,.
f ....
1 600bar1 ·- 1
A more linear relationship between permeate flux rate and TMP was observed when operating the 10-kDa mem brane in recycling mode using the second model solution containing sugars and milk proteins (Fig. 3) with no starch. The highest initial permeate flux rate of55.43 kg h-1 m-2
was obtained at a TMP of 2.07 bar. This permeate flux rate decreased to 50.39 kg h-1 m-2 after 30 min of processing.
Concentration mode was again operated at 2.07 bar with a stable permeate flux rate of 44.30 ±1.2 kg h-1 m-2 obtained
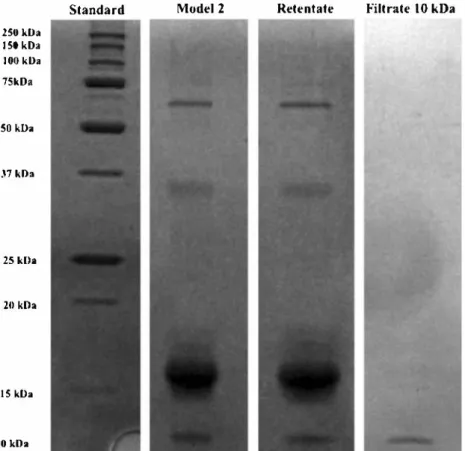
for the 30 min of operation to reach a volumetric concen tration ratio of3.0l±0.05. The mass balance indicated that 4 to 5 % of the sugars were detected in the membrane due to the high concentration of these components in the solution, but protein loss was negligible ( < 1 % ) based on Lowry assay measurements of the permeate. Nearly complete reten tion of the proteins was also verified by SDS-PAGE analysis of the permeates, showing only a very low intensity band of low molecular weight proteins, close in size to the
Fig.2 Concentration of the 9
components present in the 8
aqueous phase after cell iî' 7
disruption and before � 6
ultrafiltration. Results are the �
=
0 5♦ ♦
mean of three replicates for three ,0
4 experiments±SD (n=9) �
"
3 ...=
2• •
0 u 0 El El•
•
El 0 500 200bar 400bar1 ...
....
800bar•
t
1 ... 1
membrane cutoff (Fig. 4). Finally for sugars, the operation in concentration mode for 30 min at 2.07 bar allowed 63 % of the sugars to be transferred to the permeate.
The process was then applied to the aqueous phase of
T. suecica, less concentrated in the biomolecules of interest
compared to the model suspensions. The results of ultrafiltra tion are presented in Tables 1 and 2. In addition, during the concentration mode on both membranes, there was significant correlation between the permeate flux rate and the homogeni zation pressure (Fig. 5). Hence, at a TMP of 2.07 bar, the highest fmal permeate flux rate was 262±2 kg h-1 m -2 for the
100-kDa membrane. This permeate flux decreased constantly as a function of increasing homogenization pressure, reaching 174±2 kg h-1 m-2 for lysates obtained at 1,000 bar (Fig. 5). A
decline in permeate flux rate as a function of disruption pressure was similary observed for UF with the 10-kDa mem brane. Here, the maximum permeate flux was 229± 2 kg h -l m -2 for samples homogenized at 200 bar, decreasing
• Sugars (GlcEq) 10 ♦Cblorophyll
♦ DProteins 9 ■Carotenoids AStarch
:;-
8 t1
7 6=
0•
,0..
5 � 4•
"
...
=
3•
0 2•
u•
[] 1•
■ ■ El ■ 0 1000 1500 0 500 1000 1500Recycling mode (100 kDa) Recycling mode 100 kDa 80 70
•
� � R'= 0,8869 70•
♦2.07 bar 60 1; 60•
□ 1.72 bar}
50 OJ) lil•
Fig. 3 Recycling mode ofboth model solutions. Model 1 with 100 kDa and model 2 with 10 kDa. Results are based on the three replicates for three
experiments±SD (n=9) ë
"
50•
• •
□
.A.1.38 bar � 40 -:. 40 il! Âli!
�..
"
=
30m
�□
..
30 � o 1.03 bar �=
"
20 i!j il!'
=
20 -:. X0.69 bar � � 10"
10 0..
0"
"
Il,, 0 10 20 30 40 Il,, 0 2 3 4 5 6Time (min) Transmembrane pressure (bar)
Recycling mode (10 kDa) Recycling mode 10 kDa
70 � 60
)
•
•
60 50• •
• •
'1□
♦2.07 bar ,l:; 50 40 Â□ □ □
□ 1.72 barl
 � � 40"
 Â"
-:...
30 -:.2
0 .A.1.38 bar..
30"
0 0 0=
=
20 0=
20=
"
o 1.03 bar )K )K )K )K )K"
-:. 10 -:. 10 � X0.69 bar � 0"
0"
0 10 20 30 40 Il,, 0 2 3 4 5 6 Il,,Time (min) Transmembrane pressure (bar)
to 181±1 kg h-1 m-2 for lysates obtained at 1,000 bar. In all
cases, these fluxes are higher than those obtained with the also may be because of the presence of other compounds. model solution because of a lower initial concentration and Fig. 4 SDS-PAGE after
ultrafiltration of the second model suspension with 10-kDa membrane 250 kDa ISO kDa lllO kDa 75kDa SO kDa .l7 kDa 25 kDa 20 kDa JS kDa Ill kDa
Table 1 Composition of
penne-ate 1 after ultrafiltration with 100- High-pressure Sugars (g Proteins Starch Chlorophyll Carotenoids kDa membrane of the aqueous homogenization (bar) GlcEqL-1) (g L -1) (g L -1) (mg L -1) (mg L -1) phases after cell disruption of
T. suecica. Results are the mean of 0 n.d. 0.10±0.01 n.d. n.d. n.d.
three replicates for three experi- 200 3.45±0.04 0.23±0.01 n.d. n.d. n.d.
ments±SD (n=9) 400 3.66±0.04 0.26±0.01 n.d. n.d. n.d. 600 4.55±0.01 0.33±0.03 n.d. n.d. n.d. 800 5.42±0.01 0.46±0.01 n.d. n.d. n.d. 1,000 5.98±0.16 0.70±0.03 n.d. n.d. n.d. n.d. not detected Discussion High-pressure homogenization
The cells were resistant at pressures up to 400 bar, while the temperature increased only from 21 to 32 °C. However, the efficiency ofhigh-pressure homogenization started to be seen from 600 bar, with ruptured cells losing their globular shape. Then, besides being broken, it was observed that cells were also severely fragmenting after applying 800 or 1,000 bar with a continuing increase in temperature up to 46 °C, and com plete disruption of the cell wall might be accompanied by possible alteration of the phospholipid bilayers of the intemal organelles. In parallel to the increase in cell rupture as a function of pressure, there was also an expected increase of intracellular components (starch, sugars, proteins and pig ments) remaining in supematants of centrifuged lysates (Fig. 2). The rise in temperature resulting from homogeniza tion (32 °C at 400 bar, 46 °C at 1,000 bar) may have also played a role in solubilising some components, especially starch and proteins. Without sufficient solubilisation resulting from the heating of the medium, the starch granules would remain in pelleted cell debris after centrifugation. However, even at 1,000 bar, the temperature rise to 46 °C was below that required for protein denaturation and starch gelatinization. Homogenization at 1,000 bar was thus effective at achieving cell disruption to release part of the intracellular components into the aqueous phase while not damaging the protein com ponent. The increase in chlorophyll released as a function of homogenization pressure indicates that the chloroplast was Table 2 Concentration of the
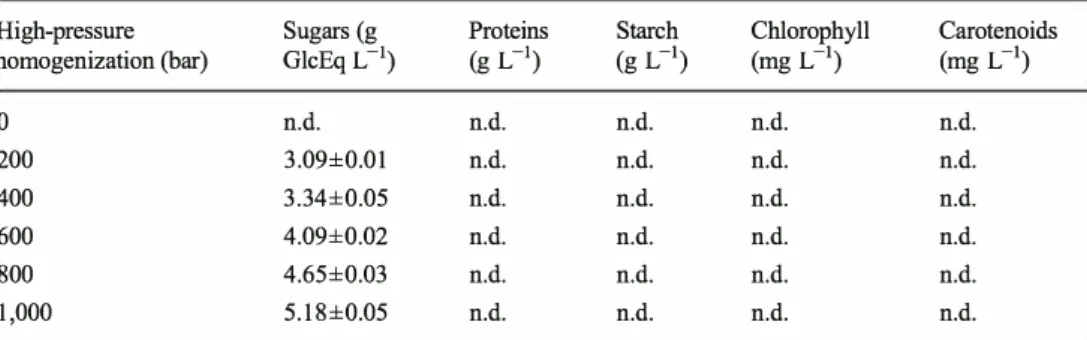
High-pressure Sugars (g
broken, allowing water to penetrate the inter-thylakoid space where the green pigment and some carotenoids are located. However, these pigments are hydrophobie, and their presence in the aqueous phase involves adsorption onto very small cell debris that did not decant with the pellet after centrifugation or their presence inside small lipid droplets ( emulsion) or even attached to amphiphilic structures (phospholipids).
Ultrafiltration process
The first step of the ultrafiltration process employing a 100-kDa membrane is to retain starch while allowing proteins and sugars to pass into the permeate. Then, since according to Schwenzfeier et al. (2011 ), T. suecica proteins are between 15 and 50 kDa, the second step employs a-10 kDa membrane in order to retain proteins while allowing sugars to be concen trated in the permeate. The process was first conducted on the concentrated model solutions in order to verify its feasibility on a highly concentrated suspension and to obtain the neces sary parameters. Afterwards, it was extrapolated on the microalgal extract obtained after breaking the cell wall of T. suecica by high-pressure homogenization. Nonetheless, after each trial, the concentration of the different biomolecules was calculated for the retentates and the permeates to deter mine the mass balance.
Model suspensions
A 100-kDa amount was used to separate model suspension 1 (proteins, starch and sugars), whereas a 10-kDa sample was
Proteins Starch Chlorophyll Carotenoids sugars in penneate 2 after
ultra-filtration at 10 kDa. Results are homogenization (bar) GlcEq L-1) (g L-1) (g L-1) (mg L-1) (mg L-1) the mean of three replicates for
three experiments±SD (n=9) 0 n.d. n.d. n.d. n.d. n.d. 200 3.09±0.01 n.d. n.d. n.d. n.d. 400 3.34±0.05 n.d. n.d. n.d. n.d. 600 4.09±0.02 n.d. n.d. n.d. n.d. 800 4.65±0.03 n.d. n.d. n.d. n.d. 1,000 5.18±0.05 n.d. n.d. n.d. n.d. n.d. not detected
Fig. 5 Concentration mode after 30 min on the aqueous phase of
T. suecica. Correlation between the flow rate and the different pressures applied for cell disruption. Results are based on the three replicates for three experiments±SD (n=9)
100 kDa membrane 10 kDa membrane
300 � 250 1 200 � 150 - 100 � "' 50 250 � 200
i
150Ê
100 50 0 +--�-��-�-�-� 0+--�-�--�-�-� 200 400 600 800 1000 200 400 600 800 1000Homogenization pressure (bar) Homogenization pressure (bar) used to separate model suspension 2 (proteins and sugars ). For
both membranes, permeate flux rate decreased with time for 30 min to reach a steady state. With 100 kDa, the decrease seems to be related to a polarisation concentration layer due to the action of the large-sized polysaccharides (Eteshola et al.
1996) that got retained by the 100 kDa membrane and strong ly contributed to the fouling phenomenon (Morineau-Thomas et al. 2002) and thus the formation of an asymptotic curve. With 10 kDa, the decrease is lower, which may be due to the less important influence of this polarisation layer. The differ ence between the compositions ofboth layers is the presence of starch, which can have gelling properties that may hinder filtration. However, in both cases, the steady permeate flux rate increases almost linearly with pressure, indicating the lack of such a gel layer.
Aqueous phases after cell disruption of T. suecica
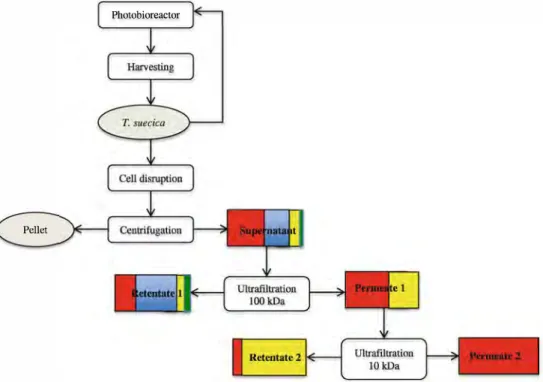
Having demonstrated the effectiveness of a two-stage filtration process for fractionating biomass components Fig. 6 Overall process reflecting
all the steps from growth to fractionation after
homogenization at 1,000 bar. Red
square is for sugars, blue for starch, yellow for proteins, and
green for pigments
Pellet
Photobioreactor
in model solutions, experiments were performed on actual lysates from microalgal material obtained at different ho mogenization pressures using the concentration mode for 30 min. For lysates obtained at all homogenization pres sures, neither starch nor pigments were detected in per meate 1, indicating complete retention of these compo nents in retenta te 2 (Table 1 ). While the retenti on of the starch was expected given the size of the granule, the retention of the pigments could be explained by their presence in small lipid droplets or in very small cell debris remaining in the aqueous medium, and both are larger than the cutoff of the 100-kDa membrane. In addi tion, given the highly hydrophilic characteristics of the membrane (polyethersulfone), it retains the former that are hydrophobie.
While maintaining the TMP constant at 2.07 bar, the per meate flux rate decreased when samples obtained at higher homogenization pressure were tested under the concentration mode for 30 min (Fig. 5). Despite the fact that the lysate obtained at 1,000 bar homogenization pressure contains twice
more proteins than the lysate obtained at 200 bar (Fig. 2), the amount of proteins in permeate 1 increased only from 50 to 80 % in the range. This suggests that the proteins are more aggregated at low homogenization pressure and are therefore retained more by the membrane. The fraction of sugars that was passed through the membrane increased from about 75 to 90 % between 200 and 600 bar homogenization pressure and decreased to about 75 % for lysates produced at 1,000 bar.
Permeate 1 was subsequently ultrafiltrated using a 10-kDa membrane until a volumetric concentration ratio of 2.57± 0.03. According to Lowry assay measurements and SDS PAGE analysis of permeates, no proteins were found in per meate 2 but in retentate 2 for all the samples obtained at different homogenization pressures. The permeation rate of the sugars is approximately 90 % through the 10-kDa mem brane regardless of the pressure used for cell rupture, and 65 % of total sugars present in the supernatant were found in per meate 2. This indicates that at least 65 % of saccharides with an aldehyde function have a size less than 10 kDa (Table 2), and these results are consistent with the study conducted by Schwenzfeier et al. (2011 ), which showed that the proteins of T. suecica have a molecular weight range between 15 and 50 kDa. Most of the proteins were enzymes with multiple polypeptide chains, including Rubisco that has two subunits of 50 and 15 kDa (Schwenzfeier et al. 2011; Wang and Kolattukudy 1996). Full retention of the proteins is therefore expected from ultrafiltration with a 10-kDa membrane. The results indicate that the separation between sugars and pro teins is efficient. Nevertheless, under these conditions, sugar recovery yield is about 50 % but should be increased by diafiltration of the retentate using fresh water.
The global process (Fig. 6) on T. suecica was not jeopardised by any major hurdles, starting from breaking the cell wall until separating the target components by ultrafiltra tion. These results show that it is possible to achieve good separation of intracellular microalgal biomass components using a two-stage sequential UF process. This process could be applied to other microalgae and could be used with various cell disruption techniques and membranes with different mo lecular weight cutoffs depending on the properties of the algae such as the cell strength and protein composition. For in stance, Chlore/la vulgaris proteins are mostly within a molec ular weight range of 12 to 120 kDa (Morris et al. 2009) and Haematococcus pluvialis between 10 and 100 kDa (Kim et al.
2006), and both have more resistant cell walls (Safi et al.
2013).
In conclusion, in this study, multiple microalgal compo nents were fractionated using an integrated process that does not require solvents or environmently hannful chemicals. The overall process was shown to be effective on T. suecica, resulting in three streams enriched in pigments and starch, proteins and sugars respectively. The process could be extrap o lated to other microalgal species, with some minor
modifications with the cutoff of the membranes. lndeed addi tional work is required to optimise the process especially conceming better conditions to maximise the solubilisation of some components of interest without denaturing the rest in the downstream process. Diafiltration would have to be eval uated in order to increase the recovery yields and the separa tion efficiency of each ultrafiltration step. In addition, life cycle assessment of the process would be necessary to evalu ate the energy input and to ensure the sustainability and feasibility of the process on an industrial scale.
Acknowledgments This work was supported by the French national research agency (ANR) within the framework of "the Algoraffmerie" project. The authors are grateful to the "Direction de la Recherche de l'INP" for its additional financial support SMI-2013 and are also sincerely thankful to the Department ofChemical and Biomolecular Engineering of The University of Melbourne for providing the facilities and ail the necessary tools to conduct this work and produce this study.
References
Araujo GS, Matos LJ, Fernandes JO, Cartaxo SJ, Goncalves LR, Fernandes FA, Parias WR (2013) Extraction of lipids from microalgae by ultrasound application: prospection of the optimal extraction method. Ultrason Sonochem 20:95-98
Barbarino E, Lourenço SO (2005) An evaluation of methods for extrac tion and quantification of protein from marine macro- and microalgae. J Appl Phycol 17:447--460
Brown MR (1991) The amino-acid and sugar composition of 16 species of microalgae used in mariculture. J Exp Mar Bio! Eco! 145 :79---99 Converti A, Casazza AA, Ortiz EY, Perego P, Del Borghi M (2009) Effect of temperature and nitrogen concentration on the growth and lipid content of Nannochloropsis oculata and Chlore/la vulgaris for bio diesel production. Chem Eng Process 48: 1146--1151
D'Souza FML, Kelly GJ (2000) Effects of a diet of a nitrogen-limited alga
(Tetraselmis suecica) on growth, survival and biochemical compo
sition of tiger prawn (Penaeus semisulcatus) larvae. Aquaculture 181:311-329
Dunstan GA, Volkman JK, Jeffrey SW, Barrett SM (1992) Biochemical composition of microalgae from the green algal classes Chlorophyceae and Prasinophyceae. 2. Lipid classes and fatty acids. J Exp Mar Bio! Ecol 161:115-134
Eteshola E, Gottlieb M, Arad S (1996) Dilute solution viscosity ofred microalga exopolysaccharide. Chem Eng Sei 51: 1487-1494 Fabregas J, Herrero C, Cabezas B, Abalde J (1985) Mass culture and
biochemical variability of the marine microalga Tetraselmis suecica
Kylin (Butch) with high nutrient concentrations. Aquaculture 49: 231-244
Frappart M, Massé A, Jaffiin MY, Pruvost J, Jaouen P (2011) Influence of hydrodynamics in tangential and dynamic ultrafiltration systems for microalgae separation. Desalination 265:279---283
Gloaguen V, Ruiz G, Morvan H, Mouradi-Givernaud A, Maes E, Krausz P, Strecker G (2004) The extracellular polysaccharide of
Porphyridium sp.: an NMR study of lithium-resistant
oligosaccharidic fragments. Carbohydr Res 339:97-103
Halim R, Danquah MK, Webley PA (2012) Extraction of oil from microalgae for biodiesel production: a review. Biotechnol Adv 30: 709---732
Kim J-D, Lee W-S, Kim B, Lee C-G (2006) Proteomic analysis of proteins expression patterns associated with astaxanthin
accumulation by green alga Haematococcus p luvia lis
(Chlorophyceae) under high light stress. J Microbiol Biotechnol 16:1222-1228
Li Y, Horsman M, Wu N, Lan CQ, Dubois-Calern N (2008) Biofuels from microalgae. Biotechnol Prog 24:815-820
Lourenço SO, Barbarino E, Marquez UML, Aidar E (1998) Distribution of intracellular nitrogen in marine microalgae: basis for the calcula tion of specific nitrogen-to-proteins conversion factors. J Phycol 34: 798--811
Morineau-Thomas 0, Jaouen P, Legentilhomme P (2002) The role of exopolysaccharides in fouling phenomenon during ultrafiltration of microalgae (Chlorella sp. and Porphyridium purpureum): advantage of a swirling decaying penneate flux. Bioprocess Biosyst Eng 25:35--42 Morris HJ, Carrillo OV, Almarales A, Bennudez RC, Alonso ME, Borges L, Quintana MM, Fontaine R, Llaurad6 G, Hernândez M (2009) Proteins hydrolysates from the alga Chlorella vulgaris 87/1 with potentialities in immunonutrition. Biotechnol Appl 26: 162-165 Olmstead IL, Hill DR, Dias DA, Jayasinghe NS, Callahan DL, Kentish
SE, Scales PJ, Martin GJ (2013) A quantitative analysis of microalgal lipids for optimization ofbiodiesel and omega-3 produc tion. Biotechnol Bioeng 110:2096-2104
Patel AK, Laroche C, Marcati A, Ursu AV, Jubeau S, Marchal L, Petit E, Djelveh G, Michaud P (2013) Separation and fractionation of
exopolysaccharides from Porphyridium cruentum. Bioresour
Technol 145:345-350
Pugh N, Ross SA, ElSohly HN, ElSohly MA, Pasco DS (2001) Isolation of three high molecular weight polysaccharide preparations with potent immunostimulatory activity from Spirulina platensis, Aphanizomenon jlos-aquae and Chlorella pyrenoidosa. Planta Med 67:737-742
Renaud SM, Thinh L-V, Pany DL (1999) The gross chemical composition and fatty acid composition of 18 species of tropical Australian microalgae for possible use in mari culture. Aquaculture 170: 14 7-159 Ritchie RJ (2006) Consistent sets of spectrophotometric chlorophyll equations for acetone, methanol and ethanol solvents. Photosynth Res 89:27-41
Safi C, Charton M, Pignolet 0, Silvestre F, Vaca-Garcia C, Pontalier P-Y (2013) Influence ofmicroalgae cell wall characteristics on proteins extractability and determination of nitrogen-to-proteins conversion factors. J Appl Phycol 25:523-529
Schwenzfeier A, Wierenga PA, Gruppen H (2011) Isolation and charac terization of soluble proteins from the green microalgae Tetraselmis
sp. Bioresour Technol 102:9121-9127
Shi Y, Sheng J, Yang F, Hu Q (2007) Purification and identification of polysaccharide derived from Chlorella pyrenoidosa. Food Chem 103:101-105
Singh A, Olsen SI (2011) A critical review ofbiochemical conversion, sustainability and life cycle assessment of algal biofuels. Appl Energy 88:3548-3555
Susanto H, Arafat H, Janssen EML, Ulbricht M (2008) Ultrafiltration of polysaccharide--proteins mixtures: elucidation of fouling mecha nisrns and fouling control by membrane surface modification. Sep PurifTechnol 63:558-565
Volkman JK, Jeffrey SW, Nichols PD, Rogers GI, Garland CD (1989) Fatty acid and lipid composition of 10 species of microalgae used in mari culture. J Exp Mar Bio! Eco! 128 :219-240
Wang X, Kolattukudy PE (1996) Isolation of a proteins containing covalently linked large and small subunits of ribulose-1,5-bisphosphate carboxylase/oxygenase from Botryococcus braunii.
Plant Physiol 111 :441-445
Whyte JNC (1987) Biochemical composition and energy content of six species of phytoplankton used in mariculture of bivalves. Aquaculture 60:231-241
Widjaja A, Chien C-C, Ju Y-H (2009) Study ofincreasing lipid produc tion from fresh water microalgae Chlore/la vulgaris. J Taiwan lnst Chem Eng 40: 13-20
Wijffels RH, Barbosa MJ (2010) An outlook on microalgal biofuels. Science 329(5993):796-799
Williams PJB, Laurens LML (2010) Microalgae as biodiesel & biomass feedstocks: review & analysis of the biochemistry, energetics & economics. Energy Environ Sei 3:554--590
Yang J, Xu M, Zhang X, Hu Q, Sommerfeld M, Chen Y (2011) Life-cycle analysis on biodiesel production from microalgae: water footprint and nutrients balance. Bioresour Technol 102:159--165
Yao C, Ai J, Cao X, Xue S, Zhang W (2012) Enhancing starch production of a marine green microalga Tetraselmis subcordiformis through nutrient limitation. Bioresour Technol 118:438-444
Zhang X, Hu Q, Sommerfeld M, Puruhito E, Chen Y (2010) Harvesting algal biomass for biofuels using ultrafiltration membranes. Bioresour Technol 101:5297-5304