An Analogue Approach to Identify Extreme
Precipitation Events: Evaluation and Application
to CMIP5 Climate Models in the United States
Xiang Gao, C. Adam Schlosser, Pingping Xie,
Erwan Monier and Dara Entekhabi
The MIT Joint Program on the Science and Policy of Global Change is an organization for research, independent policy analysis, and public education in global environmental change. It seeks to provide leadership in understanding scientific, economic, and ecological aspects of this difficult issue, and combining them into policy assessments that serve the needs of ongoing national and international discussions. To this end, the Program brings together an interdisciplinary group from two established research centers at MIT: the Center for Global Change Science (CGCS) and the Center for Energy and Environmental Policy Research (CEEPR). These two centers bridge many key areas of the needed intellectual work, and additional essential areas are covered by other MIT departments, by collaboration with the Ecosystems Center of the Marine Biology Laboratory (MBL) at Woods Hole, and by short- and long-term visitors to the Program. The Program involves sponsorship and active participation by industry, government, and non-profit organizations.
To inform processes of policy development and implementation, climate change research needs to focus on improving the prediction of those variables that are most relevant to economic, social, and environmental effects. In turn, the greenhouse gas and atmospheric aerosol assumptions underlying climate analysis need to be related to the economic, technological, and political forces that drive emissions, and to the results of international agreements and mitigation. Further, assessments of possible societal and ecosystem impacts, and analysis of mitigation strategies, need to be based on realistic evaluation of the uncertainties of climate science.
This report is one of a series intended to communicate research results and improve public understanding of climate issues, thereby contributing to informed debate about the climate issue, the uncertainties, and the economic and social implications of policy alternatives. Titles in the Report Series to date are listed on the inside back cover.
Ronald G. Prinn and John M. Reilly
Program Co-Directors
For more information, please contact the Joint Program Office
Postal Address: Joint Program on the Science and Policy of Global Change 77 Massachusetts Avenue
MIT E19-411
Cambridge MA 02139-4307 (USA)
Location: 400 Main Street, Cambridge
Building E19, Room 411
Massachusetts Institute of Technology
Access: Phone: +1.617. 253.7492
Fax: +1.617.253.9845
E-mail: globalchange@mit.edu
Web site: http://globalchange.mit.edu/
An Analogue Approach to Identify Extreme Precipitation Events: Evaluation and Application to CMIP5 Climate Models in the United States Xiang Gao§*, C. Adam Schlosser*, Pingping Xie†, Erwan Monier*and Dara Entekhabi‡
Abstract
Global warming is expected to alter the frequency, intensity, and risk of extreme precipitation events. How-ever, global climate models in general do not correctly reproduce the frequency and intensity distribution of precipitation, especially at the regional scale. We present an analogue method to detect the occurrence of extreme precipitation events without relying on modeled precipitation. Our approach is based on the use of composites to identify the distinct large-scale atmospheric conditions associated with widespread out-breaks of extreme precipitation events across local scales. The development of composite maps, exemplified in the south-central United States and the Western United States, is achieved through the joint analysis of 27-yr (1979–2005) CPC gridded station data and NASAs Modern Era Retrospective-analysis for Research and Applications (MERRA). Various circulation features and moisture plumes associated with extreme pre-cipitation events are examined. This analogue method is evaluated against the MERRA reanalysis with a success rate of around 80% in detecting extreme events within one or two days. When applied to the climate
model simulations of the 20thcentury from Coupled Model Intercomparison Project Phase 5 (CMIP5), we
find the analogues from the CMIP5 models produces more consistent (and less uncertain) total number of extreme events compared against observations as opposed to using their corresponding simulated precipi-tation over the three regions examined. The analogues also perform better to characterize the interannual range of extreme days with the smaller RMSE across all the models for all the descriptive statistics (min-imum, lower and higher quartile, median, and maximum). These results suggest the capability of CMIP5 models to simulate the realistic large-scale atmospheric conditions associated with widespread local-scale extreme events, with a credible frequency. Collectively speaking, the presented analyses clearly highlight the comparative and enhanced nature of these results to studies that consider only modeled precipitation output to assess extreme-event frequency.
Contents
1. INTRODUCTION...2
2. DATA SETS...4
2.1 Observed Precipitation...4
2.2 NASA-MERRA Reanalysis...4
2.3 Climate Model Output...4
2.4 Data Processing...5
3. OBSERVED PRECIPITATION STATISTICS...7
3.1 Definition of Extreme Precipitation...7
3.2 Regional and Seasonal Considerations...7
3.3 Study Area...9
4. IDENTIFICATION OF LOCALIZED EXTREME PRECIPITATION EVENTS...10
5. SYNOPTIC REGIMES ASSOCIATED WITH EXTREME PRECIPITATION...12
5.1 South-Central United States (SCUS)...13
5.2 Pacific Coast (PCCA and WAOR)...16
6. APPLICATION OF ANALOGUE METHOD TO CMIP5 HISTORICAL MODEL SIMULATIONS ...16
7. SUMMARY AND DISCUSSIONS...28
8. REFERENCES...32
*Joint Program on the Science and Policy of Global Change, Massachusetts Institute of Technology, Cambridge, MA.
† Climate Prediction Center, NOAA, College Park, MD.
‡ Department of Civil and Environmental Engineering, Massachusetts Institute of Technology, Cambridge, MA.
1. INTRODUCTION
Flooding associated with heavy precipitation is among the most disruptive weather-related hazards for the environment and the economy (Kunkel et al., 1999; Mass et al., 2011). In particular, there is concern that anthropogenic global warming could potentially increase the frequency and intensity of extreme precipitation events (Groisman et al., 2005; Palmer and R¨ais¨anen, 2002; Kunkel et al., 2003). Such increase, which has already been seen over the late 20thcentury, would have substantial implications for public safety, water resource management,
and other significant societal issues.
Climate models are useful tools for understanding and predicting changes in precipitation characteristics. However, previous studies have shown that global climate models in general do not correctly reproduce the frequency and intensity distribution of precipitation. Dai (2006) and Sun et al. (2006) evaluated the performances of 18 coupled global climate models in simulating precipitation characteristics for the current climate. They found that most models overestimate the frequency of light precipitation, but considerably underestimate the frequency of heavy
precipitation. Kharin et al. (2007) demonstrated that simulated present-day precipitation extremes from 14 IPCC AR4 global coupled climate models are weaker in the Tropics and subtropical regions with large uncertainties. Wehner et al. (2010) showed that extreme precipitation events are underestimated over the continental United States in the Community Atmospheric Model version 2 (CAM2). These studies suggest that there exist some common model biases in the simulation of high-frequency heavy precipitation statistics, despite differences regarding the models and observations used, geographical domain analyzed, and quantitative methods employed. Such biases were also found in high-resolution regional models. Gutowski Jr. et al. (2003) showed that a regional climate model overestimates low-density but underestimates
high-density precipitation events for a central U.S. region. Wehner (2013) examined the ensemble of NARCAPP regional climate models and found that many of the models are biased high in extreme precipitation over much of the contiguous United States.
Extreme precipitation often results from the interaction of large-scale (∼100 km) atmospheric features (i.e. moisture-flow and dynamical instabilities) and local phenomena (i.e. terrain and other surface features). Lack of skill in climate models’ regional distributions of precipitation is influenced by inadequate parameterization and/or representation of vertical motions, cloud
microphysical processes, convection and orography at the native grid scale of climate models. On the other hand, it has been shown that climate models do simulate fairly realistic large-scale atmospheric circulation features associated with extreme precipitation events, mostly because these features represent solutions of the common, well-understood and numerically resolved equations. Hewitson and Crane (2006) demonstrated that precipitation downscaled from
synoptic-scale atmospheric circulation changes in multiple GCMs can provide a more consistent projection of precipitation change than the GCMs precipitation. The regional climate models are also shown to be capable of reproducing the large-scale physical mechanisms that are observed with extreme precipitation over the Maritime Alps (Boroneant et al., 2006) and the Upper Mississippi River Basin region (Gutowski Jr. et al., 2008). Using the North American Regional
Reanalysis (NARR), DeAngelis et al. (2012) evaluated the climate model simulations of daily precipitation statistics and the large-scale physical mechanisms associated with extreme
precipitation from the third phase of the Coupled Model Intercomparison Project (CMIP3) over North America. They found that there exist robust biases in intensity of heavy and extreme precipitation among the models. However, the models were found to capture the large-scale physical mechanisms linked to extreme precipitation realistically, although the strength of the associated atmospheric circulation features tends to be overestimated. These results suggest that circulation analyses may give more robust indication of the occurrence and change in extreme precipitation events than simulated precipitation alone.
Multiple efforts have been made to identify distinct large-scale dynamical conditions (also known as composites) inducing local scale extremes (Rudari et al., 2004, 2005; Grotjahn, 2011; DeAngelis et al., 2012), where the development of the composites is generally achieved by conditioning atmospheric reanalysis primitive states on the occurrence of extreme events identified from local surface station observations. The unique part is that such an approach bridges the scale gap between resolved large-scale features and heavy precipitation in localized regions that are below the coarse resolution of the reanalysis data. In addition, the composites are based on a large ensemble of extreme events instead of a few cases, ensuring that their statistics are robust and sound. Our work builds on and expands upon the heritage of previous studies. We develop composites of the distinct synoptic patterns for the dependence of widespread localized extreme precipitation through the joint analysis of fine-scale surface precipitation observations and coarse-grid atmospheric reanalysis data. The composites are then used to assess the corresponding large-scale atmospheric fields in the late 20thcentury simulations from an
ensemble of CMIP5 coupled climate models for the frequency of their appearance. We examine the performances of state-of-the-art climate models in detecting the occurrence of extreme precipitation events with this analogue approach by comparison with the observations and
model-simulated precipitation. Our objectives are to answer such questions as: Can this analogue approach based on relevant large-scale atmospheric features provide useful skill in characterizing the statistical nature (frequency) of extreme precipitation events? How does its performance compare with those of observations and previous assessments based mostly on precipitation simulations? Is the approach robust enough to be applicable to various regions with similar performances? Here we present a prototype intended to address these questions.
The structure of the paper is as follows. In Section 2, we describe the observations, reanalysis, and climate model simulations used in this study. The observed precipitation statistics over the United States are given in Section 3. In Section 4, the objective selection criterion for the large sample of extreme events widespread at local scale is presented. Section 5 reports the observed common large-scale weather conditions for the local extreme precipitation events over our various study regions. This also includes the assessment of the statistical nature of these composites. In order to identify the occurrence of extreme events associated with these composites, we introduce and develop a “Minimum Contingent of Criterion (MCC)”. Described in Section 5.1, the MCC serves as the foundation for our analogue detection. The benchmark evaluation of the established
composites as predictive analogues against CMIP5 historical climate model simulations are presented and discussed in Section 6. A summary and conclusions are provided in Section 7. 2. DATA SETS
2.1 Observed Precipitation
High quality observations of accumulated daily precipitation were obtained from the NOAA CPC (Climate Prediction Center) unified rain gauge-based analysis (Higgins and Center, 2000). These observations, spanning from 1948 to present, are confined to the continental United States land areas and gridded to a 0.25◦x 0.25◦ resolution from roughly 10,000 daily station reports. Although interpolation of station data may damp the magnitude of large precipitation events at individual locations, this smoothing effect is small over regions with a dense gauge network, including the Central and Eastern United States. The density of stations is usually the least in the western mountainous and desert regions. The analysis was produced using an optimal
interpolation scheme and went through several types of quality control including duplicate station and buddy checks, among others. Potential sources of uncertainty in the analysis include the station density and its change over time as well as missing data. However, the percentage of missing days at any grid cell is no more than 0.5% over the entire period, and therefore the missing data should not impact the results presented here. For the purposes of this exercise, the gridded daily analysis is used instead of raw station data, in part because the gridded data have undergone rigorous quality control.
2.2 NASA-MERRA Reanalysis
Modern Era Retrospective-analysis for Research and Applications (MERRA) (Rienecker et al., 2011) was used as observed data for the derivation of large-scale atmospheric patterns associated with the localized extreme precipitation. The MERRA use the GEOS-5 atmospheric circulation model, the Catchment land surface model, and an enhanced three-dimensional variational data assimilation (3DVAR) analysis algorithm. The data assimilation system of GEOS-5 implements Incremental Analysis Updates (IAU) procedure in which the analysis correction is applied to the forecast model states gradually. This has ameliorated the spin-down problem with precipitation and greatly improved aspects of stratospheric circulation. MERRAs physical parameterizations have also been enhanced so that the shock of adjusting the model system to the assimilated data is reduced. In addition, MERRA incorporates observations from NASA’s Earth Observing Systems (EOS) satellites, particularly those from EOS/Aqua, in its assimilation framework. The MERRA is updated in real time, spanning the period from 1979 to the present. The three-dimensional 3-hourly atmospheric diagnostics on 42 pressure levels are available at a 1.25◦ resolution.
2.3 Climate Model Output
The climate model simulations assessed in this study were historical runs from the fifth phase of the Coupled Model Intercomparison Project (CMIP5) collection. These simulations were forced with observed temporal variations of anthropogenic and natural forcings and, for the first
time, time-evolving land cover (Taylor et al., 2012). The historical runs cover much of the industrial period (from the mid-nineteenth century to near present) and are sometimes referred to as “twentieth century” simulations. The GCMs that we analyzed are listed in Table 1 together with their horizontal grid resolutions and the number of vertical levels in the corresponding atmospheric components. Model output is available on a variety of horizontal resolutions with 8 vertical levels. There are 20 models with sufficient daily precipitation output for the evaluation of precipitation extreme statistics and also meteorological variables for use in evaluating physical mechanisms associated with heavy precipitation events. Because of the limited availability of multiple ensemble members, only one twentieth-century ensemble member run was analyzed from each model. Daily model outputs from Met Office Hadley Center (HadCm3, HadGEM2-CC, and HadGEM2-ES) are presented on a 360-day calendar and thus excluded for our analysis.
2.4 Data Processing
The same set of meteorological variables associated with heavy precipitation events are compiled and examined from the MERRA reanalysis and climate model output, including 500-hpa height, 500-hpa vertical motion, 500-hpa vector wind, 850-hpa vector wind, sea level pressure, and precipitable water. We also derive the vertical integral of atmospheric vapor flux vector from the vector wind, specific humidity and surface air pressure. This diagnostic is indicative of the magnitude of moisture transport feeding extreme precipitation events in local areas. The more relevant quantity is vapor convergence. Unfortunately, the estimate of vertically integrated vapor convergence based on reanalysis is problematic as the result of the required total mass balance correction. The vertically integrated atmospheric vapor flux vectors, though limited, provides the main basis for qualitatively identifying the distinct patterns in moisture transport toward the localized extreme hydrometeorological events.
The precipitation and meteorological fields from MERRA reanalysis and each CMIP5 climate model are all regridded to the common 2.5◦x 2◦resolution via linear interpolation if the original climate model resolution is coarser than that of the target resolution or area averaging otherwise. All the atmospheric quantities are converted to a standardized anomaly at each grid cell. The standardized anomaly is defined as the anomaly divided by the standard deviation. Expressing the data in terms of standard deviations allows comparison and aggregation between data with
different variabilities and means. The time period with the greatest overlap among the CPC observations, MERRA and CMIP5 models is 1 January 1979–31 December 2005, so all the following analyses are made for this 27-yr period. Despite inconsistency in the calendar setup, the actual time domain was preserved for the CPC observations, MERRA and individual CMIP5 model. This may lead to minor potential biases in the resulting extreme precipitation statistics for the models on a 365-day calendar (13 models, see Table 1).
We use the CPC observed precipitation to identify the extreme precipitation events at local scale, while the MERRA reanalysis is used to develop the large-scale composites of atmospheric quantities associated with extreme precipitation. The purpose of the presented analogue approach is to characterize the frequency of a class of extreme precipitation events (e.g., the upper 5%
T ab le 1. List of the CMIP5 models used for analysis in this study . The aster isks ne xt to the model name indicate the models on a 365-da y calendar . Model Name Country Resolution Run Institution A CCESS1-0 Australia 192 x 144 L8 1 Commonwealth Scientific and Industrial Research Or g anization, and Bureau of Meteorology A CCESS1-3 Australia 192 x 144 L8 1 Commonwealth Scientific and Industrial Research Or g anization, and Bureau of Meteorology BCC-CSM1-1 ∗ China 128 x 64 L8 1 Beijing Climate Center , China Meteorological Administration BCC-CSM1-1-m ∗ China 320 x 160 L8 1 Beijing Climate Center , China Meteorological Administration BNU-ESM ∗ China 128 x 64 L8 1 Colle ge of Global Change and Earth System Science, Beijing Normal Uni v ersity CanESM2 ∗ Canada 128 x 64 L8 5 Canadian Centre for Climate Modelling and Analysis CCSM4 ∗ USA 288 x 192 L8 1 National Center for Atmospheric Research CMCC-CM Italy 480 x 240 L8 1 Centro Euro-Mediterraneo per sui Cambiamenti Climatici CNRM-CM5 France 256 x 128 L8 1 Centre National de Recherches Meteorologiques GFDL-CM3 ∗ USA 144 x 90 L8 1 Geoph ysical Fluid Dynamics Laboratory GFDL-ESM2G ∗ USA 144 x 90 L8 1 Geoph ysical Fluid Dynamics Laboratory GFDL-ESM2M ∗ USA 144 x 90 L8 1 Geoph ysical Fluid Dynamics Laboratory IPSL-CM5A-LR ∗ France 96 x 96 L8 6 Institut Pierre-Simon Laplace IPSL-CM5A-MR ∗ France 96 x 96 L8 6 Institut Pierre-Simon Laplace IPSL-CM5B-LR ∗ France 96 x 96 L8 6 Institut Pierre-Simon Laplace MIR OC5 ∗ Japan 256 x 128 L8 5 Atmosphere and Ocean Research Institute, National Institute for En vironmental Studies, and Japan Agenc y for Marine-Earth Science and T echnology MIR OC-ESM-CHEM Japan 128 x 64 L8 1 Japan Agenc y for Marine-Earth Science and T echnology , Atmosphere and Ocean Research Institute, and National Institute for En vironmental Studies MIR OC-ESM Japan 128 x 64 L8 3 Japan Agenc y for Marine-Earth Science and T echnology , Atmosphere and Ocean Research Institute, and National Institute for En vironmental Studies MRI-CGCM3 Japan 320 x 160 L8 1 Meteorological Research Institute NorESM1-M ∗ Norw ay 144 x 96 L8 3 Norwe gian Climate Centre
percentile). It should be noted that when applying this method to the CMIP5 historical
simulations, a reproduction of the exact dates when an extreme event occurs is not expected due in large part to the limits of deterministic predictability of atmosphere (Lorenz, 1965). Rather, the intent of this procedure is to examine the collective performances of the CMIP5 models in
detecting the cumulative occurrence of the extreme events over a given spatial and temporal domain of interest—based on derived large-scale physical mechanisms, and how such an
analogue approach compares with observations and traditional model-simulated precipitation. As such, we focus more on the envelop of variability among the models, rather than the individual performance of specific models.
3. OBSERVED PRECIPITATION STATISTICS 3.1 Definition of Extreme Precipitation
Three different methods have commonly been used to identify extreme precipitation events. The first method is based on the actual rainfall amounts. For example, a “heavy” rainfall climatology is constructed as daily precipitation exceeding 50.8 mm (2 in.), and “very heavy” rainfall climatology as exceeding 101.6 mm (4 in.) (Groisman et al., 1999). A second way to define extreme precipitation events is to use specific thresholds such as the 90thand 99th
percentiles of precipitation distribution for heavy and very heavy events, respectively. A third way is to calculate return periods of the event based on the annual maximum 24-hour precipitation series (Kunkel et al., 1999), which is typically used for risk analysis. In a complex orography environment, differences in elevation over short distances can lead to dramatic changes in precipitation distribution due to the interaction of topography and atmospheric flows. As such, defining extreme events based on daily accumulation amount could be problematic in this context. Therefore, in this study, days with “extreme” precipitation at each grid cell are hereafter defined as the daily precipitation amount exceeding the 95th percentile of the precipitation on “wet days” ( 1.0 mm) during a specific period (year or season). The choice of such definition of extreme is somewhat arbitrary and can be adapted in this analysis framework to any other class of extreme precipitation events of interest or concern.
3.2 Regional and Seasonal Considerations
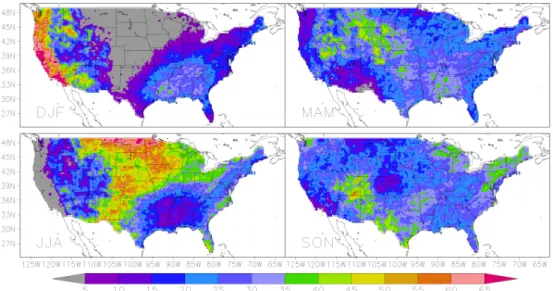
Seasonality strongly affects the dominant features of storm and precipitation climatology in a specific region. The choice of season is based on an objective ranking of the event counts in each season. In this study, a ranking of the event is derived for the entire period of 1979 to 2005. Figure 1 shows the seasonal distribution of 95th percentile events over the contiguous United States. This is obtained by binning all the 95th percentile events for the entire period into each season at each grid cell, which shows the season when extreme precipitation events are most frequent over the specific region. As evident in Figure 1, extreme precipitation events over the West Coast are mostly concentrated in the winter season (December-January-February, DJF) with more than 60% of the events, while less than 5% of extreme events occur in the summer season (June-July-August, JJA). The other two seasons (March-April-May, MAM;
September-October-November, SON) share almost the same number of remaining events, except that autumn season (SON) is more populated than spring over Washington and Oregon. The contrasting characteristics over the Midwestern United State are immediately evident. Extreme events dominates mostly in the summer season with more than 50% of the extremes, while the winter season contains less than 5% of extremes. Also evident is that three seasons (DJF, MAM, and SON) exhibit the equally dominant percentage of extremes over the South-Central United States with the summer season (JJA) showing the minimum significance.
Figure 2 shows daily precipitation amounts for 95thpercentile rankings on wet days of each
season. Regionally there exist large differences in the magnitudes, usually ranging from 5
mm/day to 50 mm/day. Such regional differences also vary among seasons. For instance, over the West Coast, the winter season shows substantially higher values of 50 mm/day above. Such high values can also be observed over the scattered areas in the spring and autumn seasons.
Conversely, the summer season is usually characterized with light precipitation of about 15 mm/day at 95thpercentile. Over the Mountain West (or the Interior West), 95thpercentiles reveal much less variability among the seasons with the magnitude less than 15 mm/day. The 95th percentiles in the Midwestern United State can exceed 35 mm/day in the summer season but tend to be less than 15 mm/day in the winter season. Over the South-Central United States, all three seasons (DJF, MAM, and SON) mark the consistently higher 95th percentiles along the Gulf
Coast that are probably associated with tropical cyclones and other nontropical triggering mechanisms including coastal extratropical cyclones, synoptic-scale fronts topography, and large-scale ascent. The magnitudes over the region are generally in the range of 35–50 mm/day. Nevertheless, the summer season is involved with much lighter precipitation except for Eastern Texas and Oklahoma. These features are somewhat consistent with what is shown in Figure 1.
Figure 1. Seasonal frequency distributions of 95thpercentile events over the contiguous United States. For each season, December-February (DJF), March-May (MAM), June-August (JJA) and
September-November (SON) the percentage of the total number (i.e. for all seasons and all years of data) of extreme daily precipitation events that occurred is shown.
3.3 Study Area
We focus our analysis on two regions where the presented regional and seasonal characterizations (Figures 1 and 2) show promise that precipitation is likely affected by
large-scale coalescence in synoptic-scale patterns. Two such regions show salient features in this context: the South-Central United States (SCUS) and the Pacific Coast. The SCUS domain is defined as a longitude by latitude window (99.875◦–85.125◦W, 30.125◦–37.875◦N for the 0.25◦ x 0.25◦ resolution; 98.75◦–86.25◦W, 31◦–37◦N for the 2.5◦ x 2◦ resolution), including states of the Texas, Oklahoma, Louisiana, Arkansas, Mississippi, Tennessee and Alabama. It is chosen as Higgins et al. (2011) suggests that a large number of localized heavy rain events lead to major flooding across portions of the SCUS. The extreme precipitation events in the SCUS exhibit the characteristics of the “Maya Express” flood events that link tropical moisture from the Caribbean and Gulf of Mexico to midlatitude flooding over North America (Dirmeyer and Kinter III, 2010). Based on observed precipitation statistics, both the winter (DJF) and spring (MAM) seasons are analyzed, but only the results for DJF are shown here as the MAM results are quite similar. The Pacific Coast is a typical region where large-scale flows and complex topography are contributing factors to the occurrence of heavy precipitation events. The causes of extreme West Coast
precipitation events are rather complex because multiple timescales are usually involved. The analysis from the observed precipitation statistics indicates that the winter season (DJF) shows the highest frequency of extremes with the largest 95th percentile ranking. Studies have demonstrated
that precipitation areas of major events along the Pacific Coast are generally narrow and most are associated with atmospheric rivers or the “Pineapple Express” (Higgins et al., 2000; Warner et al., 2012). We therefore focus on the wintertime extreme precipitation events and further divide the Pacific Coast into north coast (WA and OR, hereinafter WAOR) and South Coast (CA, hereinafter
Figure 2. The 95thpercentile rankings of each season over the contiguous United States (mm/day). The black rectangles in the top left panel indicate three study domains examined in this study, the
South-Central United States (SCUS), the northern (WAOR) and southern (PCCA) flank of the Pacific coast. See text for further details.
PCCA). The domain for WAOR is defined as a window (124.875◦–120.125◦W, 42.125◦–47.875◦N for the 0.25◦ x 0.25◦resolution; 123.75◦–121.25◦W, 43◦–47◦N for the 2.5◦ x 2◦ resolution). The domain for PCCA is defined as a window (124.875◦–117.625◦W, 32.125◦–41.875◦N for the 0.25◦ x 0.25◦resolution; 123.75◦–118.75◦W, 33◦–41◦N for the 2.5◦ x 2◦ resolution). Figure 2 depicts the location and names of the regions referenced in this study. The boundary of each domain at the fine and coarse resolution is defined to ensure the same area coverage.
4. IDENTIFICATION OF LOCALIZED EXTREME PRECIPITATION EVENTS
Within each domain of interest, we tag any grid cell where its daily precipitation is larger than its 95th percentile for each day of the chosen season (DJF). We then perform a cluster analysis for
all the tagged grid cells based on their geographical coordinates (latitude and longitude) for any potential day. The day is excluded if no single grid cell within the domain has precipitation exceeding its 95th percentile. The purpose of cluster analysis is to determine if the identified extreme events at the higher-resolution precipitation grid level (0.25◦spatial resolution) on any specific day could constitute a sizeable, contiguous spatial extent to be considered “widespread” at the scale of the domain of interest (i.e. SCUS, WAOR or PCCA). For any given day when precipitation is found to exceed the 95thpercentile for any grid cell within the domain, we scan
the entire domain and determine the total number of grid cells that exceed its 95th percentile and
also are all adjoining one another by at least one extreme neighbor (See Figure 3 for an example). This procedure is performed such that we filter out isolated, rogue extreme events that occur at local scales and are less likely (if at all) to be associated with synoptic-scale state and thus more a random event with respect to any large-scale conditioning. The resulting statistics from this cluster analysis include the number of clusters as well as minimum and maximum cluster size (in number of grid cells) within the domain for all potential dates. Next, it is necessary to determine the extent to which an extreme cluster may form due by random occurrence and quantify an expected value as such. To determine this, we employ a non-parametric bootstrap scheme, and the resulting expected value is used as a threshold above which the cluster size is considered a
widespread extreme event (and thus a likely candidate for synoptic-scale association). The bootstrap scheme involves the random reshuffling of the entire precipitation time series (DJF season from 1979 to 2005) at each grid cell within the domain, followed by the same
aforementioned cluster analysis to examine the resulting distributional behavior of the clustering of extremes. The bootstrap scheme is repeated 100 times to ensure the statistical stability and robustness. We find that for the reshuffled time series, extreme cluster sizes of one and two grid cells account for about 99% of the distribution (not shown). There is a sharp decrease in
percentage from one-grid cell (∼95%) to two-grid cell cluster size (∼4%). The unshuffled time series mostly resembles the exponential distribution with the cluster sizes of one and two grid cells accounting for only 55%. This is the case for all the domains we analyze, including SCUS, PCCA, and WAOR. This indicates that beyond cluster size of two grids, the occurrence of extreme events cannot be actually explained by random process.
To further bridge the scale of observations (0.25◦) and reanalysis/climate models (2.5◦x 2◦) in representing extreme precipitation events, we re-grid the precipitation observations to a 2.5◦ x 2◦
resolution via area averaging and re-examine the potential extreme dates. Within each domain of our interest, any single 2.5◦ x 2◦ grid cell whose daily precipitation is larger than its 95th
percentile for any day of the DJF season is considered as a widespread extreme event (clustering of the grid cells is not required at 2.5◦ x 2◦ resolution). The resulting extreme dates from the precipitation observations at these two resolutions (0.25◦ x 0.25◦and 2.5◦ x 2◦) are compared for their consistency. We found that while the identified extreme dates from observations at 0.25◦ x 0.25◦ in many cases coincide with, they also include many more dates than the precipitation observations at 2.5◦x 2◦indicate. This result simply reflects the fact that extreme events, observed at high resolution, are smeared (to a more benign intensity) at a coarser scale. We find that as the size of the extreme cluster increases, these types of mismatches between scales decrease. In the context of our analogue approach, we view such mismatches of extreme event occurrences between these scales as problematic—as they likely indicate a disconnect between the local and synoptic scales. Nevertheless, high-resolution data is generally expected to better resolve heavy precipitation (Wehner et al., 2010), and so we use the higher-resolution
precipitation data to detect extremes, but must limit the occurrence of mismatches we see against the larger scale. Therefore, the target extreme dates obtained from the 0.25◦ x 0.25◦ observations are further filtered to account for the separation of scale to the coarse climate model data (at 2.5◦x 2◦). The resulting criteria for an extreme cluster size to be considered as a “widespread” candidate extreme event is defined as: (1) the cluster must be larger than 2 grid cells (based on the bootstrap evidence); and (2) a maximum 10% of mismatched extreme dates between the precipitation observations of two resolutions cannot be exceeded. As a result, we find that a cluster size of 20
37 38 39 40 41 42 43 44 45 46 47 48 49 50 51 52 53 54 55 56 57 58 59 60 61 62 63 64 65 66 67 68 69 70 120 121 122 123 124 125 126 127 128 129 130 131 132 133 134 135 136 137 138 139 140 141 142 143 144 145 146 147 148 149 150 151 152 153 154 155 156 157 158 159 160 161 162 163 164 165 166 167 168 169 170 171 172 173 174 175 176 177 178 179 180 181 G ri d N u mb er (Y ) Grid Number (X)
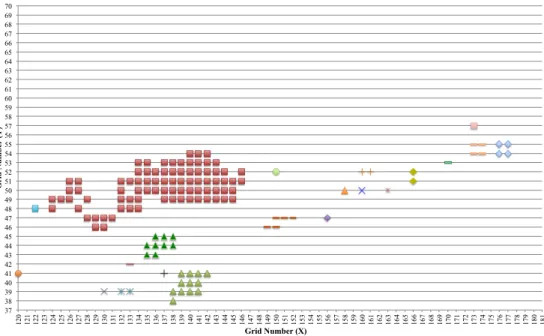
Figure 3. An example of the cluster analysis to identify widespread extreme events. The example shown is for an event detected on Jan 22, 1980 within the domain of the South-Central United States. Each
symbol represents a 0.25◦x 0.25◦grid where daily precipitation on Jan 22, 1980 is larger than its 95th
percentile of DJF season from 1979 to 2005. There are 21 clusters of extreme events with minimum and maximum cluster sizes being 1 and 83 grids (dark red color), respectively.
grid cells for SCUS, 18 grid cells for PCCA, and 12 grid cells for WAOR are sufficient cut-off values to meet these two criteria. Therefore, any day when the maximum cluster size is larger than the cut-off values will be considered as a target date having a widespread extreme event within the domain. The process to identify the dates with “widespread” extreme precipitation events is detailed in Figure 4. Pooling all these occurrences together, the procedure results in 375 extreme events for SCUS, 202 for PCCA, and 292 for WAOR in DJF season of 1979 to 2005 period. 5. SYNOPTIC REGIMES ASSOCIATED WITH EXTREME PRECIPITATION
The distinct large-scale meteorological patterns associated with extreme precipitation events are examined through the composites of various atmospheric variables from the MERRA reanalysis. Each composite is the conditional mean of the relevant atmospheric variable. The conditioning state is the set of dates with widespread localized extreme precipitation for the domain of our interest, which are identified based on the procedure described in section 4. The
Precipitation Statistics
Choice of seasons and study regions
Identify Extreme Events (0.25° x 0.25°) Cluster Analysis (0.25° x 0.25°) Bootstrap Scheme
Determine the cluster size of random extreme occurrence Precipitation Observations (0.25° x 0.25°) Aggregated Precipitation Observations (2.5° x 2°) Identify Extreme Events (2.5° x 2°)
Determine the cluster size for “widespread” extreme events
(0.25° x 0.25°) Dates with “widespread” extreme
precipitation events
Figure 4. A schematic diagram of the process to identify the dates with widespread extreme precipitation
composite fields are represented as standardized departures from the climatology of the DJF season for the 27-yr period. Emphasis is placed on the circulation features and associated
moisture plums with the analyzed fields including 500-hpa Height, 500-hpa vertical motion, total precipitable water, and the vertical integral atmospheric vapor flux vectors. Sea level pressure and vector wind are also examined but not shown. We also attempt to assess whether these composites have any statistical distinction from those of non-extreme dates and therefore promise as
predictive analogues.
5.1 South-Central United States (SCUS)
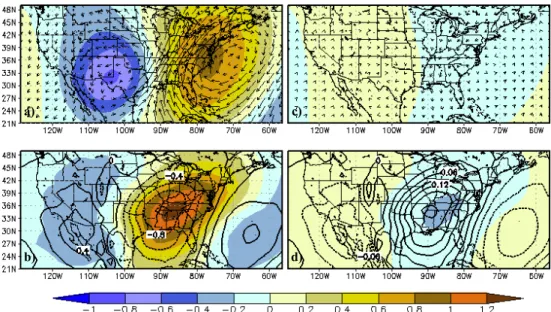
Figure 5 shows the composite fields as standardized anomalies for the extreme (375 cases) and non-extreme (2062 cases) dates for the South-Central United States. The composite of 500-hpa geopotential height (hereinafter Z500) for extremes features a dipole associated with a
pronounced trough over the Central United States and a ridge over the southeastern coast of the United States (Figure 5a). Also evident are strong low-level flow (not shown) and moisture transport (Figure 5a) extending from the central Gulf of Mexico north-northeastward across the Southeast and mid-Atlantic States. The origins of this moisture plume extends farther south and east toward the Caribbean Sea. Moister air (high precipitable water, hereinafter TPW) is clearly evident along the western edge of the geopotential ridge along the Eastern United States (Figure 5b). There also exists strong synoptic-scale upward motion (hereinafter ω500) over the Tennessee and Ohio Valleys (Figure 5b). The corresponding composite fields for non-extreme dates indicate completely opposite large-scale atmospheric circulation features to that of extreme dates, and with the much weaker strength (Figure 5c,d).
Following previous work (Grotjahn, 2011), we further examine how consistent the patterns are among the members of extreme composites by calculating sign-counts at each grid cell (Figure 6). Sign counts record the sign of the standardized anomaly for each member of the composite fields. Positive (negative) values correspond to consistently positive (negative) values among the members. If all members have positive sign at a particular grid cell, the sign-count at that point is +375. Typically, some positive and negative anomalies would cancel out each other, resulting in a smaller sign-count than 375. It is evident that spatial patterns and magnitudes of sign-count maps show strong consistency with those of corresponding composite fields. Sea level pressure
(hereinafter SLP) is analyzed but not shown here. We then identify “hotspots” as a group of grid cells that are coherent among the members of the composites with particular attention to sign consistency, i.e. cluster of points with the largest sign count (either positive or negative, see Figure 6). One of the criteria for the occurrence of extreme events is to examine how consistent the signs of the daily standardized anomalies of meteorological variables from CMIP5 models are with those of the composites over these “hotspot” grid cells.
It is helpful to also examine whether there exists any statistical distinction between extreme and non-extreme cases. We further calculate the spatial anomaly correlation coefficients (SACCs) between the members of the extreme composites as well as the remaining non-extreme members against the extreme composites over the regions depicted in Figure 6. Figure 7 shows the
frequency distribution of the SACCs of relevant composite fields for extreme and non-extreme categories. The vertical integral atmospheric vapor flux vector is not analyzed here. The modes of the distributions for non-extreme dates are immediately evident with more than 55% of the
distributions having negative SACCs for all the analyzed meteorological variables. As expected, the modes of the distributions obtained from the pool of extreme days (which created the
composities) indicate much higher SACCs with 0.9 for Z500, 0.8 for SLP, 0.7 for TPW and 0.4 for ω500, respectively. Although no single range of SACC values strongly dominates the extremes distribution, the majority of extreme populations lies in high correlation values for all the analyzed variables. For example, the SACCs larger than 0.3 account for about 80%, 80%, 65%, and 50% of the extreme distributions for Z500, SLP, TPW, and ω500, respectively. In contrast, there are only 28%, 26%, 13% and 13% of the non-extreme distributions
a)
b)
c)
d)
Figure 5. Composite fields as standardized anomalies over the South-Central United States for (a) 500-hpa geopotential height (shaded, Z500) and the vertical integral atmospheric vapor flux vector of the extreme cases (375); (b) 500-hpa vertical motion (contour, ω500) and total precipitable water (shaded, TPW) of the extreme cases; (c) same as (a) but for the non-extreme dates (2062); (d) same as (b) but for the non-extreme dates.
Figure 6. Sign counts (see text) of anomaly values of all the extreme composite members for Z500, ω500, and TPW from left to right over the SCUS. The clusters of grids indicate the grids of high consistency among the members of the composites (with a large sign counts) and are used for the development of MCC. The dashed rectangles indicate the regions to calculate the SACCs.
correspondingly. Nevertheless, there still exist some ranges of SACC values in which two
categories perform similarly and are therefore barely separable from each other. Here we define a threshold to qualitatively distinguish the extreme from the non-extreme cases. The thresholds are defined as where percentages of the non-extreme distributions is less than 5% and also
percentages of the extreme distributions are more than double those of the non-extreme
distributions. This gives the thresholds of SACC larger than 0.6 for Z500 and SLP, larger than 0.3 for ω500 and TPW, respectively. A limitation with SACCs is that the resulting values will be dependent on the size of regions as depicted in Figure 5. We examine the regions of different sizes to calculate the SACCs, but find that the frequency distributions of extreme and non-extreme as well as the resulting thresholds remain essentially the same for all the variables. Therefore, the general conclusions based on these analyses will not change.
A set of Minimum Contingent of Criterion is then developed for the occurrence of extreme events. This is achieved by examining each member of extreme composites for these criteria, including sign counts over the hotspot grid cells and SACCs. We find that all the members of extreme composites share the following common features: (1) at least 3 out of 4 variables (trough and ridge of Z500, TPW, and ω500) have consistent signs with the corresponding extreme
composites over all their selected “hotspot” grid cells; (2) at least 1 out of 3 variables (Z500, TPW and ω500) has SACCs larger than the defined thresholds; and (3) all the three SACCs have to be positive. SLP provides comparable information to Z500, so it is not included in the
0 5 10 15 20 25 30 35 40 45 50 55 60 < 0 0.1 0.2 0.3 0.4 0.5 0.6 0.7 0.8 0.9 1 F re q u en cy Spatial Correlation (Z500) Extreme (375) Non-Extreme (2062) 0 5 10 15 20 25 30 35 40 45 50 55 60 < 0 0.1 0.2 0.3 0.4 0.5 0.6 0.7 0.8 0.9 1 F re q u en cy Spatial Correlation (!500) 0 5 10 15 20 25 30 35 40 45 50 55 60 65 < 0 0.1 0.2 0.3 0.4 0.5 0.6 0.7 0.8 0.9 1 F re q u en cy Spatial Correlation (TPW) 0 5 10 15 20 25 30 35 40 45 50 55 60 < 0 0.1 0.2 0.3 0.4 0.5 0.6 0.7 0.8 0.9 1 F re q u en cy Spatial Correlation (SLP) 10 15 20 25 30 35 40 45 50 55 60 F re q u en cy 10 15 20 25 30 35 40 45 50 55 60 F re q u en cy
Figure 7. Frequency distributions of SACCs between the members of the composites as well as the remaining non-extreme members against the composite maps over the SCUS for Z500, SLP, ω500, and TPW. The marked thresholds are used for the development of MCC.
development of MCC. The determination of the cut-off sign-count values (or the number of hotspot grid cells) for each variable of the MCC takes into account the sign count values of neighboring grid cells, and is further calibrated in terms of reproducing the approximate number of observed extreme events for each domain of interest. We examine the use of a slightly different number of hotspot grid cells for each variable of the MCC, but find the results dont change much. Choice of different individual variable or combinations of variables to form the MCC is also feasible. The performances of such choices in detecting the occurrence of extreme events are evaluated in Section 6.
5.2 Pacific Coast (PCCA and WAOR)
Composite-anomaly maps of various meteorological variables associated with the extreme events (202 cases) in California illustrate the spatial patterns of atmospheric circulation that normally prevail during extremes (Figure 8a, b). Z500 reveals the presence of distinctive
negative height anomaly centered over the eastern North Pacific Ocean and the northwestern coast of the United States, and weakened positive anomalies centered over the central Pacific. There exists an anomalous southwesterly flow of moist air from the eastern North Pacific Ocean into the central-western coast of the United States. Also evident are moister air and strong synoptic-scale upward motion centered over the northern California and Nevada, but extending toward the interior Western United States. As expected, the composite-anomaly maps of non-extreme dates (2235 cases) show completely opposite large-scale atmospheric circulation features with the much weaker strength (Figure 8c, d).
There is more resemblance between composite-anomaly maps associated with the extreme events (292 cases) and non-extreme dates (2145 cases) in WAOR and those in PCCA, except that centers of anomalies shift slightly northward (Figure 9). The negative anomaly of Z500 is centered over the British Columbia Coast and extends to the northwest over Alaska. The positive anomaly is centered near the Baja California Peninsula and extends to the northeast over the interior Western United States. Strong moisture transport (Figure 9a) extends from the eastern North Pacific Ocean northeastward across the Northwestern United States. There exist also moister air and strong synoptic-scale upward motion directly over the study domain.
Sign-counts and frequency distribution of SACCs for PCCA and WAOR are shown in Figure 10 and Figure 11, respectively. Also shown in Figure 10 are the hotspot grids for each region that indicate the high consistency among the members of the extreme composites. Similar criteria are employed to define the thresholds that qualitatively distinguish the SACCs between extreme and non-extreme distributions (Figure 11). For PCCA, this gives SACC values of 0.6 for Z500 and SLP as well as 0.4 for ω500 and TPW as the thresholds. WAOR has the thresholds of larger than 0.5 for Z500 and SLP, larger than 0.3 for ω500, and larger than 0.4 for TPW.
6. APPLICATION OF ANALOGUE METHOD TO CMIP5 HISTORICAL MODEL SIM-ULATIONS
The MCC established for each domain is first evaluated with the relevant daily meteorological fields from MERRA reanalysis for the occurrence of extreme events (Table 2). We evaluate the
performances of analogue method based on the established MCC as a success rate of detection and a false positive rate. The “success” is measured as the fraction (or percentage) of observed extreme precipitation dates that are also detected by the analogue method. The “false positive” is measured as the fraction (or percentage) of mistakenly identified extreme precipitation dates by the analogue method. The success rate of the established MCC can reach about 53–61% across three study regions when matching the exact dates of the extreme precipitation events. The results improve to 72–84% and 78–87% if the window for matching dates is enlarged to 1 day and 2 days, respectively. Accordingly, the false positive rate is reduced from 22–32% to 16–24%. When compared with alternative choices of any one or two variables (trough and ridge of Z500, TPW and ω500) as a contingent criterion, the MCC is shown to achieve the best combination of “success” and false positive rate. Although the best alternative scheme “2-var” produces the highest “success” rate, it also gives a higher number of false positive than the MCC. In addition,
a)
b)
c)
d)
Figure 8. Composite fields as standardized anomalies over the Southern Pacific Coast (California) domain (PCCA) for (a) 500-hpa geopotential height (shaded, Z500) and the vertical integral atmospheric vapor flux vector of the extreme cases (202); (b) 500-hpa vertical motion (contour, ω500) and total
precipitable water (shaded, TPW) of the extreme cases; (c) same as (a) but for the non-extreme dates (2235); (d) same as (b) but for the non-extreme dates.
such highest success rate is mostly sacrificed by the total number of “detected” extreme occurrence, as indicated by the large biases. This is evidently expected: as the number of the “tagged” occurrence increases, the chance of success increases. These results indicate that the climate analogue method based on the constructed MCC is rather robust in detecting the occurrence of widespread extreme precipitation events with satisfactory performance across various regions examined in this study.
Next we examine the capabilities of current state-of-the-art climate models to simulate the realistic atmospheric dynamics and thermodynamics associated with extreme precipitation events and further to detect these events based on those resolved large-scale atmospheric conditions. The benchmark evaluation against the CMIP5 models is made by comparing the daily
model-simulated meteorological conditions with the extreme composites for their similarity based on the established MCC. We address the question: How often will such large-scale extreme composite patterns appear in the model simulations? Any day when a set of MCC is met would
a)
b)
c)
d)
Figure 9. Composite fields as standardized anomalies over the Northern Pacific Coast (Washington and Oregon) domain (WAOR) for (a) 500-hpa geopotential height (shaded, Z500) and the vertical integral atmospheric vapor flux vector of the extreme cases (292); (b) 500-hpa vertical motion (contour, ω500) and total precipitable water (shaded, TPW) of the extreme cases; (c) same as (a) but for the
then be considered as having extreme precipitation events occurring over the domain. The schematic diagram of the analogue method is presented in Figure 12. We compare the results of such an analogue approach with those from the high-resolution precipitation observations and the CMIP5 model-simulated precipitation. An analysis of the aggregated precipitation observations at 2.5◦ x 2◦ and MERRA reanalysis precipitation at 2.5◦x 2◦are also presented in order to examine whether the discrepancy in the results could be caused by the difference in resolution. This also ensures that the CMIP5 model-simulated precipitation results are compared with observations derived in a consistent manner. An extreme event from any type of precipitation data at 2.5◦ x 2◦ (CMIP5 models, MERRA reanalysis and observations) is defined as any single grid cell within the domain of interest whose daily precipitation is larger than its 95th percentile for any day of the
DJF season.
The total number of extreme precipitation events estimated from two schemes is compared with the high-resolution and aggregated coarse-resolution precipitation observations for the DJF of 1979–2005 over the SCUS domain (Figure 13). The results from precipitation observations at two resolutions are rather comparable. The analogue results that are based on the simulated large-scale atmospheric conditions of 20 CMIP5 models produce more consistent (and less
!
! Figure 10. Sign counts of anomaly values of all the extreme composite members for Z500, ω500, and
TPW from left to right over the PCCA (top three panels) and the WAOR (bottom three panels). The clusters of grids indicate the grids of high consistency among the members of the composites (with a large sign counts) and are used for the development of MCC. The dashed rectangles indicate the regions to calculate the SACCs.
uncertain) number of extreme days with what is observed at both resolutions. Although two schemes give rather similar interquartile range (IQR), the analogue scheme clearly reduces the
! ! ! 0 5 10 15 20 25 30 35 40 45 50 55 60 0 0.1 0.2 0.3 0.4 0.5 0.6 0.7 0.8 0.9 1 F re q u en cy Spatial Correlation (Z500) Extreme (202) Non-Extreme (2235) 0 5 10 15 20 25 30 35 40 45 50 55 60 0 0.1 0.2 0.3 0.4 0.5 0.6 0.7 0.8 0.9 1 F re q u en cy Spatial Correlation (!500) 0 5 10 15 20 25 30 35 40 45 50 55 60 65 0 0.1 0.2 0.3 0.4 0.5 0.6 0.7 0.8 0.9 1 F re q u en cy Spatial Correlation (TPW) 0 5 10 15 20 25 30 35 40 45 50 55 60 0 0.1 0.2 0.3 0.4 0.5 0.6 0.7 0.8 0.9 1 F re q u en cy Spatial Correlation (SLP) 0 5 10 15 20 25 30 35 40 45 50 55 60 0 0.1 0.2 0.3 0.4 0.5 0.6 0.7 0.8 0.9 1 F re q u en cy Spatial Correlation (Z500) Extreme (292) Non-Extreme (2145) 0 5 10 15 20 25 30 35 40 45 50 55 60 0 0.1 0.2 0.3 0.4 0.5 0.6 0.7 0.8 0.9 1 F re q u en cy Spatial Correlation (!500) 0 5 10 15 20 25 30 35 40 45 50 55 60 65 0 0.1 0.2 0.3 0.4 0.5 0.6 0.7 0.8 0.9 1 F re q u en cy Spatial Correlation (TPW) 0 5 10 15 20 25 30 35 40 45 50 55 60 0 0.1 0.2 0.3 0.4 0.5 0.6 0.7 0.8 0.9 1 F re q u en cy Spatial Correlation (SLP)
Figure 11. Frequency distributions of SACCs between the members of the composites as well as the remaining non-extreme members against the composite maps over the PCCA (the top four panels) and the WAOR (the bottom four panels) for Z500, SLP, ω500, and TPW. The marked thresholds are used for the development of MCC.
Table 2. Evaluation with MERRA Reanalysis of skills of various climate analogue schemes in capturing observed extreme precipitation dates over domains of interest. The skills are expressed as “success rate” and false positive (see text for further details). Schemes of Z500, ω500 and TPW represent the choice of single variable (trough or ridge of Z500, ω500, and TPW) as a contingent criterion for the occurrence of extreme precipitation events, respectively. Each variable has consistent sign with the corresponding extreme composite over their selected “hotspot” grid cells and also has its SACC larger than the defined thresholds. “2-Var” scheme is similar to the MCC defined in Section 5a, except that at least 2 (instead of 3 in MCC) out of 4 variables (trough and ridge of Z500, TPW, and ω500) have consistent signs with the corresponding extreme composites over their selected “hotspot” grid cells. “Obs” and “MERRA” indicate the number of extreme occurrence captured with high-resolution precipitation observations and the analogue method, respectively. The parenthesis shows the bias toward the observations.
Region Scheme Obs MERRA (Bias) Success Rate (%) False Positive (%)
Exact 1 day 2 days Exact 1 day 2 days
MCC 376 (1) 58.4 83.5 86.7 41.8 23.9 17.8 Z500 446 (71) 52.8 68.8 72.5 55.6 26.9 18.8 SCUS ω500 375 225(-150) 28.8 51.7 58.7 52.0 40.0 34.2 TPW 329 (-46) 49.6 73.1 78.1 43.5 27.1 21.0 2-Var 447 (72) 64.5 86.9 88.8 45.9 27.5 21.7 MCC 201 (-1) 53.0 72.3 78.2 46.8 32.3 24.4 Z500 335 (133) 51.5 63.9 70.8 69.0 47.8 36.7 PCCA ω500 202 157 (-45) 32.2 54 65.4 58.6 47.1 42.0 TPW 244 (42) 56.4 73.3 78.2 53.3 38.1 32.4 2-Var 307 (105) 66.8 82.7 88.6 56.0 38.4 29.3 MCC 293 (1) 61.0 79.5 83.2 39.2 21.5 16.0 Z500 340 (48) 53.4 65.8 70.9 54.1 24.7 15.3 WAOR ω500 292 190 (-102) 43.2 68.2 74.7 33.7 16.3 13.7 TPW 244 (-48) 41.8 66.4 74.7 50.0 35.7 27.0 2-Var 364 (72) 66.8 84.9 87.3 46.4 26.1 19.0
total spread among climate models with the range of 158 extreme days, in contrast to 180 extreme days from the model-based precipitation. The central tendency (i.e. median) obtained from the precipitation-based analyses with the CMIP5 models greatly underestimates the total number of events with the upper quartile even biased about 50 days lower than the observations at 2.5◦ x 2◦. Instead, both observation results fall well within the IQR of the analogue results. MERRA precipitation seems to do a fairly good job in characterizing the number of extreme occurrence as well. Generally speaking, the analogue scheme improves upon the assessments of extreme events based on the model precipitation in terms of both accuracy and precision.
Figure 14 illustrates the comparisons of the interannual range of extreme days from CMIP5 analogues and CMIP5 model-simulated precipitation for the SCUS region. Also shown are their counterparts from MERRA reanalysis as well as the results obtained from the precipitation observations at two resolutions. For the DJF season, the number of extreme days for each year is computed based on the number in December of current year and the numbers in January and
February of the subsequent year. The statistics in Figure 14 are thus based on 26 years of the data (year 2005 is not included). The interannual range of extreme days from the precipitation
observations at two resolutions is quite comparable to each other. We can also see that both analogue and precipitation results from MERRA reanalysis seem able to reproduce the statistics of the observations rather well. It is evident that the results from the CMIP5 analogues are more consistent with the observations than those obtained from model-simulated precipitation, at least in terms of characterizing the IQR. The majority of the models tend to overestimate the maximum but underestimate the minimum annual total of extreme days with analogue scheme. However, the precipitation-based analyses demonstrate that the majority of the models tend to
underestimate both the maximum and minimum annual total of extreme days. To quantitatively evaluate the performances of two schemes, we compute the root-mean-square-error (RMSE) between descriptive statistics (minimum, lower quartile, median, upper quartile and maximum) for interannual range of extreme days from two schemes and those from observations across the 20 CMIP5 models (Table 3). The analogue results yield smaller RMSE than model
precipitation-based analyses for all the descriptive statistics except for the maximum, consistent with what is shown in Fig. 14. Further examination reveals that the high RMSE for the maximum
construct atmospheric
composites Reanalysis MERRA
Assess composites as predictive analogue
Construct minimum contingent of criteria
(MCC)
Evaluate analogue with daily meteorological fields from Reanalysis
Apply analogues to model simulations
or projections Dates with “widespread”
extreme precipitation events CMIP5 Detected analogue -based CMIP5 extreme dates Sign Count SACC Z500 !500 TPW
• At least 3 out of 4 variables (trough of ridge of Z500, TPW, !500) have consistent signs with composites over hotspot grids.
• At least 1 variable with SACCs > specified threshold • All SACCs > 0.0 MERRA • Success Rate • False Positive
is mostly attributed to the significant overestimation by one model (CanESM2). Elimination of the CanESM2 model results in notable reduction of the RMSE for the maximum to 4.32.
Figure 15 shows comparisons of total number of extreme days across all the climate models from two schemes and observations for the DJF of 1979–2005 over the PCCA domain. Again, the results from precipitation observations at two resolutions match very well. The analogue results produce less overall spread among climate models, especially for the interquartile range. They are also more consistent with the observations. The majority of model precipitation-based analyses, however, overestimate the number of extreme days with the observations outside the
corresponding model IQR. Different from the SCUS region, the MERRA precipitation is found to greatly overestimate the number of extreme occurrence and coincide well with the median value from the CMIP5 precipitation-based analyses. In terms of interannual range of extreme days (Figure 16), the results from the precipitation observations at two resolutions agree also reasonably well as expected. The analogue result of MERRA reanalysis seems to capture the observed statistics rather well with slightly smaller IQR, while the MERRA precipitation overestimates all the statistics. The majority of the models in both schemes tend to overestimate the maximum annual total of extreme days (Table 4). Overall, the analogue CMIP5 results are more consistent with the observations. This is also confirmed in Table 3 the analogue CMIP5 results collectively improve upon the precipitation-based analyses with the smaller RMSE for all
!""# !!"# !$"# !%"# !&"# '""# '!"# '$"# '%"# '&"# $""# $!"# $$"# ()*+,-,./.,01# 21/3045*# !"#$% &'()'*+, &%#%'-./0' 67882 9:;<!=>?!
Figure 13. Comparisons of the total number of extreme days for DJF of 1979 to 2005 over the SCUS estimated from two schemes: CMIP5 model-simulated precipitation and CMIP5 analogues. The whisker plot shows the minimum, the lower and upper quartile, and the maximum across all the 20 CMIP5 models. The black dot indicates the median. The dashed and dotted lines indicate the total
number of extreme days identified from observations at 0.25◦x 0.25◦with cluster analysis and 2.5◦x
2◦, respectively. The dash-dot line indicates the total number of extreme days identified from MERRA
the descriptive statistics. ! ! ! !" #" $" %" &" '!" '#" '$" '%" '&" #!" ##" #$" #%" #&" (!" (#" ($" (%" (&" $!" )*+" )*+,#-./#"0122 3" 3441++'5!"3441++'5("6775789'5'"6775789'5'59"*:;51+0"4<=1+0#" 44+0$" 4044540"4:20540.">?@A540("
>?@A51+0#>">?@A51+0#0"BC+A540.35A2"BC+A540.3502"BC+A540.*5A2" 0B2)4." 0B2)451+050B2)451+0"02B54>40(":DE1+0'50" !"#$% &'()'*+, &%#%'-./0' !" #" $" %" &" '!" '#" '$" '%" '&" #!" ##" #$" #%" #&" (!" (#" ($" (%" (&" $!" )*+" )*+,#-./#"0122 3" 3441++'5!"3441++'5("6775789'5'"6775789'5'59"*:;51+0"4<=1+0#" 44+0$" 4044540"4:20540.">?@A540("
>?@A51+0#>">?@A51+0#0"BC+A540.35A2"BC+A540.3502"BC+A540.*5A2" 0B2)4." 0B2)451+050B2)451+0"02B54>40(":DE1+0'50" !"#$% &'()'*+, &%#%'-./0'
<F
6F
Figure 14. Comparison of annual statistics of year-to-year occurrence of extreme events over the SCUS estimated from (a) CMIP5 analogues and (b) CMIP5 model-simulated precipitation. The whisker plots display the minimum, lower and upper quartiles, and maximum annual totals of extreme days for the 26-year (1979–2004) period. The “OBS” and “OBS 2.5x2” results are obtained from precipitation
observations at 0.25◦x 0.25◦with cluster analyses and 2.5◦x 2◦, respectively. Shaded gray area
represents the Inter-Quartile Range (IRQ) based on “OBS”. The MERRA results in (a) and (b) are
Table 3. Root-Mean-Square-Error (RMSE) (units in number of extreme days) between the analogue approach as well as CMIP5-model simulated precipitation and observed precipitation for various statistics of interannual range of extreme days over the domains of interest.
Statistics SCUS PCCA WAOR
Analogue Precipitation Analogue Precipitation Analogue Precipitation
Min 1.67 2.36 0.84 1.28 1.38 1.05
Q1 2.05 4.33 2.06 3.09 1.61 2.64
Median 2.07 4.81 1.22 1.92 1.85 2.90
Q3 1.65 4.87 1.50 1.58 2.39 4.16
Max 5.67 4.70 4.83 5.87 5.12 6.16
Among the domains we examine, the WAOR is the only region where the total number of extreme days from the analogue results presents much larger overall spread across the models, almost double that from the precipitation-based analyses (Figure 17). Further examination suggests that such a large spread is mostly attributed to the significant underestimate by one
!"#$ !%#$ !&#$ '##$ '!#$ ''#$ '(#$ ')#$ '*#$ '+#$ '"#$ '%#$ '&#$ (##$ (!#$ ,-./010232045$ 6537489.$ !"#$% &'()'*+, &%#%'-./0' :;<<6 =>?@'A*B'
Figure 15. Comparisons of the total number of extreme days for DJF of 1979 to 2005 over the PCCA estimated from two schemes: CMIP5 model-simulated precipitation and CMIP5 analogues. The whisker plot shows the minimum, the lower and upper quartile, and the maximum across all the 20 CMIP5 models. The black dot indicates the median. The dashed and dotted lines indicate the total
number of extreme days identified from observations at 0.25◦x 0.25◦with cluster analysis and 2.5◦x
2◦, respectively. The dash-dot line indicates the total number of extreme days identified from MERRA
!! ! !" #" $" %" &" '!" '#" '$" '%" '&" #!" ##" #$" #%" #&" ()*" ()*+#,-.#"/011 2" 2330**'4!"2330**'45"6774789'4'"6774789'4'49"):;40*/"3<=0*/#" 33*/$" 3/3343/"3:1/43/-">?@A43/5"
>?@A40*/#>">?@A40*/#/"BC*A43/-24A1"BC*A43/-24/1"BC*A43/-)4A1" /B1(3-" /B1(340*/4/B1(340*/"/1B43>3/5":DE0*/'4/" !"#$% &'()'*+, &%#%'-./0' !" #" $" %" &" '!" '#" '$" '%" '&" #!" ##" #$" #%" #&" ()*" ()*+#,-.#"/011 2" 2330**'4!"2330**'45"6774789'4'"6774789'4'49"):;40*/"3<=0*/#" 33*/$" 3/3343/"3:1/43/-">?@A43/5"
>?@A40*/#>">?@A40*/#/"BC*A43/-24A1"BC*A43/-24/1"BC*A43/-)4A1" /B1(3-" /B1(340*/4/B1(340*/"/1B43>3/5":DE0*/'4/" !"#$% &'()'*+, &%#%'-./0'
<F
6F
Figure 16. Comparison of annual statistics of year-to-year occurrence of extreme events over the PCCA estimated from (a) CMIP5 analogues and (b) CMIP5 model-simulated precipitation. The whisker plots display the minimum, lower and upper quartiles, and maximum annual totals of extreme days for the 26-year (1979–2004) period. The “OBS” and “OBS 2.5x2” results are obtained from precipitation
observations at 0.25◦x 0.25◦with cluster analyses and 2.5◦x 2◦, respectively. Shaded gray area
represents the Inter-Quartile Range (IRQ) based on “OBS”. The MERRA results in (a) and (b) are
Table 4. Summary of overestimated, underestimated, and matched model counts for minimum and maximum interannual number of extreme days between the analogue approach as well as CMIP5-model simulated precipitation and observations over the three study domains.
Statistics SCUS PCCA WAOR
Analogue Precipitation Analogue Precipitation Analogue Precipitation
Min (over) 3 2 5 9 11 6 Min (under) 13 16 6 2 1 7 Min (match) 4 2 9 9 8 7 Max (over) 13 2 17 18 9 0 Max (under) 5 17 3 1 10 20 Max (match) 2 1 0 1 1 0
model (IPSL-CM5B-LR) that produces only about half the observed number of extreme days. Nevertheless, the median analogue value amongst the CMIP5 models is much more consistent with the observations—the observations at two resolutions fall within the IQR of the analogue results. In contrast, the precipitation-based analysis significantly underestimates the total number of extreme days with its maximum among models even biased of about 20 days lower than the observations at 2.5◦x 2◦. Substantial underestimation can be also seen in the MERRA
precipitation result which coincides well with the median value from the CMIP5
precipitation-based analyses. In terms of the interannual range of extreme days, the analogue result using the MERRA reanalysis satisfactorily mimics the observed statistics (Figure 18), as in the cases of SCUS and PCCA (Figure 14 and Figure 16, respectively). CMIP5 analogue results are more consistent with the observations as well. We can see that IPSL-CM5B-LR model notably underestimates the maximum as well as the upper and lower quartiles of interannual range of extreme days—the main reason for a large spread of the total number of extreme days across the models in Figure 14. Compared with the observations, both the MERRA and CMIP5 precipitation analyses reveal notable underestimation. In fact, precipitation-based analyses from all the models tend to underestimate the maximum interannual number of extreme days.
However, there is no apparent predominance of underestimation and overestimation in the
analogue results (Table 4). The better performance of the analogue approach is further verified in Table 3—the analogue results yield smaller RMSE across all the CMIP5 models for all the descriptive statistics, except for the minimum annual total of extreme days.
There exist some common features for all three domains we examine here. Analogue results of MERRA reanalysis consistently depict the observed interannual range of extreme days, while the MERRA precipitation in general does not reproduce the observed statistics of extreme occurrence well (except in the SCUS). Results of CMIP5 models demonstrate that the analogue approach outperforms model precipitation-based analyses with less spread but more consistent total and interannual range of extreme days compared to what is observed, as indicated also by the smaller RMSE for all the descriptive statistics. However, both schemes exhibit difficulty in reproducing the maximum annual total of extreme days (largest RMSE) in comparison with other statistics.