HAL Id: hal-02562287
https://hal-univ-rennes1.archives-ouvertes.fr/hal-02562287
Submitted on 19 May 2020
HAL is a multi-disciplinary open access
archive for the deposit and dissemination of sci-entific research documents, whether they are pub-lished or not. The documents may come from teaching and research institutions in France or abroad, or from public or private research centers.
L’archive ouverte pluridisciplinaire HAL, est destinée au dépôt et à la diffusion de documents scientifiques de niveau recherche, publiés ou non, émanant des établissements d’enseignement et de recherche français ou étrangers, des laboratoires publics ou privés.
High-temperature hypersonic Laval nozzle for non-LTE
cavity ringdown spectroscopy
Eszter Dudas, Nicolas Suas-David, Shuvayan Brahmachary, Vinayak Kulkarni,
Abdessamad Benidar, Samir Kassi, Christine Charles, Robert Georges
To cite this version:
Eszter Dudas, Nicolas Suas-David, Shuvayan Brahmachary, Vinayak Kulkarni, Abdessamad Benidar, et al.. High-temperature hypersonic Laval nozzle for non-LTE cavity ringdown spectroscopy. Journal of Chemical Physics, American Institute of Physics, 2020, 152 (13), pp.134201. �10.1063/5.0003886�. �hal-02562287�
1
High-temperature hypersonic Laval nozzle for non-LTE
Cavity Ringdown Spectroscopy
Eszter Dudás,
Univ Rennes, CNRS, IPR (Institut de Physique de Rennes) - UMR 6251, F-35000 Rennes, France
Nicolas Suas-Davida,
Univ Rennes, CNRS, IPR (Institut de Physique de Rennes) - UMR 6251, F-35000 Rennes, France
Shuvayan Brahmachary,
Department of Mechanical Engineering, Indian Institute of Technology Guwahati, Guwahati, India
Vinayak Kulkarni,
Department of Mechanical Engineering, Indian Institute of Technology Guwahati, Guwahati, India
Abdessamad Benidar,
Univ Rennes, CNRS, IPR (Institut de Physique de Rennes) - UMR 6251, F-35000 Rennes, France
Samir Kassi,
Université Grenoble Alpes, LIPhy, F-38000 Grenoble, France and CNRS, LIPhy, F-38000 Grenoble, France
Christine Charles,
Space Plasma, Power and Propulsion Laboratory (SP3), Research School of Physics, The Australian National University, Canberra, ACT 2601, Australia
Robert Georgesb
Univ Rennes, CNRS, IPR (Institut de Physique de Rennes) - UMR 6251, F-35000 Rennes, France
Abstract
A small dimension Laval nozzle connected to a compact high enthalpy source equipped with cavity ringdown spectroscopy (CRDS) is used to produce vibrationally hot and rotationally cold high-resolution infrared spectra of polyatomic molecules in the 1.67 m region. The Laval nozzle was machined in isostatic graphite which is able to withstand high stagnation temperatures. It is characterized by a throat diameter of 2 mm and an exit diameter of 24 mm. It was designed to operate with argon heated up to 2000 K and to produce a quasi-unidirectional flow to reduce the Doppler Effect responsible for line broadening. The hypersonic flow was characterized using computational fluid dynamics simulations, Pitot
This is the aut
hor’s peer reviewed, accepted manuscript. Howe
ver, the online
version of record will be different
from this
version
once it has bee
n copyedited an d typeset. PLEASE CIT E THIS ARTI C LE AS DOI: 10.1063/5.0003886
2
measurements and CRDS. A Mach number evolving from 10 at the nozzle exit up to 18.3 before the occurrence of a first oblique shock wave was measured. Two different gases, carbon monoxide (CO) and methane (CH4), were used as test molecules. Vibrational (Tvib)
and rotational (Trot) temperatures were extracted from the recorded infrared spectrum
leading to Tvib = 1346 52 K and Trot = 12 1 K for CO. A rotational temperature of 30 3 K
was measured for CH4, while two vibrational temperatures were necessary to reproduce the
observed intensities. The population distribution between vibrational polyads was correctly described with TvibI = 894 ± 47 K, while the population distribution within a given polyad (namely the dyad or the pentad) was modelled correctly by TvibII = 54 ± 4 K, testifying to a more rapid vibrational relaxation between the vibrational energy levels constituting a polyad.
a)now at Leiden Observatory, Laboratory for Astrophysics, NL 2333 CA Leiden b)Electronic mail: [email protected]
This is the aut
hor’s peer reviewed, accepted manuscript. Howe
ver, the online
version of record will be different
from this
version
once it has bee
n copyedited an d typeset. PLEASE CIT E THIS ARTI C LE AS DOI: 10.1063/5.0003886
3
I. INTRODUCTION
High-temperature infrared spectroscopy provides laboratory data which is essential for determining the properties of the atmospheres of Hot Jupiter type exoplanets.1–3 Up to
now, two decades after the discovery of the first exoplanet,4 carbon monoxide, carbon
dioxide, methane and water have been directly observed in Hot Jupiter atmospheres by infrared astronomy,5 which implies the possibility of a rich chemistry as well as an active
photochemistry. Accurate laboratory infrared (IR) spectroscopic data in the temperature range of 500 – 3000 K for small hydrocarbons such as acetylene, methane, ethylene and ethane, is therefore believed to be pivotal to interpret the observed spectra.1 However, the
spectral confusion, characterizing high-temperature local thermal equilibrium (LTE) spectra of polyatomic molecules produced either by absorption6 or emission7 spectroscopic
techniques, greatly complicates spectral analysis and hampers the development of high-temperature molecular databases.
We have developed a novel approach to produce non-LTE IR spectra relying on a hypersonic expansion probed by cavity ring-down spectroscopy (CRDS). The Spectroscopy of Molecules Accelerated in Uniform Gas flow (SMAUG) apparatus has been developed to decouple the internal degrees of freedom of polyatomic molecules in order to record vibrationally hot but rotationally and translationally cold IR spectra, resulting in both a simplified rotational structure and a reduced Doppler-broadening of the absorption lines (see Fig. 1).
This is the aut
hor’s peer reviewed, accepted manuscript. Howe
ver, the online
version of record will be different
from this
version
once it has bee
n copyedited an d typeset. PLEASE CIT E THIS ARTI C LE AS DOI: 10.1063/5.0003886
4
FIG. 1. Spectra of CO simulated at different conditions highlighting the advantage of non-LTE
spectroscopy. Panel a: spectrum simulated at 15 K showing a simplified rotational structure but a lack of information regarding the molecular vibration (total absence of hot bands). Panel b: spectrum simulated at 2000 K showing overlapping vibrational cold (30) and hot (41; 52; 63) bands each characterized by a large number of rotational transitions which complicate the spectrum. Panel c: spectrum simulated in non-LTE conditions: Trot = 15
K and Tvib = 2000 K resulting in a simplification of the rotational structure and an easier
analysis of the different observed bands.
Non-LTE processes characterizing rapidly expanding gases have been widely used for spectroscopic purposes. The gasdynamic lasers developed in the 1970’s are based on the non-equilibrium distribution of a population of polyatomic molecules such as CO or CO2.8 An
expansion in a supersonic nozzle rapidly cools down a gas mixture (e.g. CO2-N2-H2O or CO2
-N2-He) but, as the vibrational relaxation is comparatively slow, this cooling leads to a
population inversion resulting in an amplification of the radiative intensity of light emitted by the molecules. From a spectroscopic point of view, such a lasing action triggered by the excitation of water molecules in a supersonic plasma contained in an optical supercavity was used to record rotationally cold spectra of vibrationally excited H2O9 and D2O10 in the mid
This is the aut
hor’s peer reviewed, accepted manuscript. Howe
ver, the online
version of record will be different
from this
version
once it has bee
n copyedited an d typeset. PLEASE CIT E THIS ARTI C LE AS DOI: 10.1063/5.0003886
5
infrared and far infrared regions, respectively. The rotational and vibrational temperatures associated with the pulsed slit supersonic discharge source were estimated to be 120 K and 2500 K respectively. A pulsed supersonic planar plasma jet was also used to produce high-resolution infrared cw-CRDS spectra of vibrationally excited HC4H11 with a rotational
temperature of 17 K and vibrational excitation temperatures of 125 K and 570 K, depending on the considered bending vibrations. Vibrationally excited state spectroscopy of NO in a pinhole supersonic plasma was also reported by Bazalgette Courrèges-Lacoste et al.12 with
Trot < 50 K and Tvib = 6700 700 K.
Excitation sources besides plasma ones have also been used to produce non-LTE conditions. Intermolecular vibrational energy transfer from ethylene to acetylene was investigated in the 3 μm region by probing a supersonic jet with an IR-IR double resonance technique producing rotationally-cold hot-bands.13 Thermally heated nozzles, either
axi-symmetric14,15 or planar16, were used to supply the preheat gases before their adiabatic
cooling in supersonic jet expansions. In close connection with our investigations on the infrared spectroscopy of simple hydrocarbons, it is worth mentioning the early study on non-LTE methane by Bronnikov et al.17 They used a thermally-heated pulsed slit nozzle to
produce non-LTE diode laser spectra of vibrationally excited methane in the 8 μm region. This study highlighted a virtual absence of vibrational relaxation between the different polyads, while a strong vibrational relaxation within the same polyad leads to a redistribution of the populations of the vibrational levels involved.
The tetradecad region of supersonically-cooled preheated methane was previously investigated at the Institute of Physics of Rennes (IPR) in a free jet expansion by means of CRDS.15 A strong decoupling of the internal degrees of freedom (T
rot = 13 K and Tvib = 750 K)
was responsible for the emergence of multiple rotationally-cold hot bands in the recorded
This is the aut
hor’s peer reviewed, accepted manuscript. Howe
ver, the online
version of record will be different
from this
version
once it has bee
n copyedited an d typeset. PLEASE CIT E THIS ARTI C LE AS DOI: 10.1063/5.0003886
6
spectra, which allowed the identification of new transitions connecting highly excited vibrational energy levels. Such a strong non-LTE state is based on fast rotational-translational (R-T), and quite inefficient vibrational-translational (V-T), collisional energy transfers taking place during the adiabatic hypersonic expansion of a thermally preheated gas.18 Spectra
recorded in such conditions exhibit a simplified rotational structure that allows the performance of a line-by-line analysis of the multiple hot bands characterizing polyatomic molecular spectra, which is unattainable under LTE conditions due to the presence of multiple overlapping transitions.
To improve the original non-LTE experiment developed at the IPR15, a mini graphite
Laval nozzle, which can withstand high stagnation temperatures, was implemented into the system to overcome the drawbacks inherent to free jet expansion; that is strong Doppler broadening due to a significant radial velocity component of the molecules in the jet and the presence of extreme temperature and density gradients. Similarly, to record spectra of exotic isotopes and super-heavy elements, a small Laval nozzle was used with the in-gas laser ionization and spectroscopy (IGLIS) technique to reduce the adverse effect of the Doppler broadening that impedes the detection of transitions with close frequencies.20
This paper presents the SMAUG apparatus, our approach to produce out-of-equilibrium spectra by coupling a hypersonic jet issued from a mini graphite Laval nozzle with an ultrasensitive CRDS, and its performance based on the analysis of the recorded CO and CH4 hypersonic-jet spectra.
II. LAVAL NOZZLE DESIGN
Profile calculation
This is the aut
hor’s peer reviewed, accepted manuscript. Howe
ver, the online
version of record will be different
from this
version
once it has bee
n copyedited an d typeset. PLEASE CIT E THIS ARTI C LE AS DOI: 10.1063/5.0003886
7
In our experiments, the probe laser beam is positioned a few centimeters downstream from the outlet of the nozzle and perpendicularly to its axis. Non-divergence of the outlet flow of the nozzle is therefore a prerequisite for avoiding gradients in the direction perpendicular to the flow axis which would complicate the interpretation of the absorption spectrum as a result of transition lines broadening of the absorbing species by the Doppler Effect. Therefore, the aim was to design a small nozzle profile that provides a non-divergent hypersonic argon flow into a vacuum chamber by connecting its inlet area to the IPR high enthalpy source (HES) capable of reaching gas temperatures up to 2000 K.21,22
Profile design is carried out in two steps. In the first step, the argon flow was considered to be quasi-one dimensional, steady, inviscid and fully isentropic. These assumptions help to use the quasi-one dimensional nozzle flow relations to determine a preliminary nozzle profile using the steepest-descent optimization method. These calculations made use of known design parameters for the nozzle flow as reservoir conditions, inlet area, outlet area and length of the divergent part. Radial velocity minimization was the objective function of this optimization process. Initially, radial velocity at the outlet plane was set to zero to ensure the radial uniformity of the flow and the final profile was obtained. In the second step of profile design, this optimum shape was tested through Computational Fluid Dynamics (CFD) simulations based on the Navier-Stokes equations for viscous flow. The simulation revealed the presence of an oblique shock wave inside the divergent part of the nozzle, causing a recompression of the flow and its subsequent radial expansion at the nozzle exit. Figure 2a shows the flow to be non-isentropic and non-uniform. To overcome this problem, the constraint on the radial component of velocity at nozzle outlet, set in first step of optimization, was relaxed and set to as 1.5% of the total velocity at the nozzle exit. Thus obtained nozzle profile was again
This is the aut
hor’s peer reviewed, accepted manuscript. Howe
ver, the online
version of record will be different
from this
version
once it has bee
n copyedited an d typeset. PLEASE CIT E THIS ARTI C LE AS DOI: 10.1063/5.0003886
8
tested in the second step through CFD simulations which showed suppression of the oblique shock wave and uniform flow at nozzle outlet (as shown in Fig. 2b). Following this simulated design, the nozzle was locally machined from isostatic graphite (R6710 grade), which can withstand very high temperatures, and was fixed to the HES via an outer thread on the outside of its convergent part (see Fig. 2c). Our nozzle prototype is characterized by a throat diameter of 2 mm and by an outlet diameter of 24 mm, while the length of its divergent part is 30 mm.
FIG. 2. Argon Laval nozzle design. The CFD simulations were carried out at a stagnation
temperature: 1300 K and at a stagnation pressure: 1100 Torr. The expansion chamber was set at 300 K and 0.5 Torr. Panel a: CFD simulation of the Mach number with fixed zero transverse nozzle exit velocity. Panel b: CFD simulation of the Mach number with transverse nozzle exit velocity set to 1.5% of the magnitude of the total flow velocity. Panel c: sectional view of the graphite Laval nozzle.
This is the aut
hor’s peer reviewed, accepted manuscript. Howe
ver, the online
version of record will be different
from this
version
once it has bee
n copyedited an d typeset. PLEASE CIT E THIS ARTI C LE AS DOI: 10.1063/5.0003886
9
CFD simulations and flow field analysis
The performance of the prototype nozzle was first verified by CFD axi-symmetric simulations carried out with the commercial solver ANSYS Fluent. Modelling the gas flow from the nozzle inlet through the expansion gives a first insight into the jet characteristics related to the intended operational conditions. The stagnation or reservoir temperature and pressure were set to the same values as considered in the design process; 1300 K and 1100 Torr, respectively. The expansion chamber was defined to be at ambient temperature (300 K) and at low pressure (0.5 Torr). Figure 3 shows the simulated temperature contour and the evolution of the Mach number along the central streamline of the expanding flow, downstream of the nozzle exit. As seen in this figure, the jet consists of a hot shear layer of several hundred kelvins surrounding the cold isentropic core where maximum temperature is of the order of few tens of kelvins. The simulated isentropic core of the jet is quasi-uniform over a distance exceeding 40 mm before an oblique shock wave forms at about 60 mm downstream of the exit. From a practical point of view, it means that the probe laser beam has to be positioned between the nozzle exit and before the disturbances induced by the oblique shock wave. Interestingly, the Mach number of the flow increases monotonically from 10 at the nozzle exit up to a value of 18.3 right before the occurrence of the oblique shock wave. According to the conservation of energy, the temperature follows the inverse trend as that of Mach number. Therefore, the temperature decreases monotonically from the nozzle exit, where it is at 34 K, before reaching the remarkably low value of 11.5 K in front of the shock wave.
This is the aut
hor’s peer reviewed, accepted manuscript. Howe
ver, the online
version of record will be different
from this
version
once it has bee
n copyedited an d typeset. PLEASE CIT E THIS ARTI C LE AS DOI: 10.1063/5.0003886
10
FIG. 3. CFD simulation of the hypersonic jet of argon (stagnation temperature: 1300 K;
stagnation pressure: 1100 Torr; residual pressure: 0.5 Torr). Upper panel: temperature mapping; middle panel: temperature along the jet axis; lower panel: Mach number along the jet axis.
As mentioned earlier, the purpose of designing the Laval nozzle shape was to reduce the radial temperature, density and pressure gradients. Figure 4 shows the radial flow field obtained from CFD simulations at a distance of 20 mm from the nozzle exit. The temperature contour, shown in panel a, exhibits two clearly distinct zones of the expansion viz. the cold isentropic core and the surrounding hotter shear layer. A closer insight of the cold zone (panel b) confirms that the core is free of temperature gradients over a radius of about 5 mm. Panel b also shows that the core temperature remains uniform regardless of the initial
This is the aut
hor’s peer reviewed, accepted manuscript. Howe
ver, the online
version of record will be different
from this
version
once it has bee
n copyedited an d typeset. PLEASE CIT E THIS ARTI C LE AS DOI: 10.1063/5.0003886
11
stagnation temperature. Hence, the jet temperature can be tuned by simply changing the stagnation temperature using the presently designed nozzle profile.
The pressure distribution of the flow is represented in panel c. The slight radial velocity divergence that was imposed at the nozzle outlet area to eliminate the oblique shockwave within the divergent part of the nozzle is responsible for a jet static pressure of 0.05 Torr that is well below the static pressure of the vacuum chamber (0.5 Torr). Panel d shows the pressure distribution in the cold core for different stagnation temperatures varied between 500 K and 2000 K. Unlike the temperature, the static pressure of the cold core does not vary with initial stagnation temperature because the stagnation pressure was systematically maintained at 1100 Torr in all simulations.
The evolution of the density (i.e. argon concentration) in the jet was also examined (see panel e). The simulation reveals an important increase of the gas density along the jet radius, similar to the gas temperature increase induced by the presence of the shear layers. This can be problematic as CRDS probes the flow along a line of sight, which crosses both the isentropic core and the shear layers, the latter producing an unwanted hot gas contribution to the integrated absorption spectrum. Fortunately, as it can be seen from panel g, the density and the temperature peaks are shifted by several millimeters so that a significant part of the density corresponds to a very cold flow region. The respective absorption contribution of the cold and hot flow regions (blue and red zones on panel g) are simulated in Figure 5 using a numerical procedure described in Ref.23 It shows that the hot contribution
may not be negligible compared to the cold one. However, the experimental spectrum (panel b) shows that the calculated hot gas contribution is clearly overestimated by a factor of almost 2.5. Panel f demonstrates the range of achievable molecular densities by setting different initial conditions in the reservoir.
This is the aut
hor’s peer reviewed, accepted manuscript. Howe
ver, the online
version of record will be different
from this
version
once it has bee
n copyedited an d typeset. PLEASE CIT E THIS ARTI C LE AS DOI: 10.1063/5.0003886
12
Finally, the axial and radial velocity components are compared on panel h. A slight increase of the radial component can be observed as a function of the radial distance but its value (about 130 m/s) remains one order of magnitude smaller than the axial velocity component (1230 m/s). According to the relation
𝜈̃′= 𝜈̃/ (1 ±𝑣⊥ 𝑐 )
where c is the speed of light, the Doppler FWHM induced by a radial velocity 𝑣⊥ = 130 m/s is estimated to be 0.0026 cm-1 for a line centered at 𝜈̃ = 5885 cm-1. For reference, such a line
broadening is equivalent to a Doppler FWHM corresponding to static methane maintained at 6 K.
This is the aut
hor’s peer reviewed, accepted manuscript. Howe
ver, the online
version of record will be different
from this
version
once it has bee
n copyedited an d typeset. PLEASE CIT E THIS ARTI C LE AS DOI: 10.1063/5.0003886
13
FIG. 4. Cross-section CFD simulations of the hypersonic jet of argon 20 mm from the nozzle
exit (stagnation pressure: 1100 Torr; residual pressure: 0.5 Torr). Left panels: stagnation temperature fixed at 1300 K. Right panels: zoom in the isentropic core. Panel a: temperature cross-section. Panel b: radial temperature. Panel c: static pressure cross-section. Panel d: radial static pressure. Panel e: molecular density cross-section. Panel f: radial molecular
This is the aut
hor’s peer reviewed, accepted manuscript. Howe
ver, the online
version of record will be different
from this
version
once it has bee
n copyedited an d typeset. PLEASE CIT E THIS ARTI C LE AS DOI: 10.1063/5.0003886
14
density. Panel g: normalized radial temperature (green curve), pressure (red curve), and molecular density (blue curve). The blue zone corresponds to the cold flow zone. Panel h: evolution of the radial and axial velocity components for a stagnation temperature of 1300 K.
FIG. 5. Absorption contribution of the cold and hot flow regions Panel a: Simulated IR
spectra of CO 30 cold band. Blue area: cold flow region; pink area: hot flow region; dotted line: sum of the cold and hot contributions. Panel b: Experimental results showing the combined hot and cold spectra.
2D Pitot probe
The flow was characterized experimentally by Pitot pressure measurements. A movable Pitot probe was implemented to establish a two-dimensional mapping of the impact pressure of the jet issued from the nozzle. Assuming an isentropic expansion and
This is the aut
hor’s peer reviewed, accepted manuscript. Howe
ver, the online
version of record will be different
from this
version
once it has bee
n copyedited an d typeset. PLEASE CIT E THIS ARTI C LE AS DOI: 10.1063/5.0003886
15
knowing the stagnation pressure, the Mach number of the flow is extracted from the measured data24 (see Figure 6). The velocity, the temperature, the pressure, and the
molecular density of the gas are hence calculated from the measured Mach number, the specific heat ratio of argon (fixed to 5/3) and the stagnation conditions (temperature, pressure, and molecular density) using the standard isentropic equations for an ideal gas25. It
must be noted that this procedure is no longer valid for non-isentropic flows; in particular it is not suitable for characterizing the shear layers which are sites of non-isentropic dissipative effects. Thus, numerical values relative to the shear layer indicated in Figure 6 are not realistic.
Figure 6 displays the retrieved values from the Pitot measurements. They agree with the simulation shown on figure 3: a regular shock wave intersection is formed at few tens of millimeters (80 mm) downstream the nozzle exit, the radial uniformity of the flow is confirmed, and the monotonic Mach number increase along the flow axis is also confirmed.
This is the aut
hor’s peer reviewed, accepted manuscript. Howe
ver, the online
version of record will be different
from this
version
once it has bee
n copyedited an d typeset. PLEASE CIT E THIS ARTI C LE AS DOI: 10.1063/5.0003886
16
FIG. 6. Mappings extracted from two-dimensional Pitot measurements of a hypersonic flow
of argon (Stagnation pressure: 1290 Torr; Pressure chamber: 0.5 Torr).
III. HYPERSONIC-JET CRDS
Experimental setup
The experimental setup is schematized in Figure 7; its full description can be found in Ref.15. Briefly, it is composed of a heating element (the HES) 21 used to preheat the argon gas
admixed with IR active molecules (CO and CH4 in the present study) before its expansion
This is the aut
hor’s peer reviewed, accepted manuscript. Howe
ver, the online
version of record will be different
from this
version
once it has bee
n copyedited an d typeset. PLEASE CIT E THIS ARTI C LE AS DOI: 10.1063/5.0003886
17
through the nozzle in a vacuum chamber evacuated by an ensemble of roots pumps. The hypersonic flow is probed transversally by CRDS.
The carrier argon gas and the CO or CH4 absorbing species are admitted
independently into the HES through mass flow controllers (Bronkhorst and MKS instruments). The HES is mounted in a stainless-steel tank whose position can be adjusted vertically and horizontally using computer-controlled actuators allowing the CRDS laser to probe any region of the flow.
The laser light is produced by a series of fibered Distributed Feedback (DFB) diode lasers. They are mounted on a custom proportional integral differential (PID) temperature stabilizer that allows the diode temperature to be set from -10°C to 60°C and to produce a bandwidth of 7 nm (30 cm-1) per diode. The optical power output of the diodes varies
typically between 10 and 20 mW and it is divided in two parts: 90% enters the optical cavity and 10% goes into a fast high-precision wavelength meter (HighFinesse WS7-60 Series). The high-finesse cavity (F > 200 000) of the CRDS relies on two high-reflectivity (>99.9987%, Layertec) mirrors mounted onto bellows that are attached to the end of two stainless-steel tubes. The bellows dampen vibrations caused by the pumping unit. The two tubes are extended on either side of the gas jet in order to reduce the unwanted absorption of the static residual gases filling the expansion chamber. In these tubes, nitrogen is continuously injected at a low flow rate of 2 slm to flush out the IR absorbing gases so that the recorded absorption signal is mainly due to the isentropic core and the shear layers. With the isentropic core diameter being 10 mm, a typical ringdown time of 120 μs corresponds to an equivalent absorption length of 450 m. A single lens and two steering mirrors (not shown in Fig. 7) fixed onto an optical table adjacent to the cavity entry are used to focus the light beam at the center of the 80 cm long optical cavity and to align the system into the TEM00
This is the aut
hor’s peer reviewed, accepted manuscript. Howe
ver, the online
version of record will be different
from this
version
once it has bee
n copyedited an d typeset. PLEASE CIT E THIS ARTI C LE AS DOI: 10.1063/5.0003886
18
mode. At the other end of the optical cavity, the output mirror is installed onto a piezoelectric transducer that resonates at 50 Hz and modulates the cavity length in order to ensure resonance with the instantaneous laser frequency. Each ringdown event is measured by using a photodiode and fitted to an exponential decay curve to retrieve the ringdown time and thus the absorption coefficient.
The stagnation and vacuum chamber are measured by resistive (KELLER, 7500 Torr full scale range) and capacitive (MKS instruments, 10 Torr full scale range) pressure gauges respectively.
FIG. 7. Schematic of the SMAUG experimental setup showing the main components (from
left to right): the HES terminated by the Laval nozzle and the CRDS diagnostic probing the hypersonic flow.
This is the aut
hor’s peer reviewed, accepted manuscript. Howe
ver, the online
version of record will be different
from this
version
once it has bee
n copyedited an d typeset. PLEASE CIT E THIS ARTI C LE AS DOI: 10.1063/5.0003886
19
Preliminary study on carbon monoxide
The performance of the experimental setup in terms of rotational and vibrational relaxation was first tested with carbon monoxide (CO) molecules. The gas mixture (5% CO in argon) was initially heated up to around 1400 K at 1010 Torr before being expanded into the vacuum chamber maintained at 0.5 Torr. The 3 0 cold band, as well as the 4 1 and 5 2 hot bands were recorded. According to a standard Boltzmann plot method15, the rotational
temperature of the isentropic core (Trotcore = 12 ± 1K) and the surrounding shear layer (Trotsl = 144 ± 10 K) were retrieved. Note that the rotational temperature of the isentropic core is very similar to the translational temperature determined by Pitot probe measurements, suggesting a rapid rotational relaxation of CO. The obtained rotational temperature in the shear layer is much colder than the one calculated by CFD simulations (up to 700 K at 20 mm from the nozzle exit, see Fig. 4). Such a discrepancy most probably originates from the fact that the Boltzmann plot method delivers one single value which is integrated over the various probed spatial layers having different temperature and density values (see Fig. 4, panel g).
A much higher vibrational temperature (Tvibcore = 1346 ± 52 K) was extracted from the recorded spectra by considering absorption lines of identical lower J rotational quantum number from different cold and hot vibrational bands. As expected, the sudden drop of molecular collisions in the jet prevents the molecules from relaxing their vibrational energy.
IV. APPLICATION TO NON-LTE SPETROSCOPY OF METHANE
LTE versus non-LTE spectra
The hypersonic spectrum of methane was recorded in the region corresponding to the tetradecad polyad. As is described by Rey et al.19, the complexity of studying this region
This is the aut
hor’s peer reviewed, accepted manuscript. Howe
ver, the online
version of record will be different
from this
version
once it has bee
n copyedited an d typeset. PLEASE CIT E THIS ARTI C LE AS DOI: 10.1063/5.0003886
20
lies in the overlapping of several cold bands, ending on the IR active vibrational energy levels of the 14 interacting components of the polyad, and of several hot bands issued from the thermally populated dyad and pentad polyads ending respectively on the poorly studied upper icosad and triacontad polyads.
The stagnation pressure was fixed to Torr for the stagnation pressure. 2 slm of CH4
was admixed to 19 slm of argon. The chamber pressure was set to 0.5 Torr. The spectral ranges 5884 - 6073 cm-1, 6120 - 6140 cm-1 and 6193 - 6219 cm-1 corresponding to our
available laser diodes were systematically examined, giving rise to more than 6300 observed absorption lines (see Fig. 8). As displayed in Figure 8 (panel b) the absorption coefficient of the strongest absorption lines is beyond the dynamical range of the instrument (min = 3.3 ×
10-11 cm-1,
max = 3.7 × 10⁻⁶ cm-1).
This is the aut
hor’s peer reviewed, accepted manuscript. Howe
ver, the online
version of record will be different
from this
version
once it has bee
n copyedited an d typeset. PLEASE CIT E THIS ARTI C LE AS DOI: 10.1063/5.0003886
21
FIG. 8. Panel a: recorded hypersonic jet CH4 spectra over the 5884 – 6219 cm-1 range. Panel
b: part of the recorded spectrum showing a saturated line (max = 3.7 × 10⁻⁶ cm-1). Panel c:
enlarged view showing the instrumental detection limit (min = 3.3 × 10⁻¹¹ cm-1).
Figure 9 compares LTE and non-LTE experimental absorption spectra. Panel c corresponds to our hypersonic jet spectrum. It greatly differs from the direct absorption spectrum recorded at LIPhy under LTE conditions in a static gas cell maintained at 964 K6
(see Fig. 9, panel a). The considerably broader absorption lines are due to multiple overlapping transitions and a Doppler HWHM of 1.72 × 10⁻² cm−1. It is clear that the
information contained in the high temperature static spectrum must be considered as a reference spectrum for a direct comparison with existing databases27–33, however its analysis
relies on a deconvolution of the many unresolved contributions that are able to be resolved in our non-LTE spectrum.
In comparison to the high-temperature static spectrum, the hypersonic jet spectrum exhibits remarkably narrow absorption lines with a FWHM of 0.01 cm-1, however
surprisingly well above the expected value of 0.0026 cm-1 estimated from the simulated
radial flow velocity of 130 m.s-1 (see section II). We have no satisfactory explanation to offer
for such a discrepancy. The linewidths are comparable to those measured at LIPhy by CRDS in a static gas cell maintained at 81 K34 (see panel b). Since at 81 K the population is fully
relaxed to the vibrational ground state, the static cold spectrum is composed of absorption lines belonging exclusively to cold bands. In contrast, the cold-band rotational lines are mostly absent from the portion of the hypersonic jet spectrum corresponding to panel b. Only faint lines can be attributed to transitions originating from the ground vibrational state suggesting that most of the 6300 observed transitions are actually hot band transitions.
This is the aut
hor’s peer reviewed, accepted manuscript. Howe
ver, the online
version of record will be different
from this
version
once it has bee
n copyedited an d typeset. PLEASE CIT E THIS ARTI C LE AS DOI: 10.1063/5.0003886
22
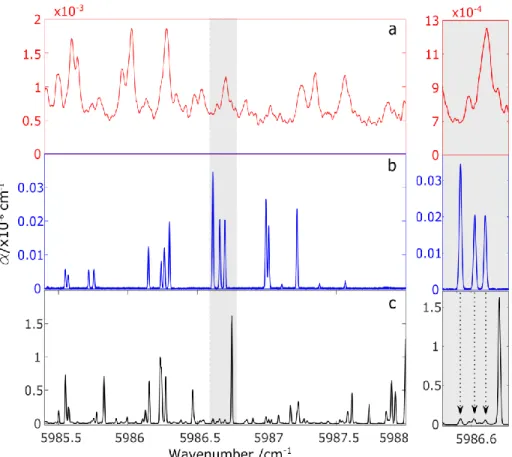
FIG. 9. Left side: Panel a: laser diode absorption LTE spectrum of CH4 recorded at LIPhy in
static conditions at 964 K. Panel b: CRDS LTE spectrum of CH4 recorded at LIPhy in static
conditions at 81 K. Panel c: hypersonic-jet CRDS non-LTE spectrum recorded at IPR. Right side: zoomed region around 5986.5 cm-1, highlighting the disappearance of the cold band
transitions and the appearance of hot band transitions.
The effect of the non-LTE population distribution on the hypersonic jet spectrum of methane is illustrated in Figure 10 for which we have simulated a series of three R(0) transitions at different rotational and vibrational temperatures, either under LTE (upper panel) or non-LTE (lower panel) conditions. The R(0) transitions were extracted from the TheoReTS database.27–29 They were selected as starting respectively from the vibrational
ground state (03010000), the dyad (00210001) and the pentad (00220002). The
This is the aut
hor’s peer reviewed, accepted manuscript. Howe
ver, the online
version of record will be different
from this
version
once it has bee
n copyedited an d typeset. PLEASE CIT E THIS ARTI C LE AS DOI: 10.1063/5.0003886
23
integrated absorption cross sections,𝜎̅𝑖𝑗, were calculated at different rotational and vibrational temperatures using the following equation:
𝜎̅𝑖𝑗(𝑇𝑟𝑜𝑡, 𝑇𝑣𝑖𝑏) = 𝜎̅𝑖𝑗(𝑇0) 𝑄0(𝑇0) 𝑄𝑟𝑜𝑡(𝑇𝑟𝑜𝑡)×𝑄𝑣𝑖𝑏(𝑇𝑣𝑖𝑏)× 𝑒𝑥𝑝 [ 𝐸𝑖 𝑘𝑇0− 1 𝑘( 𝐸𝑖𝑣𝑖𝑏 𝑇𝑣𝑖𝑏+ 𝐸𝑖𝑟𝑜𝑡 𝑇𝑟𝑜𝑡)] × [ 1−𝑒𝑥𝑝[−(𝐸𝑓𝑣𝑖𝑏−𝐸𝑖 𝑣𝑖𝑏 𝑘𝑇𝑣𝑖𝑏 + 𝐸𝑓𝑟𝑜𝑡−𝐸𝑖𝑟𝑜𝑡 𝑘𝑇𝑟𝑜𝑡 )] 1−𝑒𝑥𝑝(−ℎ𝑐𝑣𝑖𝑗̃ 𝑘𝑇0) ] (1)
𝜎̅𝑖𝑗(𝑇0) is the integrated absorption cross section at T0 = 296 K. Q0, Qrot and Qvib are the total, rotational, and vibrational partition functions calculated at the corresponding temperature, i and j subscripts designate the lower and higher energy states respectively, k is Boltzmann’s constant, h is Planck’s constant and c is the speed of light. The values of Qrot and Qvib were calculated using the Total Internal Partition Sum (TIPS) codes35 which was specially extended
to high temperatures by Gamache and coworkers.
It can be seen from Figure 10 that an increase of the vibrational temperature promotes the growth of hot-band transitions; of particular interest is the very low rotational temperature characterizing non-LTE hypersonic jets (fixed at 30 K in the present calculation) which is responsible for magnifying low-J values transitions by more than two orders of magnitude, making our experimental approach well suited for the detection of new hot bands.
This is the aut
hor’s peer reviewed, accepted manuscript. Howe
ver, the online
version of record will be different
from this
version
once it has bee
n copyedited an d typeset. PLEASE CIT E THIS ARTI C LE AS DOI: 10.1063/5.0003886
24
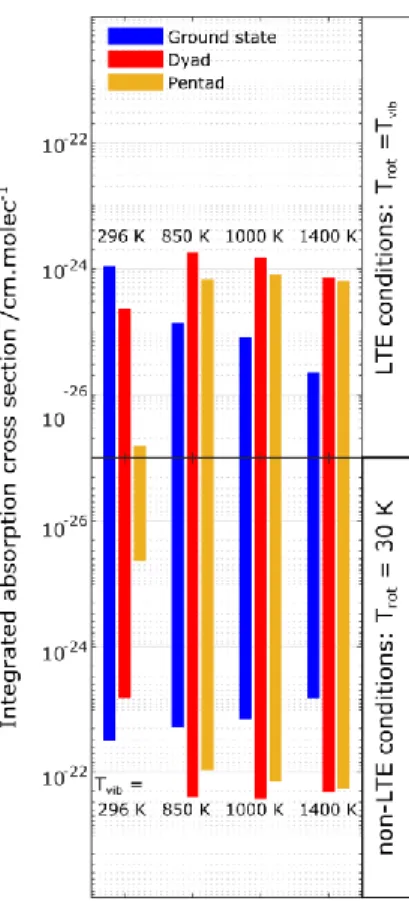
FIG. 10. Evolution of the integrated absorption cross sections at different temperatures of
three R(0) transitions of methane starting respectively from the ground state (blue), the dyad (red) and the pentad (ocher). Upper panel: LTE conditions; Lower panel: non-LTE conditions (rotational temperature fixed at 30 K).
Temperature extraction
Unlike the simple and the well-studied spectrum of CO to date, the analysis of the more complex tetradecad region of methane is incomplete. The Boltzmann plot method used for CO is more difficult to implement for methane, in particular for the determination of the vibrational temperature. Hence the rotational temperature was extracted by direct iterative comparison of our experimental spectrum with simulations based on the HITRAN
This is the aut
hor’s peer reviewed, accepted manuscript. Howe
ver, the online
version of record will be different
from this
version
once it has bee
n copyedited an d typeset. PLEASE CIT E THIS ARTI C LE AS DOI: 10.1063/5.0003886
25
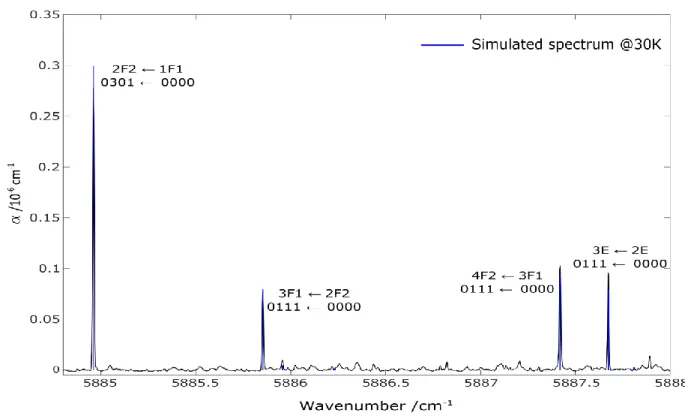
2012 line list.36 By considering only the cold band transitions listed in HITRAN, a good
agreement was achieved for a rotational temperature of Trot = 30 3 K (see Figure 10).
FIG. 11. Determination of the rotational temperature corresponding to the hypersonic jet
spectrum of CH4 using the HITRAN 2012 database.
Regarding the vibrational temperature, non-LTE spectroscopy induces a more complex extraction process. Intensities of R(0) lines starting from different initial vibrational energy levels were considered. Their integrated absorption cross section 𝜎̅𝑖𝑗 was modeled using Equation 1, where the rotational temperature was fixed at 30 K. A first “interpolyad” vibrational temperature of TvibI = 894 ± 47 K was obtained from the intensity ratio of R(0) lines starting from the vibrational ground state and the 4 vibrational energy level of the
dyad, thus confirming the weak vibrational relaxation already observed in a planar
This is the aut
hor’s peer reviewed, accepted manuscript. Howe
ver, the online
version of record will be different
from this
version
once it has bee
n copyedited an d typeset. PLEASE CIT E THIS ARTI C LE AS DOI: 10.1063/5.0003886
26
supersonic expansion of preheated methane17,37. A second “intrapolyad” vibrational
temperature of TvibII = 54 ± 4 K was obtained when comparing intensities of R(0) transitions starting respectively from the lowest (4) and the highest (2) vibrational energy levels of the
dyad confirming the effective population relaxation between the close vibrational energy levels forming a same polyad17,37.
In Fig. 12, our non-LTE spectrum is compared to a simulation performed in LTE conditions at 894 K (TvibI ) using the TheoReTS database. This comparison highlights the drastic intensity reduction of high-J transitions and the hot band magnification induced by the SMAUG apparatus.
FIG. 12. Comparison between the non-LTE experimental spectrum recorded with SMAUG
and a stick spectrum, simulated under LTE conditions at T = 894 K using the TheoReTS database, where the contributions of the cold and hot bands are represented in different
This is the aut
hor’s peer reviewed, accepted manuscript. Howe
ver, the online
version of record will be different
from this
version
once it has bee
n copyedited an d typeset. PLEASE CIT E THIS ARTI C LE AS DOI: 10.1063/5.0003886
27
colors. A small region centered at 6005 cm-1 could not be studied experimentally due to the
lack of the appropriate laser diode. The hot band contribution is clearly magnified in the non-LTE hypersonic spectrum.
V. CONCLUSION
The performance of the SMAUG setup has been characterized in detail by means of CFD, Pitot probe and CRDS. Its contoured graphite Laval nozzle can be operated up to 2000 K. As tested with CO and CH4, it produces a non-LTE quasi-unidirectional supersonic flow limiting
absorption line broadening. The expanded molecules are characterized by both a high vibrational and a low rotational temperature, thus magnifying the low-J rovibrational line intensities of the very many hot bands responsible for the complexity of high temperature infrared spectra of polyatomic molecules. The SMAUG setup will be extensively used to produce non-LTE infrared spectra of simple hydrocarbons in the frame of the e-PYTHEAS project. A planar Laval nozzle is currently under study in order to increase the absorption path length and to further reduce the radial flow velocity component, leading to an increased experimental sensitivity as well as a better line resolution.
ACKNOWLEDGMENTS
Prof. Robert Gamache (University of Massachusetts Lowell) is warmly acknowledged for providing us with a version of the Total Internal Partition Sum (TIPS) codes extended to high temperatures. This work was performed in the frame of the ANR project e-PYTHEAS (ANR-16-CE31-0 0 05) and the CEFIPRA project proposal 6005-N. Dr. Jonathan Thiévin (Université de Rennes) is acknowledged for the formatting of experimental data. Mr. Ewen Gallou (Université de Rennes) is acknowledged for his expertise in the manufacture of the graphite
This is the aut
hor’s peer reviewed, accepted manuscript. Howe
ver, the online
version of record will be different
from this
version
once it has bee
n copyedited an d typeset. PLEASE CIT E THIS ARTI C LE AS DOI: 10.1063/5.0003886
28
Laval nozzle. This work was supported by the Programme National “Physique et Chimie du Milieu Interstellaire” (PCMI) of CNRS/INSU with INC/INP co-funded by CEA and CNES. Dr. Thomas S. Hearne is warmly thanked for his careful reading of the manuscript. We thank Dr. Michaël Rey for stimulating helpful discussion regarding our recorded spectrum of methane.
REFRENCES
(1) Tinetti, G.; Encrenaz, T.; Coustenis, A. Spectroscopy of Planetary Atmospheres in Our Galaxy. Astron Astrophys Rev 2013, 21 (1), 63. https://doi.org/10.1007/s00159-013-0063-6.
(2) Swain, M. R.; Vasisht, G.; Tinetti, G. The Presence of Methane in the Atmosphere of an Extrasolar Planet. Nature 2008, 452 (7185), 329–331.
https://doi.org/10.1038/nature06823.
(3) Bernath, P. F. Molecular Opacities for Exoplanets. Philosophical Transactions of the
Royal Society A: Mathematical, Physical and Engineering Sciences 2014, 372 (2014),
20130087. https://doi.org/10.1098/rsta.2013.0087.
(4) Mayor, M.; Queloz, D. A Jupiter-Mass Companion to a Solar-Type Star. Nature 1995,
378 (6555), 355–359. https://doi.org/10.1038/378355a0.
(5) Swain, M. R.; Tinetti, G.; Vasisht, G.; Deroo, P.; Griffith, C.; Bouwman, J.; Chen, P.; Yung, Y.; Burrows, A.; Brown, L. R.; et al. Water, Methane, and Carbon Dioxide Present in the Dayside Spectrum of the Exoplanet HD 209458b. Nippon rinsho. Japanese
journal of clinical medicine 2009, 704 (2), 1616–1621.
https://doi.org/10.1088/0004-637X/704/2/1616.
(6) Ghysels, M.; Vasilchenko, S.; Mondelain, D.; Béguier, S.; Kassi, S.; Campargue, A. Laser Absorption Spectroscopy of Methane at 1000 K near 1.7 Μm: A Validation Test of the Spectroscopic Databases. Journal of Quantitative Spectroscopy and Radiative Transfer
2018, 215, 59–70. https://doi.org/10.1016/j.jqsrt.2018.04.032.
(7) Czinki, E.; Furtenbacher, T.; Császár, A. G.; Eckhardt, A. K.; Mellau, G. Ch. The 1943 K Emission Spectrum of H216O between 6600 and 7050 Cm − 1. Journal of Quantitative
Spectroscopy and Radiative Transfer 2018, 206, 46–54.
https://doi.org/10.1016/j.jqsrt.2017.10.028.
(8) Anderson, J. D. J. Gasdynamic Lasers: An Introduction; Elsevier, 2012.
(9) Michael, E. A.; Keoshian, C. J.; Wagner, D. R.; Anderson, S. K.; Saykally, R. J. Infrared Water Recombination Lasers. Chemical Physics Letters 2001, 338 (4–6), 277–284. https://doi.org/10.1016/S0009-2614(01)00253-6.
(10) Michael, E. A.; Keoshian, C. J.; Anderson, S. K.; Saykally, R. J. Rotational Transitions in Excited Vibrational States of D2O. Journal of Molecular Spectroscopy 2001, 208 (2), 219–223. https://doi.org/10.1006/jmsp.2001.8378.
(11) Zhao, D.; Doney, K. D.; Linnartz, H. High-Resolution Infrared Spectra of Vibrationally Excited HC4H in a Supersonic Hydrocarbon Plasma Jet. Journal of Molecular
Spectroscopy 2014, 296, 1–8. https://doi.org/10.1016/j.jms.2013.11.008.
This is the aut
hor’s peer reviewed, accepted manuscript. Howe
ver, the online
version of record will be different
from this
version
once it has bee
n copyedited an d typeset. PLEASE CIT E THIS ARTI C LE AS DOI: 10.1063/5.0003886
29
(12) Bazalgette Courrèges-Lacoste, G.; Sprengers, J. P.; Bulthuis, J.; Stolte, S.; Motylewski, T.; Linnartz, H. Vibrationally Excited State Spectroscopy of Radicals in a Supersonic Plasma. Chemical Physics Letters 2001, 335 (3–4), 209–214.
https://doi.org/10.1016/S0009-2614(01)00017-3.
(13) Oomens, J.; Reuss, J. Hot Band Spectroscopy of Acetylene after Intermolecular Vibrational Energy Transfer from Ethylene. Journal of Molecular Spectroscopy 1995,
173 (1), 14–24. https://doi.org/10.1006/jmsp.1995.1213.
(14) Dudek, J.; Puczka, K.; Urbańczyk, T.; Koperski, J. High-Temperature Continuous Molecular Beam Source for Aggressive Elements: An Example of Zinc. Review of
Scientific Instruments 2019, 90 (11), 115109. https://doi.org/10.1063/1.5127809.
(15) Louviot, M.; Suas-David, N.; Boudon, V.; Georges, R.; Rey, M.; Kassi, S. Strong Thermal Nonequilibrium in Hypersonic CO and CH4 Probed by CRDS. J. Chem. Phys. 2015, 142 (21), 214305. https://doi.org/10.1063/1.4921893.
(16) Hepp, M.; Herregodts, F.; Herman, M. Fourier Transform Infrared Jet Spectroscopy Using a Heated Slit Source. Chemical Physics Letters 1998, 294 (6), 528–532. https://doi.org/10.1016/S0009-2614(98)00888-4.
(17) Bronnikov, D. K.; Kalinin, D. V.; Rusanov, V. D.; Filimonov, YU. G.; Selivanov, YU. G.; Hilico, J. C. SPECTROSCOPY AND NON-EQUILIBRIUM DISTRIBUTION OF VIBRATIONALLY EXCITED METHANE IN A SUPERSONIC JET. Journal of Quantitative Spectroscopy and
Radiative Transfer 1998, 60 (6), 1053–1068.
https://doi.org/10.1016/S0022-4073(97)00210-0.
(18) Wallraff, P.; Yamada, K. M. T.; Winnewisser, G. Determination of the Vibrational Temperature of OCS in a Supersonic Free Jet. Journal of Molecular Spectroscopy 1987,
126 (1), 78–81. https://doi.org/10.1016/0022-2852(87)90078-6.
(19) Rey, M.; Nikitin, A. V.; Babikov, Y. L.; Tyuterev, V. G. TheoReTS – An Information System for Theoretical Spectra Based on Variational Predictions from Molecular Potential Energy and Dipole Moment Surfaces. Journal of Molecular Spectroscopy
2016, 327, 138–158. https://doi.org/10.1016/j.jms.2016.04.006.
(20) Ferrer, R.; Barzakh, A.; Bastin, B.; Beerwerth, R.; Block, M.; Creemers, P.; Grawe, H.; de Groote, R.; Delahaye, P.; Fléchard, X.; et al. Towards High-Resolution Laser Ionization Spectroscopy of the Heaviest Elements in Supersonic Gas Jet Expansion. Nature
Commun. 2017, 8, 14520. https://doi.org/10.1038/ncomms14520.
(21) Georges, R.; Thiévin, J.; Benidar, A.; Carles, S.; Amyay, B.; Louviot, M.; Boudon, V.; Vander Auwera, J. High Enthalpy Source Dedicated to Quantitative Infrared Emission Spectroscopy of Gas Flows at Elevated Temperatures. Review of Scientific Instruments
2019, 90 (9), 093103. https://doi.org/10.1063/1.5097696.
(22) Thiévin, J.; Georges, R.; Carles, S.; Benidar, A.; Rowe, B.; Champion, J.-P.
High-Temperature Emission Spectroscopy of Methane. Journal of Quantitative Spectroscopy
and Radiative Transfer 2008, 109 (11), 2027–2036.
https://doi.org/10.1016/j.jqsrt.2008.01.023.
(23) Suas-David, N.; Kulkarni, V.; Benidar, A.; Kassi, S.; Georges, R. Line Shape in a Free-Jet Hypersonic Expansion Investigated by Cavity Ring-down Spectroscopy and
Computational Fluid Dynamics. Chemical Physics Letters 2016, 659, 209–215. https://doi.org/10.1016/j.cplett.2016.06.082.
(24) Shapiro, A. H. COMPRESSIBLE FLUID FLOW. 663.
(25) Pauly, H. Atom, Molecule, and Cluster Beams I: Basic Theory, Production and Detection
of Thermal Energy Beams; Springer Series on Atomic, Optical, and Plasma Physics,
This is the aut
hor’s peer reviewed, accepted manuscript. Howe
ver, the online
version of record will be different
from this
version
once it has bee
n copyedited an d typeset. PLEASE CIT E THIS ARTI C LE AS DOI: 10.1063/5.0003886
30
Atom, Molecule, and Cluster Beams; Springer-Verlag: Berlin Heidelberg, 2000. https://doi.org/10.1007/978-3-662-04213-7.
(26) Nikitin, A. V.; Boudon, V.; Wenger, Ch.; Albert, S.; Brown, L. R.; Bauerecker, S.; Quack, M. High Resolution Spectroscopy and the First Global Analysis of the Tetradecad Region of Methane 12CH4. Phys. Chem. Chem. Phys. 2013, 15 (25), 10071. https://doi.org/10.1039/c3cp50799h.
(27) Rey, M.; Nikitin, A. V.; Bézard, B.; Rannou, P.; Coustenis, A.; Tyuterev, V. G. New Accurate Theoretical Line Lists of 12CH4 and 13CH4 in the 0–13400 Cm−1 Range: Application to the Modeling of Methane Absorption in Titan’s Atmosphere. Icarus
2018, 303, 114–130. https://doi.org/10.1016/j.icarus.2017.12.045.
(28) Rey, M.; Nikitin, A. V.; Tyuterev, V. G. THEORETICAL HOT METHANE LINE LISTS UP TOT= 2000 K FOR ASTROPHYSICAL APPLICATIONS. ApJ 2014, 789 (1), 2.
https://doi.org/10.1088/0004-637X/789/1/2.
(29) Rey, M.; Nikitin, A. V.; Babikov, Y. L.; Tyuterev, V. G. TheoReTS – An Information System for Theoretical Spectra Based on Variational Predictions from Molecular Potential Energy and Dipole Moment Surfaces. Journal of Molecular Spectroscopy
2016, 327, 138–158. https://doi.org/10.1016/j.jms.2016.04.006.
(30) Yurchenko, S. N.; Tennyson, J. ExoMol Line Lists – IV. The Rotation–Vibration Spectrum of Methane up to 1500 K. Mon Not R Astron Soc 2014, 440 (2), 1649–1661.
https://doi.org/10.1093/mnras/stu326.
(31) Tennyson, J.; Yurchenko, S. N.; Al-Refaie, A. F.; Barton, E. J.; Chubb, K. L.; Coles, P. A.; Diamantopoulou, S.; Gorman, M. N.; Hill, C.; Lam, A. Z.; et al. The ExoMol Database: Molecular Line Lists for Exoplanet and Other Hot Atmospheres. Journal of Molecular
Spectroscopy 2016, 327, 73–94. https://doi.org/10.1016/j.jms.2016.05.002.
(32) Rothman, L. S.; Gordon, I. E.; Barber, R. J.; Dothe, H.; Gamache, R. R.; Goldman, A.; Perevalov, V. I.; Tashkun, S. A.; Tennyson, J. HITEMP, the High-Temperature Molecular Spectroscopic Database. Journal of Quantitative Spectroscopy and Radiative Transfer
2010, 111 (15), 2139–2150. https://doi.org/10.1016/j.jqsrt.2010.05.001.
(33) Ba, Y. A.; Wenger, C.; Surleau, R.; Boudon, V.; Rotger, M.; Daumont, L.; Bonhommeau, D. A.; Tyuterev, V. G.; Dubernet, M.-L. MeCaSDa and ECaSDa: Methane and Ethene Calculated Spectroscopic Databases for the Virtual Atomic and Molecular Data Centre.
Journal of Quantitative Spectroscopy and Radiative Transfer 2013, 130, 62–68.
https://doi.org/10.1016/j.jqsrt.2013.05.001.
(34) Kassi, S.; Gao, B.; Romanini, D.; Campargue, A. The Near-Infrared (1.30–1.70 Μm) Absorption Spectrum of Methane down to 77 K. Physical Chemistry Chemical Physics
2008, 10 (30), 4410. https://doi.org/10.1039/b805947k.
(35) Laraia, A. L.; Gamache, R. R.; Lamouroux, J.; Gordon, I. E.; Rothman, L. S. Total Internal Partition Sums to Support Planetary Remote Sensing. Icarus 2011, 215 (1), 391–400. https://doi.org/10.1016/j.icarus.2011.06.004.
(36) Rothman, L. S.; Gordon, I. E.; Babikov, Y.; Barbe, A.; Chris Benner, D.; Bernath, P. F.; Birk, M.; Bizzocchi, L.; Boudon, V.; Brown, L. R.; et al. The HITRAN2012 Molecular Spectroscopic Database. Journal of Quantitative Spectroscopy and Radiative Transfer
2013, 130, 4–50. https://doi.org/10.1016/j.jqsrt.2013.07.002.
(37) Hilico, J. C.; Baronov, G. S.; Bronnikov, D. K.; Gavrikov, S. A.; Nikolaev, I. I.; Rusanov, V. D.; Filimonov, Y. G. High-Resolution Spectroscopy of (Pentad-Dyad) and (Octad-Pentad) Hot Bands of Methane in a Supersonic Jet. Journal of Molecular Spectroscopy
1993, 161 (2), 435–444. https://doi.org/10.1006/jmsp.1993.1249.
This is the aut
hor’s peer reviewed, accepted manuscript. Howe
ver, the online
version of record will be different
from this
version
once it has bee
n copyedited an d typeset. PLEASE CIT E THIS ARTI C LE AS DOI: 10.1063/5.0003886
31
This is the aut
hor’s peer reviewed, accepted manuscript. Howe
ver, the online
version of record will be different
from this
version
once it has bee
n copyedited an d typeset. PLEASE CIT E THIS ARTI C LE AS DOI: 10.1063/5.0003886