HAL Id: hal-00302904
https://hal.archives-ouvertes.fr/hal-00302904
Submitted on 26 Jun 2007HAL is a multi-disciplinary open access
archive for the deposit and dissemination of sci-entific research documents, whether they are pub-lished or not. The documents may come from teaching and research institutions in France or abroad, or from public or private research centers.
L’archive ouverte pluridisciplinaire HAL, est destinée au dépôt et à la diffusion de documents scientifiques de niveau recherche, publiés ou non, émanant des établissements d’enseignement et de recherche français ou étrangers, des laboratoires publics ou privés.
Intercontinental transport of pollution and dust
aerosols: implications for regional air quality
Mian Chin, T. Diehl, P. Ginoux, W. Malm
To cite this version:
Mian Chin, T. Diehl, P. Ginoux, W. Malm. Intercontinental transport of pollution and dust aerosols: implications for regional air quality. Atmospheric Chemistry and Physics Discussions, European Geo-sciences Union, 2007, 7 (3), pp.9013-9051. �hal-00302904�
ACPD
7, 9013–9051, 2007
Intercontinental transport of aerosols
and air quality implications
Mian Chin et al.
Title Page Abstract Introduction Conclusions References Tables Figures ◭ ◮ ◭ ◮ Back Close
Full Screen / Esc
Printer-friendly Version Interactive Discussion
Atmos. Chem. Phys. Discuss., 7, 9013–9051, 2007 www.atmos-chem-phys-discuss.net/7/9013/2007/ © Author(s) 2007. This work is licensed
under a Creative Commons License.
Atmospheric Chemistry and Physics Discussions
Intercontinental transport of pollution and
dust aerosols: implications for regional
air quality
Mian Chin1, T. Diehl2, P. Ginoux3, and W. Malm4 1
NASA Goddard Space Flight Center, Greenbelt, MD, USA
2
University of Maryland Baltimore County, Baltimore, MD, USA
3
NOAA Geophysical Fluid Dynamics Laboratory, Princeton, NJ, USA
4
National Parck Service, CIRA, Colorado State University, Fort Collins, CO, USA Received: 8 June 2007 – Accepted: 12 June 2007 – Published: 26 June 2007 Correspondence to: Mian Chin ([email protected])
ACPD
7, 9013–9051, 2007
Intercontinental transport of aerosols
and air quality implications
Mian Chin et al.
Title Page Abstract Introduction Conclusions References Tables Figures ◭ ◮ ◭ ◮ Back Close
Full Screen / Esc
Printer-friendly Version Interactive Discussion
Abstract
We use the global model GOCART to examine the impact of pollution and dust aerosols emitted from their major sources on surface fine particulate matter concentrations at regional and hemispheric scales. Focusing on the North America region in 2001, we use measurements from the IMPROVE network in the United States to evaluate the
5
model-simulated surface concentrations of the “reconstructed fine mass” (RCFM) and its components of ammonium sulfate, black carbon (BC), organic matter (OM), and fine mode dust. We then quantify the RCFM budget in terms of the RCFM composi-tion, type, and origin to find that in the eastern U.S., ammonium sulfate is the dominant RCFM component (∼60%) whereas in the western U.S., dust and OM are just as
im-10
portant as sulfate but have considerable seasonal variations, especially in the NW. On an annual average, North America regional pollution accounts for nearly 30–40% of the surface RCFM in the western U.S., and for a much higher proportion of 65–70% in the eastern U.S. By contrast, pollution from outside of North America contributes to just 2–6% (∼0.2 µg m−3) of the total RCFM over the U.S. on an annual average. In
15
comparison, long-range transport of dust is more efficient than that of pollution, which brings 3 to 4 times more fine particles to the U.S. (0.5–0.8 µg m−3 on an annual av-erage) with a maximum influence in spring and over the NW. Of the major pollution regions, Europe has the largest potential to affect the surface aerosol concentrations in other continents due to its shorter distance from receptor continents and its larger
20
fraction of sulfate-producing precursor gas in the outflow. With the IPCC emission sce-nario for the year 2000, we find that European emissions increase levels of ammonium sulfate by 1–5 µg m−3 over the surface of northern Africa and western Asia, and its contribution to eastern Asia (≥0.2 µg m−3) is twice as much as the Asian contribution to North America. Asia and North America pollution emissions exert strong impacts on
25
their neighboring oceans, but their influences on other continents are relatively small (≤10%) due to the long traveling distance across the oceans and efficient removal during transport. Among the major dust source regions, Asia displays a significant
in-ACPD
7, 9013–9051, 2007
Intercontinental transport of aerosols
and air quality implications
Mian Chin et al.
Title Page Abstract Introduction Conclusions References Tables Figures ◭ ◮ ◭ ◮ Back Close
Full Screen / Esc
Printer-friendly Version Interactive Discussion
fluence over large areas in the Northern Hemisphere except over the North Atlantic and the tropics, where African dust dominates. The trans-Pacific transport of Asian dust is much more efficient than that of Asian pollution because of the higher elevation and lower removal rate of dust. We notice that the African dust can travel eastward through a pathway spanning across Asia and North Pacific to settle down over the surface of
5
western North America. African dust transported through such a pathway is difficult to detect because it usually merges and travels together with the Asian dust.
1 Introduction
Aerosol, also known as particulate matter (PM), is one of the major air pollutants deter-mining ambient air quality. Airborne particle sizes vary widely from a few nm (10−9m)
10
to a few hundred µm in diameter; those with diameters smaller than 10 µm (PM10) are of health concern because they can penetrate into the lungs, and those smaller than 2.5 µm (PM2.5) pose the most serious risks to human health, being linked to res-piratory or cardiovascular diseases and even deaths (Ostro et al., 1999, 2000; World Health Organization, 2002; Pope, 2002). Aerosol is also known to cause regional
15
haze, which leads to discoloration, loss of texture, and deterioration of visual range in national parks and wilderness areas (Malm et al., 2000). Sources of PM include both direct emissions and chemical transformations of precursor gases emitted from power plants, automobiles, wood burning, forest and agriculture fires, and natural sources (e.g., dust, volcanoes, vegetation).
20
Airborne PM concentration has been regulated in the United States by the Clean Air Act since 1970. Currently, the indices of “good” air quality for PM10 and PM2.5 in the U.S. are 50 µg m−3 and 15 µg m−3 on an annual average, respectively, as set by the U.S. Environmental Protection Agency. Recognizing the importance of visual air quality, the U.S. Congress included legislation in the 1977 Clean Air Act to remedy
25
existing and prevent future visibility impairment in national parks and wilderness areas. Although pollutant emissions in the U.S. are projected to decrease in the next 100
ACPD
7, 9013–9051, 2007
Intercontinental transport of aerosols
and air quality implications
Mian Chin et al.
Title Page Abstract Introduction Conclusions References Tables Figures ◭ ◮ ◭ ◮ Back Close
Full Screen / Esc
Printer-friendly Version Interactive Discussion
years (IPCC, 2001), the long-range transport of aerosols from other regions in the world could increase the surface PM level and may reduce the benefits generated from local emission controls. Recently, much attention has been focused on assessing the long-range transport of aerosols from Asia to North America, because Asia is the fastest economically developing region and has large active deserts, from which the
5
trans-Pacific transport can bring increasingly significant amount of pollution and dust to North America. For example, episodes of elevated sulfate concentrations that were observed in the northwestern U.S. in springtime were attributed to Asian emissions (Jaffe et al., 2003; Bertschi et al., 2004), and satellite images have clearly revealed the trans-Pacific transport of Asian dust during dust storm events, which bring large
10
amounts of dust to western North America and strongly affect the radiation budget and air quality (Husar et al., 2001). Previous global modeling studies have estimated that trans-Pacific Asian pollution could account for 30% of “background” surface sulfate concentrations over the U.S. (i.e., concentration without U.S. anthropogenic emission) (Park et al., 2004), which peaked in the spring season, adding 0.16 µg m−3 to the
15
northwestern U.S. (Heald et al., 2006). It is estimated that the Southeast Asia is the largest contributor to the black carbon over the Arctic and is also partially responsible to the “Arctic Haze” problem (Koch and Hansen, 2005; Koch et al., 2007).
In the meantime, major economically developed regions such as the U.S. and Europe remain major pollution sources. The impact of the North American export of ozone and
20
its precursors on the surface ozone over Europe has been extensively studied, showing a maximum impact during the summer time (Stohl and Trickl, 1999; Wild et al., 2001; Li et al., 2002, 2005; Guerova et al., 2006). Similarly, European pollution increases the surface ozone concentrations over northern Africa, the Mediterranean, and the Near East to a level that exceeds the European Council’s human health standards (Stohl
25
et al., 2002; Duncan and Bey, 2004). The transport of sulfate aerosol from Europe and North America to the Arctic has been identified as the major cause of the “Arctic Haze” (the phenomenon of a visible reddish-brown haze in the atmosphere at high lati-tudes in the Arctic due to air pollution) (Shaw, 1995, and references therein). However,
ACPD
7, 9013–9051, 2007
Intercontinental transport of aerosols
and air quality implications
Mian Chin et al.
Title Page Abstract Introduction Conclusions References Tables Figures ◭ ◮ ◭ ◮ Back Close
Full Screen / Esc
Printer-friendly Version Interactive Discussion
so far, most of the previous source-receptor studies regarding hemispheric transport have primarily concentrated on ozone and individual aerosol species (e.g., sulfate or carbonaceous) or aerosol radiative forcing, leaving large gaps in a comprehensive as-sessment of the surface PM levels that are determined from regional emissions and long-range transport.
5
We present here a global modeling assessment of intercontinental transport of aerosols and its implication for regional air quality with the Goddard Chemistry Aerosol Radiation and Transport (GOCART) model. In this study, we focus on the year 2001, which has been used in our previous analysis of satellite and ground-based sunpho-tometer measurements of aerosol optical thickness (AOT) and aircraft data from the
10
ACE-Asia field experiments (Chin et al., 2003, 2004). The present study brings our focus to the surface aerosol mass concentrations and is intended to (1) quantify the surface fine aerosol mass concentrations over the U.S. that come from regional pol-lutant emission, natural sources, and intercontinental transport, and (2) examine the impact of the pollution and dust emitted from one major source region on the
sur-15
face fine aerosol mass over other areas in the Northern Hemisphere. We will briefly describe the model (Sect. 2), compare the model simulated surface aerosol concen-trations with measurements in the U.S. (Sect. 3), provide assessments of the impact of emissions and long-range transport on the U.S. surface air quality (Sect. 4), and examine the hemispheric influence of the intercontinental transport (Sect. 5), followed
20
by a summary and conclusions (Sect. 6).
2 GOCART model simulation of global aerosol distributions
The GOCART model is used to simulate major tropospheric aerosols including sulfate, dust, black carbon (BC), organic carbon (OC), and sea-salt. Detailed descriptions of the model have been presented in our previous publications (Chin et al., 2000a, b,
25
2002, 2004; Ginoux et al., 2001, 2004) with a few modifications applied to this work. We use assimilated meteorological fields from the NASA Goddard Earth Observing
ACPD
7, 9013–9051, 2007
Intercontinental transport of aerosols
and air quality implications
Mian Chin et al.
Title Page Abstract Introduction Conclusions References Tables Figures ◭ ◮ ◭ ◮ Back Close
Full Screen / Esc
Printer-friendly Version Interactive Discussion
System version 3 Data Assimilation System (GEOS-3 DAS) for 2001 with a spatial res-olution of 2◦ latitude by 2.5◦ longitude and 30 vertical layers. Processes in the model include emission, chemistry, convection, advection, boundary layer mixing, dry and wet deposition, and gravitational settling. AOT is calculated from dry mass concentrations and mass extinction coefficients which are determined from the size distributions,
re-5
fractive indices, and hygroscopic properties of the individual aerosol types as a function of ambient relative humidity (Chin et al., 2002).
Emissions from fuel combustion sources are taken from the Special Report of Emis-sion Scenarios (SRES) for the year 2000 (Naki´cenovi´c et al., 2000) for SO2and from Cooke et al. (1999) for BC and OC. Biofuel emissions of BC and OC are based on
10
the biofuel use assessment study of Yevich and Logan (2003) with emission factors of 0.6 g BC and 4.0 g OC per kg dry mass consumed. Biomass burning emissions in 2001 are based on the monthly dry mass burned data from the Global Fire Emission Dataset (van der Werf et al., 2003), using emission factors of 8, 1, and 1.1 g kg−1 for OC, BC, and SO2, respectively. These emission factors have been somewhat modified
15
from our previous work but remain within the range of the values reported in the liter-ature (see Chin et al., 2002, for details). Dust and sea-salt emissions for particle size from 0.1 to 10 µm (dry radius) are calculated as a function of surface properties and wind speed (Ginoux et al., 2001; Chin et al., 2002, 2004). In addition, biogenic and volcanic emissions are also included in the model. The annual emissions of total sulfur
20
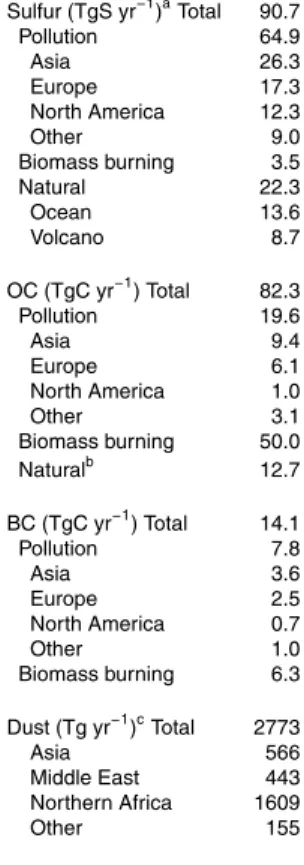
(mostly in the form of SO2 over land and dimethylsulfide, or DMS, over ocean), car-bonaceous species (OC and BC), and dust in the Northern Hemisphere for 2001 are listed in Table 1, with the northern hemispheric emission pattern shown in Fig. 1. Major industrial pollution regions in the Northern Hemisphere, identified as North America, Europe, and Asia, account for about 85% of global pollution sources of SO2, BC, and
25
OC. As for dust, more than 90% is emitted from desert regions of northern Africa, Mid-dle East (including Central Asia), and Asia (including China and Mongolia), with almost 60% from northern Africa (Table 1). The domains of three major anthropogenic source regions are outlined in Figs. 1a and b and three major dust regions in Fig. 1c. The
ACPD
7, 9013–9051, 2007
Intercontinental transport of aerosols
and air quality implications
Mian Chin et al.
Title Page Abstract Introduction Conclusions References Tables Figures ◭ ◮ ◭ ◮ Back Close
Full Screen / Esc
Printer-friendly Version Interactive Discussion
impacts of these regional emissions will be analyzed in Sects. 3 and 4.
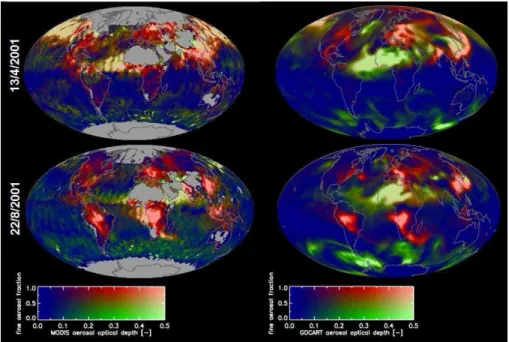
Our previous analyses of the satellite and ACE-Asia field experiment data for spring 2001 have shown that the observed aerosol distributions and long-range transport were adequately captured by the model (Chin et al., 2003, 2004). Figure 2 illustrates the global fields of AOT, separated by fine mode (red) and coarse mode (green)
compo-5
nents, on 13 April and 22 August 2001 observed by the Moderate Resolution Imaging Spectroradiometer (MODIS) instrument on the EOS-Terra satellite and simulated by the GOCART model. The fine mode AOT consists mainly of pollution and biomass burning aerosols while the coarse mode consists mainly of dust and sea-salt aerosols. On 13 April 2001, the cross-Pacific transport of dust and pollution from Asia to North
10
America and the cross-Atlantic transport of dust from Africa to Central America are clearly revealed, while on 22 August large smoke plumes from South America to the southern Atlantic and from southern Africa to the Indian Ocean are evident from both MODIS and the model. The impact of such large-scale transport on the receptor re-gion’s air quality depends on the perturbation of the surface aerosol concentrations,
15
which we will discuss in the following sections.
3 Surface aerosol concentrations over the U.S. from IMPROVE and model
3.1 IMPROVE data
Our model results for surface aerosol concentrations are evaluated here with observa-tions over the U.S. from the Interagency Monitoring for Protected Visual Environments
20
(IMPROVE) network. The IMPROVE program was initiated in 1985 by the U.S. fed-eral agencies EPA, National Park Services, Department of Agriculture-Forest Service, and other land management agencies as a part of the EPA Regional Haze program (Malm et al., 1994). IMPROVE has implemented an extensive, long-term monitoring program in order to establish current visibility conditions and track visibility changes
25
in national parks and wilderness areas. There are more than 100 IMPROVE sites in 9019
ACPD
7, 9013–9051, 2007
Intercontinental transport of aerosols
and air quality implications
Mian Chin et al.
Title Page Abstract Introduction Conclusions References Tables Figures ◭ ◮ ◭ ◮ Back Close
Full Screen / Esc
Printer-friendly Version Interactive Discussion
the U.S. routinely measuring aerosol chemical compositions as well as fine and coarse mode aerosol mass concentrations (http://vista.cira.colostate.edu/IMPROVE). The lo-cations of the IMPROVE sites that provided data in 2001 are shown in Fig. 3. We divide the U.S. into four quadrants, NW, SW, NE, and SE with dividing lines along 40◦N and 100◦W, to differentiate regional features.
5
The fine mode aerosol species of sulfate, OC, BC, and dust from IMPROVE are used in this study. While sulfate particles are collected on a nylon filter and analyzed by ion chromatography, OC and BC (aka elemental carbon or EC) are derived based on ther-mal optical reflectance combustion, a process that involves multiple steps including heating the sample and oxidizing/reducing the carbon to different chemical compounds
10
(e.g., CO2, CH4) (see Malm et al., 1994, for details). As such, the reported OC and BC data from the IMPROVE sites would have relatively larger uncertainties than would sulfate. The mass of soil dust is calculated from a linear combination of the measured elements associated predominantly with soil, including Al, Si, Ca, Fe, and Ti (Malm et al., 1994); uncertainties associated with the reported dust values reflect the range
15
and variation of mineral composition from a variety of soil types. Finally, in addition to PM2.5 and PM10, IMPROVE also reports the quantity of “reconstructed fine mass” (RCFM), which is the sum of mass concentrations of ammonium sulfate, organic matter (OM), BC, and fine dust particles (diameter less than 2.5 µm). Nitrate and sea-salt are excluded from the RCFM because of the significant loss of nitrate particles during
sam-20
pling and the negligible amount of sea-salt at most of the sites (Malm et al., 1994). We will therefore use the quantity of RCFM in this study, which is particularly appropriate because the GOCART model does not include nitrate. The IMPROVE measurements showed that concentrations of RCFM are very close to that of PM2.5 in most places over the U.S., except in California where nitrate can make up a significant fraction of
25
PM2.5 (Malm et al., 1994, 2003). In the reported RCFM, ammonium sulfate mass is converted from the measured sulfate ion by multiplying a factor of 1.375, assuming that sulfate exists in the form of ammonium sulfate (or 100% neutralization); the OM is estimated by applying a correction factor of 1.4 to the OC mass concentrations to
ACPD
7, 9013–9051, 2007
Intercontinental transport of aerosols
and air quality implications
Mian Chin et al.
Title Page Abstract Introduction Conclusions References Tables Figures ◭ ◮ ◭ ◮ Back Close
Full Screen / Esc
Printer-friendly Version Interactive Discussion
account for non-carbon mass contained in the organic carbon aerosol (Malm et al., 1994, 2003). The same conversion factors are applied to the model-calculated sulfate and OC to construct the modeled value of RCFM.
3.2 Composition of surface fine aerosol mass over the U.S.
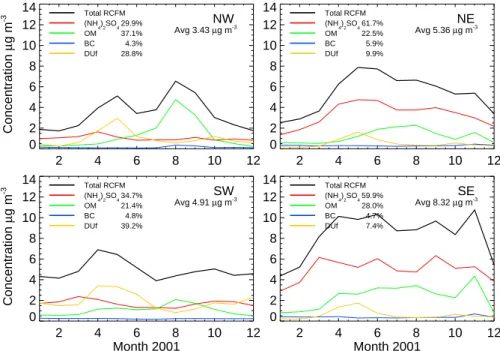
Daily variations in surface aerosol species and RCFM concentrations are illustrated in
5
Fig. 4 at four IMPROVE sites, each located in the NW, SW (in Fig. 4a), NE, and SE (in Fig. 4b) quadrants. At the NW site of Sula, Montana (SULA1), the seasonal variation of RCFM exhibits two maxima, one in the spring (April-May) controlled mainly by dust from long-range transport, and the other in the summer (July–August) caused by car-bonaceous (OC and BC) from biomass burning. At the SW site of Bandelier National
10
Monument, New Mexico (BAND1), dust is the major aerosol component, most of which is from the nearby Sonora Desert (located at southwestern Arizona and southeastern California) but the spring peak is caused by the trans-Pacific transport from Asia (see Sect. 4). Notably, the model-simulated BC and OC concentrations in the first and last quarter of the year are much lower than the measurements (average 80% lower). This
15
may be explained in part by the fact that we did not consider the seasonal variation of anthropogenic BC and OC emissions which are suggested to be 15 to 50% higher in the winter than in the summer (Park et al., 2003).
The two eastern sites (Fig. 4b), Bondville, Illinois (BOND1) in NE and Sipsy, Alabama (SIPS1) in SE show much higher RCFM concentrations than the two western sites in
20
the U.S. (Fig. 4a) mainly because of much stronger industrial pollution emissions in the eastern U.S. (Fig. 1). The model attributes the increase of BC and OC in November to biomass burning, but it misses the high episode in March that is likely also from biomass burning. However, these episodic events cannot be resolved by the monthly averaged fire emission data we used in the model. Fine dust at the two eastern sites
25
shows a spring maximum which is connected with the long-range transport, a feature rather similar to that displayed in Fig. 4a for the western sites.
Comparisons of monthly averaged concentrations of RCFM between the measure-9021
ACPD
7, 9013–9051, 2007
Intercontinental transport of aerosols
and air quality implications
Mian Chin et al.
Title Page Abstract Introduction Conclusions References Tables Figures ◭ ◮ ◭ ◮ Back Close
Full Screen / Esc
Printer-friendly Version Interactive Discussion
ments and the model at 142 IMPROVE sites for 2001 are plotted in Fig. 5. The majority of these values agrees to within a factor of 2; the points where the model is more than 2 times higher or lower than the data are mostly from the disagreement in fine dust (higher in the model) and carbonaceous (lower in the model) concentrations. Overall, the model captures the IMPROVE reported RCFM levels and seasonal variations with
5
small bias as indicated by the relatively high correlation coefficient (R), low bias (B), and high skill score (S), but the statistics are different for each RCFM component, as listed in Table 2. The model shows the best skill in simulating sulfate (R=0.82, B=1.15, S=0.88), but its simulated carbonaceous aerosol concentrations (especially OC) are lower and fine dust concentrations are higher than the IMPROVE reported values and
10
with lower correlation coefficients (R=0.5–0.6). This discrepancy reflects either defi-ciencies in the model, such as a lack of seasonal variation of BC and OC emissions from fossil fuel and biofuel consumptions, as discussed earlier, or insufficient removal of dust during transport. On the other hand, uncertainties in the IMPROVE carbona-ceous and dust aerosol data are also relatively high because they are either inferred
15
from optical/thermal measurements (for BC and OC) or derived from a combination of multiple mineral elements (for dust) as described in Sect. 3.1. In any case, the dis-crepancies suggest that the model may underestimate the influence of North American regional sources but overestimate that of long-range transport on the surface RFCM over the U.S., since most carbonaceous aerosols are generated by the North American
20
sources while most dust is transported into the U.S. (see Sect. 4).
The area-averaged seasonal cycle of RCFM and its composition calculated with the model for the entire domain of NW, SW, NE, and SE are shown in Fig. 6. As indi-cated earlier, sulfate is counted as ammonium sulfate and OC as OM in constructing the quantity of RCFM. The annual averaged RCFM concentrations are highest in the
25
SE (8.32 µg m−3) and lowest in the NW (3.43 µg m−3), with NE (5.36 µg m−3) and SW (4.91 µg m−3) in between. The major difference between the western and eastern U.S. is that ammonium sulfate dominates the RCFM in the east by taking up nearly 60% of the total RCFM while it shares the burden with dust and OM in the western U.S.
ACPD
7, 9013–9051, 2007
Intercontinental transport of aerosols
and air quality implications
Mian Chin et al.
Title Page Abstract Introduction Conclusions References Tables Figures ◭ ◮ ◭ ◮ Back Close
Full Screen / Esc
Printer-friendly Version Interactive Discussion
The seasonal cycle of OM is significantly different among the four quadrants, which is regulated primarily by biomass burning with profound spatial and temporal variations. BC makes up just 4–6% of RCFM across the U.S., although it is the most important species for light absorption and aerosol atmospheric heating. The model calculated annual averaged concentrations of RCFM and its components for the four quadrants
5
are tabulated in Table 3, together with the results from model experiments aimed at associating the RCFM with the source types and regions. These model experiments will be discussed next.
4 Origins of surface aerosols over the U.S.: regional sources vs. intercontinen-tal transport
10
Having analyzed the spatial and temporal variations of the surface RCFM over the U.S., we now try to quantify the amount of RCFM from regional pollution sources that may be regulated by the air quality management as opposed to those from natural sources or from long-range transport that is difficult to control. We have conducted a series of model experiments to estimate the RCFM from North American pollution sources
15
vs. “background” (i.e. from natural and long-range transport), and from total regional sources (pollution, natural, and biomass burning) vs. intercontinental transport. The model experiments are designed in such a way that emissions from a selected source type (e.g., fossil fuel, biomass burning, dust) or a source region (e.g., Asia, Europe, Africa) are excluded in each model run, and the difference between the “standard”
20
run with all emissions included and the runs with a particular source type or region ex-cluded is considered as the contribution from that source type or region. We categorize the source types as those tabulated in Table 2: “pollution”, which includes emissions from fossil fuel and biofuel consumptions, “biomass burning”, which includes both nat-ural wild fires and burning from agriculture waste or land management practice, and
25
“natural”, which includes emissions from ocean, vegetation, deserts, and volcanoes. Figure 7 shows the seasonal cycles of RCFM that are attributed to different source
ACPD
7, 9013–9051, 2007
Intercontinental transport of aerosols
and air quality implications
Mian Chin et al.
Title Page Abstract Introduction Conclusions References Tables Figures ◭ ◮ ◭ ◮ Back Close
Full Screen / Esc
Printer-friendly Version Interactive Discussion
categories averaged over the four quadrants in the U.S. In the western half, North American regional pollution (NAM in Fig. 7) accounts for 28% of the surface RCFM in the NW and 38% in the SW, with the rest being “background”. In contrast, regional pollution exhibits a clear dominance in the eastern U.S., accounting for 71% and 65% of the total surface RCFM in the NE and the SE, respectively. The intercontinental
5
transported pollutants (TAP) provide about 0.2 µg m−3 RCFM to the U.S., which is about 4 to 10 times less in the western and 20 to 30 times less in the eastern U.S. than North America’s own pollution RCFM. On the other hand, long-range transport of dust adds significant amount of fine particles, 0.7–0.8 µg m−3 over the western and a little over 0.5 µg m−3 over the eastern U.S. on an annual average. While North
Amer-10
ican pollution aerosols have relatively small seasonal variations, background aerosols (BMB, NAT, TDUf, and TAP) fluctuate considerably by season and region. For
exam-ple, biomass burning aerosol contribution can change from zero during non-burning seasons to dominant in the peak burning season; likewise, fine dust concentrations during the peak transport season can be hundreds of times higher than those in the
15
“quiet” seasons. Thus, the significance of the background aerosol varies significantly with location and time, especially in the NW.
The total amount of RCFM from the intercontinental transport is the sum of pollution and fine dust originating in regions other than North America (TAP+TDUf in Fig. 7),
with a majority being dust (70–80%). On an annual and area average basis, the
inter-20
continental transport raises RCFM in the NW, SW, NE, and SE regions by 1.0, 0.91, 0.72, and 0.75 µg m−3, respectively, corresponding to 30%, 19%, 14%, and 9% of the total RCFM in those regions. Therefore, the majority of the surface fine mass over the U.S. is from North American regional sources, including pollution, biomass burning, and natural sources.
ACPD
7, 9013–9051, 2007
Intercontinental transport of aerosols
and air quality implications
Mian Chin et al.
Title Page Abstract Introduction Conclusions References Tables Figures ◭ ◮ ◭ ◮ Back Close
Full Screen / Esc
Printer-friendly Version Interactive Discussion
5 Hemispheric influence of intercontinental transport
Although our main focus in this paper is to assess the impact of aerosols from dif-ferent types and regions on surface air quality over the U.S., we further examine the hemispheric influence of pollution and dust aerosols from their major source regions in order to gain a broader perspective on intercontinental transport influences. Because
5
ammonium sulfate is generally the major component of pollution aerosols, we use it as a surrogate for pollution aerosols in the following analysis. The major pollution and dust source regions are shown in Fig. 1 with their emission amounts listed in Table 1. Recall that the contribution from each region is estimated from the difference between a model simulation with all emissions included and one with a particular regional emission
ex-10
cluded. Our previous studies have shown that the model reproduces the observed sulfate and dust concentrations and seasonal variations to within a factor of 2 in the major pollution sources regions (e.g., North America and Europe) and over the areas affected by the transport (e.g., western Pacific and North Atlantic) (Chin et al., 2000b, 2003; Ginoux et al., 2001, 2004), providing a foundation for our assessment here.
15
5.1 Pollution transport
Figure 8a displays the annually averaged surface ammonium sulfate concentrations in the Northern Hemisphere in 2001 and contributions from pollution sources in Asia, Eu-rope, and North America. Over East Asia, the surface ammonium sulfate concentration is about twice as high as that over the eastern U.S. and Europe (top panel, Fig. 8a),
20
due to higher emission of SO2(Table 1) and faster oxidation rate of SO2to form sulfate (Chin et al., 2000b). As expected, pollution sources exert the largest impact on their own regions and neighboring oceans (2nd to 4th panels in Fig. 8a) where more than 80% of the surface sulfate in the source regions and 50% over neighboring oceans are from regional pollution.
25
Most of the Asian pollution export moves toward the east across the Pacific Ocean, increasing the ammonium sulfate at the surface over the western U.S. by 0.1–
ACPD
7, 9013–9051, 2007
Intercontinental transport of aerosols
and air quality implications
Mian Chin et al.
Title Page Abstract Introduction Conclusions References Tables Figures ◭ ◮ ◭ ◮ Back Close
Full Screen / Esc
Printer-friendly Version Interactive Discussion
0.2 µg m−3 on annual average (2nd panel in Fig. 8a). Some of the pollution is trans-ported westward to add 0.1–0.5 µg m−3ammonium sulfate to eastern Europe and Mid-dle East, and more than 0.1 µg m−3to North Africa. Even so, Asian emission results in no more than a 10% increase of surface sulfate to downwind continents on an annual average except Canada and Greenland (2nd panel in Fig. 8a). Trans-Pacific transport
5
from Asia to North America involves the uplifting of Asian air by convection, followed by a rapid horizontal transport in the prevailing westerlies and subsidence over the west-ern part of North America. The large gradient of Asian pollution sulfate between the east coast of Asia and the west coast of North America (a factor of 50 to 100) implies a combined effect of plume height and efficient removal of sulfate during transport. Most
10
pollution sulfate is located within the boundary layer upon leaving the Asian coast, as observed during the ACE-Asia experiment (e.g., Anderson et al., 2003; Chin et al., 2003), subjecting it to relatively fast removal; only the fraction entrained in the west-erly jet can make the long journey across the Pacific. Our results thus suggest that Asian pollution does not have a large potential to affect the surface fine particle mass
15
concentrations on other continents despite its high emission rates.
European pollution, on the other hand, is more widely spread than the Asian pollu-tion (3rd panel in Fig. 8a). It provides about 0.1–0.2 µg m−3 of ammonium sulfate to the entire Arctic surface, 0.2–2 µg m−3 to northern Asia, and 0.2–0.5 µg m−3 to east-ern China. Our budget analysis shows that the amount of ammonium sulfate from
20
European pollution on average can be 60% of that from Asian pollution over the U.S., with its strongest influence over the NE. The region which is particularly vulnerable to European pollution is northern Africa, simply because of the short traveling distance between these two continents. As much as 5 µg m−3 of ammonium sulfate over the northern African countries adjacent to the Mediterranean Sea is attributed to the
Euro-25
pean pollution source, which accounts for 50–80% of the surface sulfate budget there. It is also notable that European pollution contributes more to the surface ammonium sulfate increase over East Asia (0.2–0.5 µg m−3) than Asian emission contributes to North America (0.1–0.2 µg m−3) on an annual average in 2001. The export of
Euro-ACPD
7, 9013–9051, 2007
Intercontinental transport of aerosols
and air quality implications
Mian Chin et al.
Title Page Abstract Introduction Conclusions References Tables Figures ◭ ◮ ◭ ◮ Back Close
Full Screen / Esc
Printer-friendly Version Interactive Discussion
pean pollution often occurs in the boundary layer (e.g. Wild et al., 2001) and contains a higher fraction of SO2than does the outflow from either Asia or North America (Chin and Jacob, 1996; Chin et al., 2000b), a combination that allows continued produc-tion of sulfate within the boundary layer during transport and thus produces a broader influence on the surface sulfate concentrations.
5
Relative to the spatial spreading of Asian and European sulfate, North America pol-lution is more regionalized (4th panel in Fig. 8a), but its contribution to the surface ammonium sulfate over northern Africa and Saudi Arabia (0.1–0.2 µg m−3) is similar to the contribution from Asia to the western U.S. It has been suggested that the North American influence over northern Africa and the Middle East is due to the deep
bound-10
ary layer mixing over those arid regions that entrains the plume from aloft (Li et al., 2001).
Our results for total and “background” ammonium sulfate surface concentrations and the Asian influences over the U.S. are similar to the equivalent quantities from the GEOS-CHEM model simulations that used the same meteorological fields for the same
15
year (Park et al., 2004), as summarized in Table 4. The major difference between the two studies is the European influence over the eastern U.S.: we have found that the pollution transport from Europe and Asia is of comparable importance, but the bud-get shown in Park et al. (2004, Table 2) implies negligible influence from European pollution, although the European budget was not explicitly calculated in that study.
Dif-20
ferences in emission and budget classification from our different model experiment de-signs may explain the apparent discrepancy, which is expected to be resolved through the modeling exercise in the current United Nation Task Force assessment of Hemi-spheric Transport of AtmoHemi-spheric Pollutants (http://www.htap.org), in which common pollution regions of North America, Europe, East Asia, and South Asia are defined by
25
the Task Force for all participating models including GOCART and GEOS-CHEM.
ACPD
7, 9013–9051, 2007
Intercontinental transport of aerosols
and air quality implications
Mian Chin et al.
Title Page Abstract Introduction Conclusions References Tables Figures ◭ ◮ ◭ ◮ Back Close
Full Screen / Esc
Printer-friendly Version Interactive Discussion
5.2 Dust transport
The annual surface concentrations of fine dust and contributions from major source regions in Asia, Middle East, and North Africa are shown in Fig. 8b. A clear dust band with fine dust concentrations above 5 µg m−3expands from the sub-tropical North Atlantic to northeastern Asia (1st panel in Fig. 8b). Away from the source regions,
5
Asian dust seems to have the largest influence on the surface fine dust over extra-tropical North Pacific and North America, with a contribution of 0.2–1 µg m−3. The concentration gradient across the Pacific for dust is a factor of about 20 (e.g., the dust concentration off the coast of China is about 20 times higher than that at the west coast of North America), which is much smaller than the concentration gradient of
10
sulfate that we saw earlier, suggesting a more efficient trans-Pacific transport of dust than of sulfate. This is because the higher elevation of the Asian dust plume (above the boundary layer upon leaving Asia, e.g., Anderson et al., 2003; Chin et al., 2003) and the lower wet scavenging efficiency results in slower loss rate of dust than of sulfate during trans-Pacific transport. Over the Arctic, above 50% (or >0.1 µg m−3) of the
15
surface fine dust is from Asia, an amount that is comparable to the European pollution contribution to Arctic sulfate (Fig. 8a). These results have yet to be verified with surface measurements, although the optical measurements in April 2002 at the Barrow Alaska baseline observatory detected a clear dust existence for several days that was traced back to the Gobi desert by a trajectory analysis (Stone et al., 2005).
20
Dust emitted from the Middle East has the highest impact over India, northeastern Africa, and North Indian Ocean with an increase of 1–5 µg m−3 (3rd panel in Fig. 8b). The dust emitted from this region can travel to northern and eastern Asia as well as to eastern Africa. The northward transport delivers dust that accounts for more than 10% of the surface fine dust concentrations in the Arctic.
25
The vast desert area over Africa is the largest dust source on the globe. Much of this dust is transported westward across the Atlantic under the influence of trade winds to arrive at Central America and equatorial South America, whereas the northward
ACPD
7, 9013–9051, 2007
Intercontinental transport of aerosols
and air quality implications
Mian Chin et al.
Title Page Abstract Introduction Conclusions References Tables Figures ◭ ◮ ◭ ◮ Back Close
Full Screen / Esc
Printer-friendly Version Interactive Discussion
transport over the Mediterranean is linked to the presence of cyclones (Prospero, 1996; Moulin et al., 1997) to reach southern Europe. Both pathways bring 1–5 µg m−3of fine dust to the surface of affected areas (4th panel in Fig. 8b). There is also an eastward transport pathway that takes the African dust to Asia, traveling a long distance in the mid-tropospheric westerlies across the North Pacific to eventually subside in western
5
North America, raising fine dust levels by 0.2–0.5 µg m−3 at the surface. While the trans-Atlantic and cross-Mediterranean transport of African dust is frequently detected by satellite (e.g., MODIS data in Fig. 1), the trans-Pacific transport of African dust is difficult to recognize because it easily loses its distinct characteristics after merging with the Asian dust. A recent study has reported detecting of long-range transport
10
of Saharan dust through a pathway spanning Asia and North Pacific to western North America in the absence of any Asian dust activities (McKendry et al., 2007); this finding is supported by our modeling results.
6 Summary and conclusions
In summary, we have used the GOCART model to estimate the origins of the surface
15
fine aerosol particle concentrations over the U.S. that are generated from North Ameri-can industrial pollution, biomass burning, and natural sources, as well as from intercon-tinental transport from other major source regions. Comparisons of model-simulated surface concentrations of sulfate, OC, BC, fine dust, and total RCFM with observations at 142 sites in the IMPROVE network have revealed that the model captures the
spa-20
tial and temporal variations of the observed sulfate with high correlation and low bias, but predicts higher fine dust and lower non-biomass burning carbonaceous aerosols than the IMPROVE derived data. This discrepancy may be explained in part by model deficiencies and in part by the relatively high uncertainties in the data. The quantity of RCFM from the IMPROVE sites, which is equivalent to PM2.5 in most places in the
25
U.S., agrees with the model in both concentration and spatial variation. The model es-timates that ammonium sulfate in the eastern U.S. is the dominant component (∼60%)
ACPD
7, 9013–9051, 2007
Intercontinental transport of aerosols
and air quality implications
Mian Chin et al.
Title Page Abstract Introduction Conclusions References Tables Figures ◭ ◮ ◭ ◮ Back Close
Full Screen / Esc
Printer-friendly Version Interactive Discussion
of the surface RCFM in all seasons, whereas in the western U.S. dust and OM are just as important as sulfate but have considerable seasonal variations especially in the NW. The annual averaged RCFM concentrations in the NW, SW, NE, and SW quadrants in the U.S. are calculated at 3.43, 4.91, 5.36, 8.32 µg m−3, respectively, for 2001.
By targeting individual source types and source regions in our model experiments,
5
we have been able to place the surface RCFM in the context of regional industrial pollution, biomass burning, natural emissions, and intercontinental transport. We have found that North America regional pollution accounts for nearly 30 to 40% of the surface RCFM in the western U.S. and much more in the eastern U.S. with 65 to 70%. In contrast, pollution transport from outside North America only contributes to 2 to 6% of
10
the total RCFM over the U.S., with the NW being the most affected area.
Of the “background” RCFM, namely the RCFM from sources other than North Amer-ican pollution, fine dust is the most important component in the western U.S., compris-ing 30–40% of the total surface RCFM in that region. While almost half of the fine dust in the NW is from Asia, more than 60% in the SW is from the local desert areas. In
15
the eastern U.S., however, natural aerosols, mostly OM from terpene oxidation, are the most significant contributor to background RCFM, especially in the summer. Biomass burning aerosols account for about 10–27% of the background aerosol on an annual average, yet they have shown very strong seasonal variations and could well become the predominant RCFM component during the burning season. There is also a large
20
seasonal variation for fine dust over the U.S from long-range transport that peaks in the springtime.
The total amount of imported RCFM from outside North America consists of dust and pollution, with the proportion of dust being 2 to 4 times higher than that of pollution. The total import is a factor of about 2 to 10 times smaller than the “native” RCFM which
25
includes pollution, biomass burning, and natural aerosols originating in North America. It is also much smaller than the native pollution RCFM, except in the NW. We should note that large episodic events, such as dust storms in Asia, can create intermittent air quality problems over North America, especially over the west coast, even though
ACPD
7, 9013–9051, 2007
Intercontinental transport of aerosols
and air quality implications
Mian Chin et al.
Title Page Abstract Introduction Conclusions References Tables Figures ◭ ◮ ◭ ◮ Back Close
Full Screen / Esc
Printer-friendly Version Interactive Discussion
these events are usually short-lived. As a result of the above analysis, it seems very clear that controlling North America pollution emission is both the most responsible and the most effective way to improve air quality within the region.
We have also demonstrated the extent to which pollution and dust emissions from their major source regions may affect PM surface concentrations on a hemispheric
5
scale. Of the three major industrial pollution regions, Asia, Europe, and North America, we have found that on an annual average, Asian pollution emission contributes to more than 30% of the surface sulfate over an extended area in the North Pacific and North Indian Oceans and to between 10 and 30% over the Arctic, but to no more than 10% everywhere else, including North America. North America pollution exerts a strong
10
impact on the western North Atlantic but generates only a limited influence on other continents, even though North Africa and the Middle East seem to receive more North American pollution than other places do. In comparison, European pollution has the largest potential to affect fine particulate levels over other continents due to the shorter traveling distance to receptor continents and larger fraction of sulfate-producing
pre-15
cursor gas in the predominantly boundary layer outflow. While the European pollution exerts its largest influence over northern Africa, it can increase the surface ammonium sulfate concentration over eastern Asia by 0.2–0.5 µg m−3, an amount which is twice as high as the level of the Asian pollution impact we have found on western North America. Interestingly, the amount of the pollution ammonium sulfate Europe sends to
20
northern Africa is about the same as the amount of fine dust Africa sends to southern Europe (1–5 µg m−3) on an annual average.
Of the three major dust source regions, eastern Asia displays the greatest influence over North Pacific, North America, and the Arctic, whereas Africa dominates the entire North Atlantic, tropical Pacific, Central America, and tropical South America.
Consid-25
ering nearly 3 times lower emission rate (Table 1), Asian dust therefore has a larger “impact potential” than African dust to affect a wide geographic area. We have also found that the trans-Pacific transport of Asian dust is much more effective than that of Asian sulfate because of the higher plume elevation and lower loss of dust during
ACPD
7, 9013–9051, 2007
Intercontinental transport of aerosols
and air quality implications
Mian Chin et al.
Title Page Abstract Introduction Conclusions References Tables Figures ◭ ◮ ◭ ◮ Back Close
Full Screen / Esc
Printer-friendly Version Interactive Discussion
transport. We have noticed that even though the transport of African dust mostly takes place across the North Atlantic and Mediterranean regions, it can go eastward through a pathway spanning Asia and the Pacific to settle down over the surface of western North America. The smallest influential dust region is the Middle East, whose impacts are mostly sustained by its neighbors of the northern Indian Ocean, Eastern Europe,
5
and India, even though it can increase the fine dust over the Arctic surface by about 20%.
The scope of the intercontinental transport is controlled by several factors, the most important of which are emissions from the source regions, convective lifting of the aerosol and its precursors into the free troposphere, advection in both the free
tropo-10
sphere and boundary layer, wet and dry deposition during transport, and subsidence over the receptor regions. The relative importance of these factors varies significantly with time and space, although we have mostly focused on the surface- and time-averaged features in this paper. The time of the greatest impact of the long-range transport is spring, when horizontal transport rapidly spreads pollutants and dust over
15
an extended area in the Northern Hemisphere, including the Arctic.
The pollutant emission we used in this work is based on the “present day emission scenario” used in the IPCC 2001 Third Assessment Report (Penner et al., 2001). As economic growth and environmental regulations in the major industrial regions may have changed since then and will change in the future, pollutant emissions and
conse-20
quently the extent of their impacts for different time periods are expected to be different from the ones in this study. Dust and biomass burning emissions have considerable year-to-year variations; as such, the year of 2001 may not be a “typical” year to gen-eralize the impact. In addition, our model results need to be further evaluated with observations, especially in Asia and Arctic, but data in those areas are sparse or not
25
easily accessible. Lastly, results from other models may deviate from ours, as several intercomparison studies have shown considerable differences in aerosol composition and vertical distribution (Barrie et al., 2001; Penner et al., 2002; Textor et al., 2006). Nonetheless, our study should provide guidance not only for current regional air quality
ACPD
7, 9013–9051, 2007
Intercontinental transport of aerosols
and air quality implications
Mian Chin et al.
Title Page Abstract Introduction Conclusions References Tables Figures ◭ ◮ ◭ ◮ Back Close
Full Screen / Esc
Printer-friendly Version Interactive Discussion
management but also for projecting future intercontinental impacts.
Acknowledgements. This work is supported by NASA Atmospheric Composition Modeling and
Analysis Program and Radiation Sciences Program. The IMPROVE Program is gratefully ac-knowledged.
References
5
Anderson, T. L., Masonis, S. J., Covert, D. S., and Ahlquist, N. C.: Variability of aerosol optical properties derived from in situ aircraft measurements during ACE-Asia, J. Geophys. Res., 108(D23), 8647, doi:10.1029/2002JD003247, 2003.
Barrie, L. A., Yi, Y., Leaitch, W. R., Lohmann, U., Kasibhatla, P., Roelofs, G. J., Wilson, J., McGovern, F., Benkovitz, C., Melieres, M. A., Law, K., Prospero, J., Kritz, M., Bergmann,
10
D., Bridgeman, C., Chin, M., Christensen, J., Easter, R., Feichter, J., Land, C., Jeuken, A., Kjellstrom, E., Koch, D., and Rasch, P.: A comparison of large-scale atmospheric sulphate aerosol models (COSAM): overview and highlights, Tellus B, 53(5), 615–645, 2001.
Bertschi, I. T., Jaffe, D. A., Jaegle, L., Price, H. U., and Dennison, J. B.: PHOBEA/OTCT 2pp2 airborne observations of transpacific transport of ozone, CO, volatile organic compounds,
15
and aerosols to the northeast Pacific: Impacts of Asian anthropogenic and Siberian boreal fire emissions, J. Geophys. Res., 109, D23S12, doi:10.1029/2003JD004328, 2004.
Chin, M. and Jacob, D. J.: Anthropogenic and natural contributions to tropospheric sulfate: A global model analysis, J. Geophys. Res., 101, 18 691–18 699, 1996.
Chin, M., Rood, R. B., Lin, S.-J., M ¨uller, J.-F., and Thompson, A. M.: Atmospheric sulfur cycle
20
simulated in the global model GOCART: Model description and global properties, J. Geo-phys. Res., 105, 24 671–24 687, 2000a.
Chin, M., Savoie, D. L., Huebert, B. J., Bandy, A. R., Thornton, D. C., Bates, T. S., Quinn, P. K., Saltzman, E. S., and De Bruyn, W. J.: Atmospheric sulfur cycle in the global model GOCART: Comparison with field observations and regional budgets, J. Geophys. Res., 105,
25
24 689–24 712, 2000b.
Chin, M., Ginoux, P., Kinne, S., Torres, O., Holben, B. N., Duncan, B. N., Martin, R. V., Logan, J. A., Higurashi, A., and Nakajima, T.: Tropospheric aerosol optical thickness from the GO-CART model and comparisons with satellite and sunphotometer measurements, J. Atmos. Sci., 59, 461–483, 2002.
30
ACPD
7, 9013–9051, 2007
Intercontinental transport of aerosols
and air quality implications
Mian Chin et al.
Title Page Abstract Introduction Conclusions References Tables Figures ◭ ◮ ◭ ◮ Back Close
Full Screen / Esc
Printer-friendly Version Interactive Discussion
Chin, M., Ginoux, P., Lucchesi, R., Huebert, B., Weber, R., Anderson, T., Masonis, S., Blomquist, B., Bandy, A., and Thornton, D.: A global model forecast for the ACE-Asia field experiment, J. Geophys. Res., 108(D23), 8654, doi:10.1029/2003JD003642, 2003.
Chin, M., Chu, D. A., Levy, R., Remer, L., Kaufman, Y., Holben, B. N., Eck, T., and Ginoux, P.: Aerosol composition and distributions in the northern hemisphere during ACE-Asia:
Re-5
sults from global model, satellite observations, and surface sunphotometer measurements, J. Geophys. Res., 109, D23S90, doi:10.1029/2004JD004829, 2004.
Cooke, W. F., Liousse, C., Cachier, H., and Feichter, J.: Construction of a 1◦×1◦ fossil fuel emission data set for carbonaceous aerosol and implementation and radiative impact in the ECHAM-4 model, J. Geophys. Res., 104, 22 137–22 162, 1999.
10
Duncan, B. N. and Bey, I.: A modeling study of the export pathways of pollution from Eu-rope: Seasonal and interannual variations (1987–1997), J. Geophys. Res., 109, D08301, doi:10.1029/2003JD004079, 2004.
Ginoux, P., Chin, M., Tegen, I., Prospero, J., Holben, B., Dubovik, O., and Lin, S.-J.: Sources and distributions of dust aerosols simulated with the GOCART model, J. Geophys. Res., 106,
15
20 225–20 273, 2001.
Ginoux, P., Prospero, J., Torres, O., and Chin, M.: Long-term simulation of dust distribution with the GOCART model: Correlation with the North Atlantic Oscillation, Environ. Modeling and Software, 19, 113–128, 2004.
Guerova, G., Bey, I., Attl ´e, J.-L., Martin, R. V., Cui, J., and Sprenger, M.: Impact of transatlantic
20
transport episodes on summertime ozone in Europe, Atmos. Chem. Phys, 6, 2057–2072, 2006.
Heald, C. L., Jacob, D. J., Park, R. J., Alexander, B., Fairlie, T. D., Yantosca, R. M., and Chu, D. A.: Transpacific transport of Asian anthropogenic aerosols and its impact on surface air quality in the United States, J. Geophys. Res., 111, D14310, doi:10.1029/2005JD006847,
25
2006.
Husar, R. B., Tratt, D. M., Schichtel, B. A., Falke, S. R., Li, F., Jaffe, D., Gasso, S., Gill, T., Lanlainen, N. S., Lu, F., Reheis, M. C., Chun, Y., Westphal, D., Holben, B. N., Gueymard, C., McKendry, I., Kuring, N., Feldman, G. C., McClain, C., Frouin, R. J., Merrill, J., DuBois, D., Vignola, F., Murayama, T., Nickovic, S., Wilson, W. E., Sassen K., Sugimoto, N., and Malm,
30
W. C.: Asian dust events of April 1998, J. Geophys. Res., 18 317–18 330, 2001.
Intergovernmental Panel on Climate Change (IPCC), Climate Change 2001: The Scientific Basis, edited by: Houghton, J. T., Ding, Y., Nogua, M., et al., Cambridge University Press,
ACPD
7, 9013–9051, 2007
Intercontinental transport of aerosols
and air quality implications
Mian Chin et al.
Title Page Abstract Introduction Conclusions References Tables Figures ◭ ◮ ◭ ◮ Back Close
Full Screen / Esc
Printer-friendly Version Interactive Discussion
New York, 2001.
Jeffe, D., McKendry, I., Anderson, T., and Price, H.: Six “new” episodes of trans-Pacific transport of air pollutants, Atmos. Environ., 37(3), 391–401, 2003.
Koch, D. and Hansen, J.: Distant origins of Arctic black carbon: A Goddard Institute for Space Studies ModeE experiment, J. Geophys. Res., 110, D04204, doi:10.1029/2004JD005296,
5
2005.
Koch, D., Bond, T. C., Streets, D., Unger, N., and van der Werf, G. R.: Global impacts of aerosols from particular source regions and sectors, J. Geophys. Res., 112, D02205, doi:10.1029/2005JD007024, 2007.
Li, Q., Jacob, D. J., Bey, I., Yantosca, R. M., Field, B. D., Liu, H., Logan, J. A., Fiore, A. M.,
10
Martin, R. V., and Duncan, B. N.: Sources of ozone over the North Atlantic and transatlantic transport of pollution: A global model perspective, IGACtivities Newsl., 24, 12–17, 2001. Li, Q., Jacob, D. J., Bey, I., Palmer, P. I., Duncan, B. N., Field, B. D., Martin, R. V., Fiore, A. M.,
Yantosca, R. M., Parish, D. D., Simmonds, P. G., and Oltmans, R. M.: Transatlantic transport of pollution and its effects on surface ozone in Europe and North America, J. Geophys. Res.,
15
107(D13), 4166, doi:10.1029/2001JD001422, 2002.
Li, Q., Jacob, D. J., Park, R., Wang, Y. X., Heald, C. L., Hudman, R., Yantosca, R. M., Martin, R. V., and Evans, M. J.: North American pollution outflow and the trappin of convectively lifted pollution by upper-level anticyclone, J. Geophys. Res., 110, D10301, doi:10.1029/2004JD005039, 2005.
20
Malm, W. C., Sisler, J. F., Huffman, D., Eldred, R. A., and Cahill, T. A.: Spatial and seasonal trends in particle concentration and optical extinction in the United States, J. Geophys. Res., 99, 1347–1370, 1994.
Malm, W. C., Pitchford, M. L., Scruggs, M., Sisler, J. E., Ames, R., Copeland, S., Gebhart, K. A., and Day, D. E.: Spatial and seasonal patterns and temporal variability of haze and its
25
constituents in the United States, Rep. III, Coop. Inst. for Res., Colorado State University, Fort Collins, CO, 2000.
Malm, W. C., Day, D. E., Kreidenweis, S. M., Collett, J. L., and Lee, T.: Humidity-dependent op-tical properties of fine particles during the Big Bend Regional Aerosol Visibility Observational Study, J. Geophys. Res., 108(D9), 4279, doi:10.1029/2002JD002998, 2003.
30
McKendry, I. G., Stawbridge, K. B., O’Neill, N. T., Macdonald, A. M., Liu, P. S. K., Leaitch, R., Anlauf, K. G., Jaegle, L., Fairlie, T. D., and Wesphal, D. L.: Trans-Pacific transport of Saharan dust to western North America: A case study, J. Geophys. Res., 112, D01103,
ACPD
7, 9013–9051, 2007
Intercontinental transport of aerosols
and air quality implications
Mian Chin et al.
Title Page Abstract Introduction Conclusions References Tables Figures ◭ ◮ ◭ ◮ Back Close
Full Screen / Esc
Printer-friendly Version Interactive Discussion
doi:10.1029/2006JD007129, 2007.
Moulin, C., Lambert, C. E., Dulac, F., and Dayan, U.: Control of atmospheric export of dust from North Africa by the North Atlantic Oscillation, Nature, 387, 691-694, 1997.
Naki´cenovi´c, N., Alcamo, J., Davis, G., et al.: Emission Scenarios: A Special Report of Working Group III of the Intergovernmental Panel on Climate Change, 599 pp., Cambridge Univ.
5
Press, New York, 2000.
Ostro, B., Chestnut, L., Vichit-Vadakan, N., and Laixuthai, A.: The impact of particulate matter on daily mortality in Bangkok, Thailand, J. Air and Waste Mangement Assoc., 49, 100–107, 1999.
Ostro, B. D., Broadwin, R., and Lipsett, M. J.: Coarse and fine particles and daily mortality in
10
the Coachella Valley, California: a follow-up study, J. Exposure Analysis and Environmental Epidemiology, 10, 412–419, 2000.
Park, R. J., Jacob, D. J., Chin, M., and Martin, R. V.: Source of carbonaceous aerosols over the United States and implications for natural visibility, J. Geophys. Res., 108(D12), 4355, doi:10.1029/2002JD003190, 2003.
15
Park, R. J., Jacob, D. J., Field, B. D., Yantosca, R. M., and Chin, M.: Natural and transboundary pollution influences on sulfate-nitrate-ammonium aerosols in the United States: Implications for policy, J. Geophys. Res., 109, D15204, doi:10.1029/2003JD004473, 2004.
Penner, J. E., Andreae, M., Annegarn, H., Barrie, L., Feichter, J., Hegg, D., Jayaraman, A., Leaitch, R., Murphy, D., Nganga, J., Pitari, G., et al.: Aerosols, their direct and indirect
20
effects, in: Intergovernmental Panel on Climate Change (IPCC), Climate Change 2001. The Scientific Basis, Chapter 5, edited by: Houghton, J. T., Ding, Y., Nogua, M., et al., Cambridge University Press, New York, 2001.
Penner, J. E., Zhang, S. Y., Chin, M., Chuang, C. C., Feichter, J. Feng, Y., Geogdzhayev, I. V., Ginoux, P., Herzog, M., Higurashi, A., Koch, D., Land, C., Lohmann, U., Mishchenko, M.,
25
Nakajima, T., Pitari, G., Soden, B., Tegen I., and Stowe, L.: A comparison of model- and satellite-derived aerosol optical depth and reflectivity, J. Atmos. Sci., 59(3), 441–460, 2002. Pope III, C. A., Burnett, R. T., Thun, M. J., Calle, E. E., Krewski, D., Ito, K., and Thurston, G.
D.: Lung cancer, cardiopulmonary mortality and long-term exposure to fine particulate air pollution, J. Am. Med. Assoc., 287, 1132–1141, 2002.
30
Prospero, J. M.: The atmospheric transport of particles to the ocean, in: Particle Flux in the Ocean, pp. 19-52, edited by: Ittekkot, V., Sch ¨afer, P., Honjo, S., and Depetris, Wiley, New York, 1996.
ACPD
7, 9013–9051, 2007
Intercontinental transport of aerosols
and air quality implications
Mian Chin et al.
Title Page Abstract Introduction Conclusions References Tables Figures ◭ ◮ ◭ ◮ Back Close
Full Screen / Esc
Printer-friendly Version Interactive Discussion
Shaw, G. E.: The Arctic haze phenomenon, Bull. Amer. Meteorol. Soc., 76, 2403–2413, 1995. Stohl, A. and Trickl, T.: A 1-year Lagrangian “climatology” of airstreams in the Northern
Hemi-sphere tropoHemi-sphere and lowermost stratoHemi-sphere, J. Geophys. Res., 106, 30 445–30 462, 1999.
Stohl, A., Eckhardt, S., Forster, C., James, P., and Spichtinger, N.: On the pathways and
5
timescales on intercontinental air pollution transport, J. Geosphys. Res., 107(D23), 4684, doi:10.1029/2001JD001396, 2002.
Stone, R., Anderson, G., Andrews, E., Dutton, E., Harris, J., Shettle, E., Berk, A., et al.: Asian dust signatures at Barrow: observed and simulated. Incursions and impact of Asian dust over Northern Alaska, Workshop on Remote Sensing of Atmospheric Aerosols, IEEE Conference
10
Proceedings, pp. 74–79, doi:10.1109/AERSOL.2005.1494152, 2005.
Taylor, K. E.: Summarizing multiple aspects of model performance in a single diagram, J. Geophys. Res., 106, 7183–7192, 2001.
Textor, C., Schulz, M., Guibert, S., Kinne, S., et al.: Analysis and quantification of the diversities of aerosol life cycles within AeroCom, Atmos. Chem. Phys., 6, 1777–1813, 2006,
15
http://www.atmos-chem-phys.net/6/1777/2006/.
van der Werf, G. R., Randerson, J. G., Collatz, G. J., and Giglio, L.: Carbon emissions from fires in tropical and subtropical ecosystems, Global Change Biology, 9, 547–562, 2003. Wild, O. and Akimoto, H.: Intercontinental transport of ozone and its precursors in a
three-dimensional global CTM, J. Geophys. Res., 106, 27 729–27 744, 2001.
20
World Health Organization: NIS Environment Strategy Background paper “Pollution Previention and Control”, WHO Regional Office for Europe, 2002.
Yevich, R. and Logan, J. A.: An assessment of biofuel use and burning of agri-culture waste in the developing world, Global Giogeochem. Cycles, 17(4), 1905, doi:10.1029/2002GB001952, 2003.
25
ACPD
7, 9013–9051, 2007
Intercontinental transport of aerosols
and air quality implications
Mian Chin et al.
Title Page Abstract Introduction Conclusions References Tables Figures ◭ ◮ ◭ ◮ Back Close
Full Screen / Esc
Printer-friendly Version Interactive Discussion
Table 1. Annual emissions of aerosols and precursors in this study.
Sulfur (TgS yr−1)aTotal 90.7 Pollution 64.9 Asia 26.3 Europe 17.3 North America 12.3 Other 9.0 Biomass burning 3.5 Natural 22.3 Ocean 13.6 Volcano 8.7 OC (TgC yr−1) Total 82.3 Pollution 19.6 Asia 9.4 Europe 6.1 North America 1.0 Other 3.1 Biomass burning 50.0 Naturalb 12.7 BC (TgC yr−1) Total 14.1 Pollution 7.8 Asia 3.6 Europe 2.5 North America 0.7 Other 1.0 Biomass burning 6.3 Dust (Tg yr−1)cTotal 2773 Asia 566 Middle East 443 Northern Africa 1609 Other 155 Sea-salt (Tg yr−1)cTotal 9838 a
Sulfur source includes SO2(∼97%) and sulfate (∼3%) from industrial and transportation emis-sions, dimethyl sulfide (DMS) from ocean, SO2from biomass burning and volcanoes.
b
Natural OC is from terpene oxidation.
c
ACPD
7, 9013–9051, 2007
Intercontinental transport of aerosols
and air quality implications
Mian Chin et al.
Title Page Abstract Introduction Conclusions References Tables Figures ◭ ◮ ◭ ◮ Back Close
Full Screen / Esc
Printer-friendly Version Interactive Discussion
Table 2. Statistics between the model-calculated and IMPROVE measured monthly mean
concentrations of aerosol species at 142 IMPROVE sites over the U.S.
R B S Sulfate 0.815 1.154 0.879 BC 0.519 0.884 0.680 OC 0.454 0.568 0.721 Fine dust 0.577 1.747 0.687 RCFM 0.742 0.940 0.870
R=correlation coefficient; B=relative bias; S=Skill score computed from standard deviations and correlation coefficient (Taylor, 2001; also see Chin et al., 2003, 2004).
ACPD
7, 9013–9051, 2007
Intercontinental transport of aerosols
and air quality implications
Mian Chin et al.
Title Page Abstract Introduction Conclusions References Tables Figures ◭ ◮ ◭ ◮ Back Close
Full Screen / Esc
Printer-friendly Version Interactive Discussion
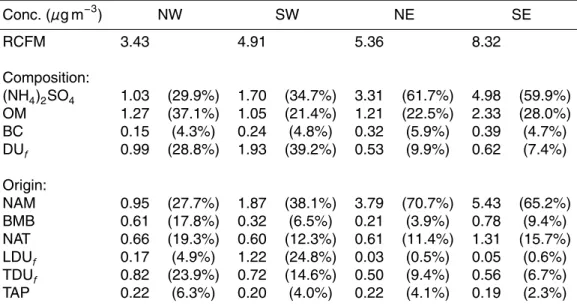
Table 3. Model-calculated annual averaged concentrations of RCFM and its composition and
origins for the four quadrants in the U.S.
Conc. (µg m−3) NW SW NE SE RCFM 3.43 4.91 5.36 8.32 Composition: (NH4)2SO4 1.03 (29.9%) 1.70 (34.7%) 3.31 (61.7%) 4.98 (59.9%) OM 1.27 (37.1%) 1.05 (21.4%) 1.21 (22.5%) 2.33 (28.0%) BC 0.15 (4.3%) 0.24 (4.8%) 0.32 (5.9%) 0.39 (4.7%) DUf 0.99 (28.8%) 1.93 (39.2%) 0.53 (9.9%) 0.62 (7.4%) Origin: NAM 0.95 (27.7%) 1.87 (38.1%) 3.79 (70.7%) 5.43 (65.2%) BMB 0.61 (17.8%) 0.32 (6.5%) 0.21 (3.9%) 0.78 (9.4%) NAT 0.66 (19.3%) 0.60 (12.3%) 0.61 (11.4%) 1.31 (15.7%) LDUf 0.17 (4.9%) 1.22 (24.8%) 0.03 (0.5%) 0.05 (0.6%) TDUf 0.82 (23.9%) 0.72 (14.6%) 0.50 (9.4%) 0.56 (6.7%) TAP 0.22 (6.3%) 0.20 (4.0%) 0.22 (4.1%) 0.19 (2.3%) NAM=North America pollution; BMB=Biomass burning; NAT=Natural sources (biogenic and volcanic); DUf=fine dust (d<2.5 µm); LDUf=fine dust from local source; TDUf,=fine dust from
intercontinental transport; and TAP=pollution aerosol from intercontinental transport. Total “background” is the amount of aerosols not from North America pollution source (RCFM–NAM), total “transport” aerosol is the sum of TDUf and TAP, total pollution aerosol is the sum of NAM
ACPD
7, 9013–9051, 2007
Intercontinental transport of aerosols
and air quality implications
Mian Chin et al.
Title Page Abstract Introduction Conclusions References Tables Figures ◭ ◮ ◭ ◮ Back Close
Full Screen / Esc
Printer-friendly Version Interactive Discussion
Table 4. Comparison of model-calculated annual-average ammonium sulfate concentration
(µg m−3) over the western and eastern U.S. from this study and Park et al. (2004). Park et al. (2004) This study
Concentration (µg m−3) Western U.S. Eastern U.S. NW/SW U.S. NE/SE U.S. Total Concentration 1.52 4.11 1.03/1.70 3.31/4.98 Background1 0.28 0.24 0.29/0.30 0.25/0.26 From Asia 0.13 0.12 0.12/0.11 0.07/0.08 From Europe2 ≤0.04 ≤0.01 0.06/0.05 0.08/0.06
1
The background value in this study is defined as the amount of ammonium sulfate from non-North American pollution sources, which is equivalent to the values of “background from non-U.S. anthropogenic emission” minus the transboundary transport from Canada and Mexico to the U.S. in Park et al. (2004) (western: 0.43–0.15=0.28 µg m−3, eastern: 0.38– 0.14=0.24 µg m−3).
2
Although the amount from Europe is not explicitly listed in Park et al. (2004), the difference between “Transboundary transport” and “Natural” in Table 2 of Park et al. (2004) implies the maximum amount of ammonium sulfate transported from Europe (R. Park, personal communi-cation).