HAL Id: hal-00091016
https://hal-insu.archives-ouvertes.fr/hal-00091016
Submitted on 6 Nov 2006
HAL is a multi-disciplinary open access
archive for the deposit and dissemination of sci-entific research documents, whether they are pub-lished or not. The documents may come from teaching and research institutions in France or abroad, or from public or private research centers.
L’archive ouverte pluridisciplinaire HAL, est destinée au dépôt et à la diffusion de documents scientifiques de niveau recherche, publiés ou non, émanant des établissements d’enseignement et de recherche français ou étrangers, des laboratoires publics ou privés.
Experimental and model constraints on degassing of
magma during ascent and eruption.
James E. Gardner, Alain Burgisser, Matthias Hort, Malcolm Rutherford
To cite this version:
James E. Gardner, Alain Burgisser, Matthias Hort, Malcolm Rutherford. Experimental and model constraints on degassing of magma during ascent and eruption.. Geological Society of America Bul-letin, Geological Society of America, 2006, 402, pp.99-114. �hal-00091016�
Experimental and model constraints on degassing of magma
during ascent and eruption
James E. Gardner1
Department of Geological Sciences, Jackson School of Geosciences, The University of Texas at Austin, Austin, TX 78712, U.S.A.
Alain Burgisser
Institut des Sciences de la Terre d'Orleans, 45071 Orleans, France
Matthias Hort
Institut für Geophysik, Universität Hamburg, 20146 Hamburg, Germany
Malcolm Rutherford
Department of Geological Sciences, Brown University, Providence, RI, 02912, U.S.A.
ABSTRACT
Surface volcanic gases may reflect volatile budgets of magma and forecast impending eruptions, and their release to the atmosphere may affect climate. The dynamics of magma degassing is complicated, however, by differences in the solubility, partitioning, and diffusion of the various volatiles, all of which can vary with pressure, temperature, and melt composition. To constrain possible gas outputs, we carried out experiments to determine how Cl partitions between water bubbles and silicate melt, and decompression experiments to examine how Cl behaves during closed- and open-system degassing. We incorporate our findings and those from the literature for CO2 and S into a steady, isothermal, and homogeneous flow model to estimate fluxes of gases at the vent from ascending water-rich magma, assuming different scenarios for the onset and development of permeability in bubbly magma. We find that, for given permeability scenarios, total gas fluxes vary with magma flux, but ratios of gas species do not change. The S/Cl and SO2/CO2 ratios do change, however, depending on whether the magma is oxidized or reduced. After magma fragments into a Plinian eruption column gases continue to escape from cooling pumice in the plume, but here the rate of gas release is controlled by diffusion, which varies with temperature. Degassing of pumice and ash was modeled by linking a steady-state plume model, which gives the vertical variation of mean temperature and velocity of particles inside the plume, to a conductive cooling model of pumices, which controls diffusion of Cl, CO2, and S in pumice. We find that gas loss increases with column height (mass flux) and initial temperature, because in both cases pumices cool over a longer time period, allowing more gas to diffuse out of the matrix glass. The amount of gas released also depends on the size distribution of particles in the erupting mixture, with less being released for a finely skewed distribution.
INTRODUCTION
Volcanic gases released from volcanoes are the only direct measurements of degassing magma, and have been used to infer the abundances of volatiles dissolved in magmas as well as the dynamics of magma degassing (e.g., Greenland et al., 1985; Symonds et al., 1994; Harris and Rose, 1996). In some cases, gas emissions have been correlated with eruptive activity and may even forecast eruptive events (e.g., Malinconico, 1979; McGee and Sutton, 1994; Duffell et al., 2003). Many studies assume that surface gas samples represent the volatile budget of the magma at depth (see summary in Symonds et al., 1994), but degassing can be complicated because volatiles have different solubilities and vapor-melt partitioning and diffuse at different rates, all of which vary with temperature, pressure, and composition of melt and vapor. Such variations need to be understood in order to relate surface measurements to magma dynamics. For example, if the ratios of gas abundances change with time, does that reflect a variation in volatile abundances at depth or changing partition coefficients of gas species in rising magma?
Another problem in the study of volcanic gases is determining the amounts of volatiles released to the atmosphere in volcanic eruptions, because the different volatile species can have important impacts of climate (e.g., Pang, 1991; McCormick et al., 1995). Volcanic sulfur can convert into sulfuric aerosols, which block heat from the sun; chlorine can react with ozone, which depletes the atmosphere of UV-blocking ozone; and carbon dioxide can act as a greenhouse gas, which can add to global warming (Rampino et al., 1988). How much of these gases were released in prehistoric eruptions and what impact did they have on climatic shifts measured in ice cores and deep-sea sediment cores are crucial questions to address, but to do so we need to understand how gases are released during explosive eruptions.
Here, we examine possible gas fluxes that might be expected from ascending and erupting magma. We first use experiments to constrain the partitioning of Cl between water and silicate melt to determine how Cl degassing should behave during magma ascent. These data compliment the extensive dataset already available for Cl from Webster (1992, 1997) and similar data available for
sulfur (Scaillet et al., 1998). We also carried out decompression experiments that mimic both closed-system and open-system degassing in order to examine the behavior of Cl during magma rise. We then use our Cl partition coefficients, and those of sulfur from Scaillet et al. (1998), to model gas fluxes from ascending magma. A critical factor of the modeling is the way in which the rising bubbly magma becomes permeable, and we find that the amount and composition of gas released depends strongly on the assumed development of permeability. To estimate the amount of gas released from pumice and ash as it cools in Plinian eruption columns we use a coupled eruption and pumice cooling model (Hort and Gardner, 2000). In this case, the main influence is the thermal history of tephra, which controls the diffusive loss of gas from vesicular pumice. A critical finding is that cooling rate increases as particle size decreases, and thus the amounts of gases released depend on the size distribution of particles in the erupting mixture. Eruptions that fragment into greater amounts of ash will release lesser amounts of gas than more coarsely fragmented magma. There are, of course, assumptions and limitations to our modeling, and so our findings should be viewed as guides for further experimental work, modeling, and observations.
EXPERIMENTAL AND ANALYTICAL METHODS
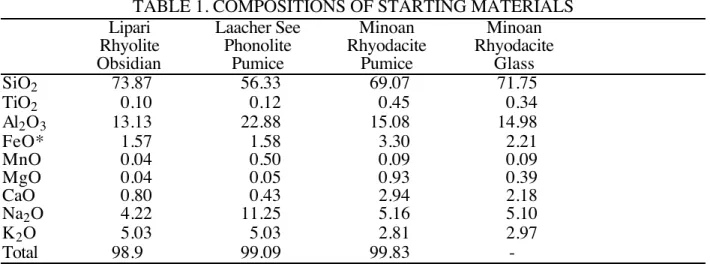
Experiments were carried out to investigate the partitioning and degassing behavior of Cl in silicate melts. Experiments that focused on determining the partition coefficient of Cl between melt and water used Lipari obsidian (Table 1), which consists of clear rhyolite glass and <1 vol.% microlites of plagioclase and Fe-Ti oxide. Decompression experiments used either Laacher See phonolite tephra or Minoan rhyodacitic tephra (Table 1). The phonolite (LST 3-1-40) is a sample from ~13 ka eruption of Laacher See, and consists of highly differentiated phonolitic glass and about 1 vol.% phenocrysts of sanidine, amphibole, magnetite, and clinopyroxene (Harms et al., 2004). The rhyodacite (S-814) used is a sample collected from the Plinian fall layer of the Minoan deposit (Cottrell et al., 1999).
Experimental run conditions are listed in Table 2. All partiotion experiments consisted of 30 to 50 mg of sample powder and de-ionized water weighed into a 3-mm-diameter Ag7 0Pd3 0 tube,
which was welded shut at one end with an oxy-acetylene torch. Enough water was added to ensure that excess vapor was present. The open end of the capsule was then welded shut. Capsules were weighed before and after welding to verify that no water was lost. After welding, the capsules were also heated on a hotplate for ~10 minutes to ensure that no leaks occurred. In the case of the 1050° C experiments, the sealed 3-mm-diameter tube was inserted into a 5-mm-diameter Ag7 0Pd3 0 tube,
which was then partially filled with Ni metal, NiO powder, and water, and then welded shut. In the case of the decompression experiments, some also contained NaCl powder, which was added into the 3-mm-diameter tube, along with the sample powder and de-ionized water.
Cl Partition Experiments
Experiments run at 850° C were performed in the experimental laboratories at Brown University and University of Alaska Fairbanks (UAF), using René-style cold-seal pressure vessels with Ni filler rods and water as the pressurizing fluid. Temperature was measured in the sample position with a sheathed chromal-Alumel thermocouple, considered precise to ±5° C. Pressure was recorded with a pressure transducer, considered accurate to ±1 MPa. Experiments run at 1050° C were performed at Brown University, using DelTech vertical furnaces and TZM-alloy pressure vessels. Temperature was measured with a sheathed Pt-Pt9 0Rh1 0 thermocouple, considered precise
to ±5° C. Argon was used as the pressurizing fluid and pressure was recorded with a factory-calibrated Heise gauge, considered precise to ±1 MPa. All experiments were quenched rapidly by immersing the pressure vessels into a bucket of water to prevent melt-vapor exchange of Cl during quench. We estimate that the sample quenched in about one minute. Pressure was maintained during quench by use of a large volume pressure reservoir (Brown) or a hand-cranked pressure intensifier (UAF).
The combination of the Ni alloy pressure vessel, Ni filler rod, and water is believed to have buffered oxygen fugacity in the low temperature experiments to 1 (±0.5) log unit above the Ni-NiO (NNO) oxygen buffer (Gardner et al., 1995). In order to control oxygen fugacity in the high temperature experiments, 0.1-0.5 MPa of CH4 was added to the Ar pressurizing fluid. The
presence of both Ni metal and NiO powder in the large capsule after quenching demonstrates that oxygen fugacity was maintained at ~NNO.
Decompression Experiments
Decompression experiments consisted of aliquots from a previously run experiments weighed into a 4-mm-diameter Ag7 0Pd3 0 tube and then the open end of the capsule was welded shut. The
decompression samples were run in René-style cold-seal pressure vessels (as above), initially at their previous final pressure for 2.5 hours. Pressure was then decreased (over 5-10 seconds) to a new, lower pressure where the sample was held for 0.5 to 4 hours and then quenched (Table 2). In one series of experiments, the starting material consisted of phonolite melt that was previously equilibrated with water and NaCl powder. Salt crystals were present within fluid bubbles in contact with the phonolite melt, demonstrating that the melt was saturated with Cl. Decompression experiments consisted of this Cl-saturated phonolite plus added water (no NaCl was added). During decompression an extra vapor phase was thus always present. The three starting materials and one additional run give the solubility of Cl in phonolite melt at the run conditions (Table 2). Cl contents in glasses of the starting materials and in decompression experiments using those material are listed in Table 3.
In two other series of decompression experiments, the starting material consisted of Minoan rhyodacite (Table 2). In one series, NaCl was added to the initial material, although not enough to saturate the melt with Cl. In the other series, no NaCl was added to the starting material before it was equilibrated with water at 850°C and 150 MPa. In the decompression runs, starting material
thus consisted of rhyodacite that contained fluid bubbles, but those bubbles do not contain salt crystals. No water or NaCl was added to the charge before decompression.
Chlorine in experimental glasses was analyzed using either the Cameca Camebax electron microprobe at Brown University or the Cameca SX-50 electron microprobe at UAF. In all cases, the analytical conditions used were 15 kV accelerating voltage, 30 nA beam current, and a focused beam, and a scapolite was used as the Cl standard. Chlorine in KE-12, a pantellerite glass, was measured repeatedly during each session in order to monitor precision and maintain consistency among results between microprobes. Repeated analysis of KE-12 suggests that precision on individual measurements is ±3%.
EXPERIMENTAL RESULTS
Both Lipari rhyolite and Laacher See phonolite are superliquidus at our experimental conditions, and thus all crystals in the starting materials dissolved during the experiments. Even in shorter duration experiments, all crystals dissolved and glasses are homogenous in composition, indicating that dissolution was rapid and did not influence the final results. In addition, the super-liquidus conditions assured that no crystals formed during the decompression experiments. The Minoan rhyodacite starting material was hydrated at sub-liquidus conditions (Cottrell et al., 1999), and contains a few volume percent of plagioclase, clinopyroxene, orthopyroxene, and Fe-Ti oxides. The melt at those conditions is rhyodacitic (Table 1). Crystal content did not change during the decompressions, and so the melt composition did not evolve. In the series in which some NaCl was added initially, the rhyodacitic melt contains 4604±150 ppm Cl. Where no salt was added, the chlorine content of the hydrated rhyodacitic melt is 2282±90 (Table 3).
Partition experiments were conducted at pressures from 30 to 150 MPa (Table 4). Chlorine initially present in the rhyolite glass partitioned between melt and vapor. The initial Cl content in the rhyolite is 3544 (±90) ppm and homogenous. Cl partition coefficients – the ratio of Cl concentration in the vapor to that in the melt – were calculated by mass balance, assuming water solubility values in the rhyolite from Gardner et al. (1999). In all experiments, the amount of water added was enough so that the mole fraction of water in the excess fluid was >0.99, ensuring that the solubility of water in the silicate melt was unaffected by the presence of Cl in the fluid (Webster, 1992, 1997). Error propagation suggests that Cl partition coefficients ( KdCl) are known to ±1.
Cl partitioning between silicate melt and water varies as a result of many parameters, including melt and fluid composition, temperature, and pressure (e.g., Carroll and Webster, 1994). Our experiments used the same starting materials (rhyolite + water) and were run with an excess fluid that was essentially water (>99% water by molar mass), and so they allow us to investigate the influence of total fluid mass, temperature, and pressure. Most partitioning experiments run at 850° C contained 3.5-6.5 wt.% of excess water, a small spread compared to those at 1050° C (Table 4).
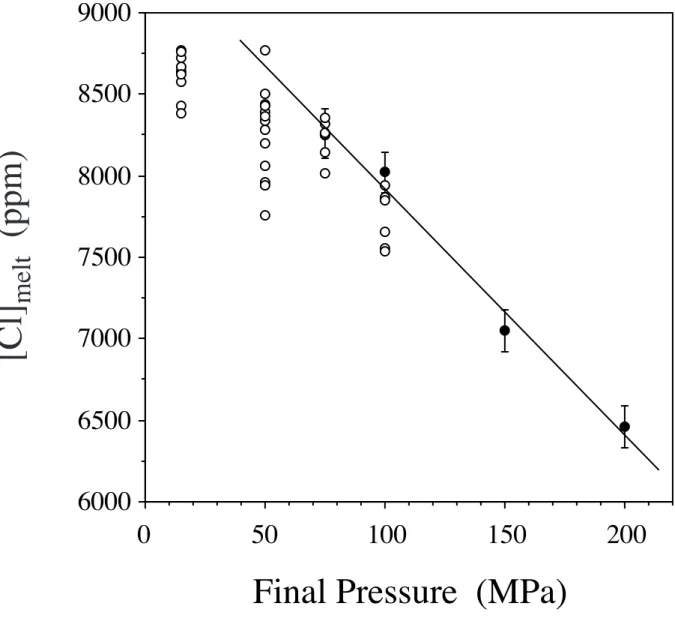
KdCl increases significantly with water pressure, from ~2 at 30 MPa to ~8 at 150 MPa (Figure 1). That increase is consistent with Cl partitioning experiments of Webster and Holloway (1988). A decrease in KdCl with pressure at constant weight percent of excess water is also seen in the 1050° C data (Figure 2). Partitioning experiments at 1050° C were run with various weight fractions of excess water relatively to melt (Table 4). We find that KdCl decreases from ~7-9 at small amounts of excess water to ~2-4 at large amounts (Figure 2). One experiment at 850° C and 100 MPa contained much less excess water compared to other experiments, and its KdCl value is greater than would be estimated from the other experiments, supporting the results of the higher temperature experiments. Considering that KdCl changes with amount of excess water at constant temperature and pressure, the behavior of Cl may be non-Henryian, such that NaCl and H2O are interacting, most likely in the fluid phase.
Decompression Experiments
Seven rhyodacite melts were decompressed and held at lower pressures before quenching (Table 2). When the final pressure was greater than 70 MPa, the melts generally contain as much or more Cl than in the starting materials (Figure 3). Greater Cl contents are especially prevalent in rhyodacite melt that originally had added Cl (G-106 in Table 2). The greater Cl contents at lower pressure resulted from Cl in the original fluid diffusing into the melt at lower pressure. Note that this transfer occurred even in the runs that did not contain added salt before decompression, although not nearly as much.
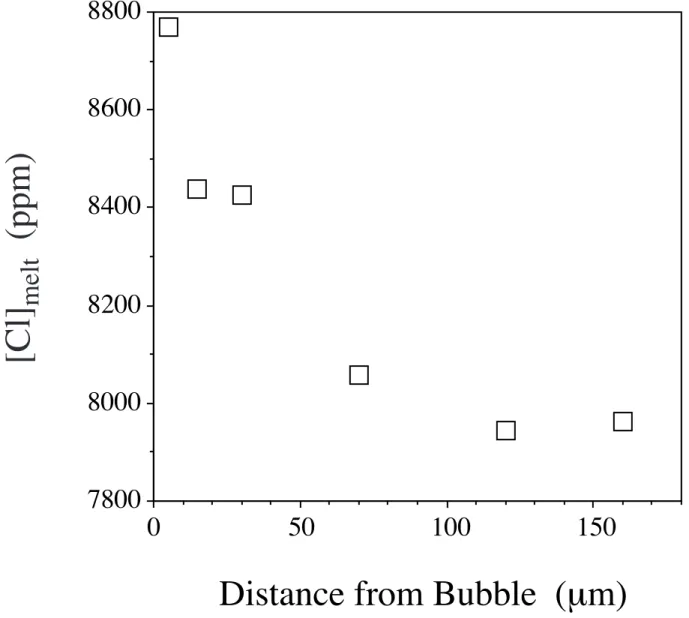
The transfer of Cl from the fluid to the silicate melt is confirmed by the five experiments that were performed in which previously Cl-saturated phonolite melts were decompressed and held at lower pressures before quenching (Table 2). Water bubbles increased in size, compared to those at high pressure, as is expected from water solubility, but no salt crystals are present in the lower pressure bubbles, whereas there were some in the starting material. In addition, glasses at low pressures contain much more Cl than those at the original pressure (Figure 4). In fact, the Cl contents in the decompressed samples approach those expected for solubility of Cl. These results indicate that the chloride melt previously in equilibrium with phonolite melt at high pressure partially dissolved into the phonolite at lower pressure. This is confirmed by compositional gradients in the glass in which Cl concentration decreases with distance away from bubbles (Figure 5). It should be noted that these runs do not imply that phonolite melts are typically saturated with chloride, they only show that (in addition to the rhyodacite melt runs) Cl will diffuse into silicate melt as pressure decreases.
In contrast to the relatively higher pressure experiments, when rhyodacite melts were decompressed to pressures lower than 70 MPa, melts generally contain much less Cl than those at higher pressures (Figure 3). The products of these lower pressure runs also have more distorted and elongated bubbles, as opposed to the smaller rounded ones at higher pressures. Burgisser and Gardner (2004) demonstrated that such a change in texture results when bubbly melt becomes
permeable at elevated pressures. Fluid escapes to the exterior of the melt when permeability occurs and the foam partially collapses. This permeable loss of fluid results in experiments when there is no fluid surrounding the melt. When extra fluid is added to the charge before decompression, then the melt contains bubbles but is also surrounded inside the capsule with fluid. Hence, although that bubbly foam can still become permeable, fluid cannot escape from the melt and the foam cannot collapse (Burgisser and Gardner, 2004). In our runs, the rhyodacite charges did not contain an added fluid, and so collapse could occur. The phonolite decompressions, in contrast, had extra water added, and hence a similar loss of fluid was not found in those runs (Figure 4). Importantly, our results show that when water escapes from the bubbly melt it removes Cl with it, and thus relatively depletes the melt in Cl (Figure 3).
Our decompression experiments demonstrate competing behaviors for Cl during magma ascent. First, because
†
KdCl decreases with lower pressure, then Cl will diffuse from the fluid into the melt as pressure decreases. Along with that influence is the decreased
†
KdCl as the amount of fluid increases. Hence, as pressure decreases and water exsolves from the melt, even more Cl will partition into the melt. In contrast, when fluid can escape as the bubbly melt becomes permeable, the melt is depleted in Cl, overwhelming the effect of decreasing
†
KdCl that occurs as a result of decreasing pressure.
MODELLING OF MAGMA DEGASSING
Our decompression experiments demonstrate the complicated behavior that can be expected of gases when water degassing occurs. To a first order, we found that when bubble-bearing melts are not permeable, the Cl content of the melt increases as pressure decreases, regardless of whether the melt is initially saturated or under-saturated in Cl. That behavior is expected given that KdCl decreases as pressure decreases (Figure 1). We also found that as the amount of excess water fluid increases, KdCl decreases. Pre-eruptive gas contents of magmas are often ~1-6 wt.% (Wallace,
2001). Hence, the storage pressure and initial content of excess gas (along with temperature and melt composition) will dictate the initial KdCl of the magma. As magma decompresses, exsolution will increase that gas content by ~3-5 wt.% (Johnson et al., 1994), which will act to lower KdCl in concert with the decreasing KdCl as pressure decreases. Thus, regardless of initial gas content, lowering pressure will decrease KdCl, and at least some of the Cl in the fluid at higher pressure will dissolve back into the melt at lower pressure, with the total amount of additional solution limited by Cl solubility in the melt (Figure 4). Chlorine solubility increases with lower pressure for many melt compositions (Webster, 1992; Metrich and Rutherford, 1992; Carroll and Webster, 1994).
When bubbly melt becomes permeable, and fluid is able to escape, the fluid takes Cl with it, and Cl is lost from the melt as more water exsolves (Figure 3). The difference between closed- and open-system degassing of magma is that Cl can potentially migrate from bubbles to melt when the magma is closed, whereas when the system is open Cl in the water is lost from the magma. The amount of Cl lost will be dictated by
†
KdCl, given enough time for diffusion.
The behaviors of sulfur and carbon dioxide during decompression induced degassing are likely to differ from Cl, because their partitioning behavior is different. Both appear to decrease with decreasing pressure in a magma saturated with an aqueous fluid (e.g., Holloway and Blank, 1994; Carroll and Webster, 1994). In addition, sulfur behavior is a strong function of oxygen fugacity, such that melt-fluid partitioning is close to 1 at low values of ƒO2, but is strongly in favor of the fluid phase at values of ƒO2 more oxidized than the Ni-NiO oxygen buffer (Scaillet et al 1998).
Below we model degassing during magma ascent and eruption to constrain the likely behaviors of gases and the potential fluxes of gases. During magma ascent in the conduit, the partitioning of CO2, S, and Cl between water and melt will control their degassing, depending on whether the bubbly melt is permeable. During explosive eruptions, pumice and ash continues to degas after conduit flow while they the cool in the eruption column (Hort and Gardner, 2000). We explore this continued degassing, which is controlled by diffusion rather than partitioning.
Degassing During Magma Ascent in the Conduit
Bubble formation and degassing of magma are driven by saturation of an H2O-CO2 fluid phase. The behavior of other volatiles will then be dictated by their partitioning into water fluid, which can escape to the surface when the magma becomes permeable. We estimate gas outputs that could be expected at the surface by assuming various scenarios for the onset and behavior of permeable foam, in both effusive and explosive eruptions. For CO2, we considered that CO2 solubility is a minimum to the amount of gas exsolved. We used results from the solubility of a two-component H2O-CO2 fluid (Papale, 1999), with only 2% of total CO2, so that the behavior of the degassing mixture remains similar to that of a pure H2O fluid (Papale and Polacci, 1999). For Cl, as a first-order approach, we neglect the change in
†
KdCl as a function of mass of fluid, because too little is known how this varies. We thus assume that KdCl varies smoothly as a function of pressure (P in MPa), such that KdCl = 3x10⁻⁴ P2 + 7.3x10⁻³ P + 2 (Figure 1). Error on our K
dCl fit
is ±0.58 (1 s). That error translates into an uncertainty on the Cl mass flux of less than 5% at depth and up to 25% at shallow level. For S, we assume that
†
KdS = 1 for reduced magma or
†
KdS = 1000 for oxidized magma (Scaillet et al., 1998).
Our decompression experiments illustrate the importance of permeability on magma degassing. Exactly how magma becomes permeable is still debated. Some studies suggest that wide-scale permeability occurs when porosity reaches a porosity threshold (Eichelberger et al., 1986; Westrich and Eichelberger, 1994; Blower, 2001; Burgisser and Gardner, 2004). Most recently, Burgisser and Gardner (2004) found a threshold at ~40 vol.%. In addition, Burgisser and Gardner (2004) found that the onset of permeability is not instantaneous, but takes on order of 180 seconds when high-silica rhyolite reaches that threshold. Those 180 seconds likely represent the amount of time required for complete networks of bubbles to connect. They also found that when permeable foam is still at relatively high pressure when it reaches its threshold value it collapses as the gas escapes and seals itself at a lower porosity. In contrast, permeability is thought to be a continuous function
of porosity, and hence gas can escape at all values of porosity (Klug and Cashman, 1996; Klug et al. 2002). To explore degassing of ascending permeable magma, we simulated four scenarios that explore the above ideas about permeability development. In Scenario 1, magma becomes permeable at 40 vol.% and leaks down to 0 vol.% in 180 s. In Scenario 2, magma becomes permeable at 40 vol.% but loses only 10 vol.% in 180 s before permeability is sealed. Scenario 3 allows magma to become permeable at 40 vol.%, and from that porosity onward it leaks all additionally exsolved gases. Finally, Scenario 4 assumes magma is perfectly permeable beginning with bubble nucleation, and leaks all exsolved gases. The first scenario is the most restrictive because magma is permeable only for a short time, whereas in the fourth scenario all gas escapes freely from the magma.
Two types of volcanic activity are considered: effusive, in which magma reaches the surface without fragmenting, and explosive, in which magma fragments at depth, producing a Plinian eruption. We varied magma flux from ~52 kg/s (magma reaches the surface effusively in 3 weeks through a 3.2-m-wide conduit) to ~108 kg/s (magma reaches the vent explosively in 20 minutes
through a 136-m-wide conduit). The transition between effusive and explosive activity depends on the degassing scenario assumed, but is on the order of 107 kg/s. In all cases, water-saturated,
crystal-free, high silica rhyolite at 825 °C starts at 5 km at a lithostatic load at 150 MPa and has a melt density of 2140 kg/m3. Initially the melt contains 2000 ppm of chlorine and 200 ppm of
sulfur.
Magma ascent is modeled using the one-dimensional model of Burgisser and Gardner (2004). The model assumes steady, isothermal, and homogeneous flow (no net flow between bubbles and melt) in a vertical cylindrical conduit, in which the momentum equation is solved along the conduit as magma rises, allowing viscosity to vary. We modified the friction coefficient from the original model to include the effects of bubbles by adding the coefficient (1-a)-2.5, where a is the bubble
volume fraction. As the model does not simulate post-fragmentation flow, the boundary condition is that magma reaches a pressure close to atmospheric at the vent (<10 MPa). At each step, the model determines whether the magma is permeable, in which case it calculates how much porosity
is lost by foam collapse. Flow velocity is modulated by the changes in density and viscosity that occur from foam collapse. All gas lost during collapse is assumed to leak into the conduit and escape to the surface, separate from the magma, without interacting with its environment (neglecting any shallow hydrothermal system). The model then calculates the weight percent of H2O that escapes from the magma, as well as the ratios Cl/H2O, S/H2O, SO2/CO2, and S/Cl. The ratio SO2/CO2 was obtained by using the parametric study of the role of CO2 in the dynamics of magma by Papale and Polacci (1999). Their model is similar to the one used in this study (1D, isothermal conduit flow), except that it does not allow gas to escape from the magma. To ensure the best accuracy, we used a run with the lowest amount of CO2 and closest to volatile saturation at depth (run s2.2 in Papale and Polacci, 1999), because those conditions are closest to the pure H2O-fluid we simulated. The amount of CO2 in the volatile phase decreases monotonically from 14% to 2% as magma rises. We scaled their results so that they correspond to degassing starting from 150 MPa, and, at each corresponding pressure, we divided their CO2/H2O results to our SO2/H2O outputs. We use H2O as a proxy to the total amount of gas output at the vent. The amount of gas released at various depths during ascent depends strongly on the degassing style (scenarios 1-4), and so we discuss how degassing varies as a function of depth.
In the first degassing scenario, the magmatic foam is assumed to collapse completely from 40 vol.% (Figure 6). At the lowest magma flux, collapse allows a sudden flux of gas to reach the surface, the magnitude of which increases as magma flux increases. As magma flux increases above 105 kg/s, and into the explosive regime, the pulse of gas becomes a more continuous flux of
gas because rise time is shorter than that of collapse (180 s).
In the second degassing scenario, an oscillation of the porosity occurs at low pressure because magma is permeable above 40 vol.% but cannot collapse below 30 vol.% (Figure 7). At low magma fluxes, gas outputs occur in pulses related to collapse events. As magma approaches the surface, each gas pulse becomes more intense. When magma flux exceeds 104 kg/s, the oscillations become
smoothed out because rise time is shorter than that of collapse. In this case, magma ascent produces an increasing gas flux similar to that of the first scenario.
In degassing scenarios 3 and 4, no collapse happens when permeability occurs (Figure 8). In case 3, permeability starts when porosity reaches 40 vol.%, whereas in case 4 the magma is always permeable. Both scenarios inhibit explosive eruptions, because porosity cannot reach a critical fragmentation value. The intensity of degassing increases dramatically with decreasing pressure in both scenarios, but unlike the previous scenarios, the behavior of gas output with depth is the same regardless of mass flux.
Degassing of Pumice in Plinian Eruption Columns
So far we have focused on degassing before magma exits the vent. Degassing occurs as well after exiting the vent, as pumice and ash cools in Plinian eruption columns. One assumption we made for conduit flow was isothermal degassing. That assumption is violated here because in the atmosphere the volcanic jet entrains air and cools substantially, cooling pumice and ash also. To assess this stage of degassing, we use the model developed by Hort and Gardner (2000) to predict gas diffusion through vesicle walls inside volcanic pumice, which are assumed to be vesicular spheres that cool conductively. Briefly, the model consists of a steady state eruption column model coupled to a cooling and degassing model for pumice and ash. The eruption column part of the model is solved using equations balancing mass, momentum, and energy, following Glaze and Baloga (1996) and Glaze et al. (1997). The model gives the vertical variation of mean temperature and velocity inside the plume. Assuming that gas and particles move together in the plume, mean plume velocity is the velocity of pumices, and so the temporal change in the pumice position can be calculated by integrating the vertical velocity. Having established such a time scale we can determine the cooling and degassing of spherical pumices by assuming conductive cooling. Because of conductive cooling, the temperature at different points inside the pumice varies with time, depending on pumice size. Furthermore, we assume that all vesicles are spherical, surrounded by a shell of melt, and interconnected to all other vesicles. Gases thus diffuse out of the melt shell and escape from the pumice. Diffusive loss of gas will be controlled by the changing temperature
of the pumice through the temperature dependence of the diffusion coefficient of gas i (Di).
Diffusion coefficients for Cl, S, and CO2 in rhyolite melt are known to a first order, and the variation of DCl , DS, and DCO2 with temperature (T) are given by following the relationships:
† DCl= 3.16x10⁻⁹e -86,190 RT Ê Ë Á ˆ ¯ ˜ (1) † DS = 1.4x10⁻⁴e -263000 RT Ê Ë Á ˆ ¯ ˜ (2) † DCO 2 = 6.2x10 -7 e -144600 RT Ê Ë Á ˆ ¯ ˜ (3)
where R is the gas constant [see Watson (1994) for complete summary]. The diffusivity of Cl is in dry obsidian, CO2 is in dry granitic obsidian, and S is in dry, reduced dacite. Diffusion of these gases varies with water content (Watson, 1994), but there is too little data to couple Cl, S, and CO2 diffusion with H2O in the model. Water contents by this stage will be on order of 1 wt.% or less, and so diffusive behavior is not expected to diverge greatly from the above equations.
The degree of diffusive loss of gas depends strongly on pumice size (as a result of variable cooling), as well as the thermal properties and diffusivity of the pumice, heat transfer efficiency, and vesicle wall thickness. Figure 9 illustrates the influences of size and wall thickness, using Cl as an example because it diffuses faster than the other gases. In a large pumice (8 cm in diameter), in which vesicle walls are 10 µm thick, the Cl content of matrix glass at the pumice center will be less than half that at the rim, as well as almost half the Cl content at the center of a 4-cm-diameter pumice. Thinner walls allow more Cl to be lost (Figure 9). Cl contents in ash-sized particles are predicted to be on order of those at the rims of large pumices. The gradients in Cl concentration across pumice will be accentuated as eruption temperature increases, because the time needed to cool will lengthen.
To determine how much total gas is lost in an eruption, we modeled degassing by assuming that all particles are 75% vesicular and that all vesicles are 40 µm in radius, which fixes bubble walls at 4
µm. We solve for diffusive loss of gas from the glass surrounding vesicles as 21 evenly spaced locations inside the pumice as a function of time. This divides the pumice into 20 shells of equal thickness, from which we calculate the volume of each shell. Given a porosity of 75%, we are then able to determine the number of vesicles per shell. Because we know how much volatiles are lost from one vesicle in the center of each shell, we are thus able to calculate how much is lost from each shell once the pumice is cold. Summing the contributions from each shell gives the total amount of volatiles lost from the pumice (Figure 10). Our geometrical assumptions are violated when pumice becomes ~250 µm, given our assumed porosity and bubble size. For particles 250 µm and smaller, we simply assume a constant percentage of gas loss based on losses from slightly larger particles. This introduces little error because such small particles are little fractions of the total amount of mass erupted, and they degas very little as a result of their rapid cooling.
The amount of degassing depends on the mass flux and temperature of the eruption, because those two variable influence the amount of time allowed for pumice to cool (Hort and Gardner, 2000). We have thus estimated the amount of degassing expected for three eruption scenarios (10, 20, and 30 km column heights) and two initial temperatures (1048 and 1148 K). By setting exit velocity at 100, 200, and 300 m/s and then varying vent size, we were able to achieve our three column heights for the two temperatures.
Because the percentage of gas lost varies strongly with pumice size, we assumed two different size distributions of particles (Figure 11). Our “coarse” distribution has a median size of ~4 mm, with 35% being coarser than 8 mm. Our “fine” distribution has a median size of ~1 mm, with only 11% being coarser than 8 mm. The largest pumice size in both distributions is 45 mm. Our distributions correspond to distributions #2 and #4 of Sparks et al. (1992), which roughly cover the size distributions for most Plinian eruptions (Woods and Bursik, 1991). The total percentage of gas lost was determined from our estimated values of degassing for clasts of each size (Figure 10) and calculating the number of pumices of each size expected in either size distribution (Figure 11) for a given magma volume. Although the total mass of gas lost changes with magma volume, the percentage lost does not, and so we focus on the variations in percentages.
The percentages of Cl degassed during cooling in Plinian eruption columns vary from ~30 to 52% for a “coarse” eruption, and from ~18-33% for a “fine” eruption (Figure 12). Those percentages are much lower for CO2 (coarse = 14-32%; fine = 8-18%) and S (~0.5-1% for both distributions). For Cl and CO2, the percentage of gas lost increases as column height (mass flux) and temperature increase (Figure 12). In both cases, the greater losses result because of the longer amounts of time needed for particles to cool. There is little difference in the percentage of S lost with column height, especially at the lower temperature. The almost lack of gas loss results from the extremely slow diffusion of S at our assumed temperatures. Those temperatures are realistic for rhyolite magmas, and so little S lost should be expected from rhyolite pumices in eruption columns.
The amounts of Cl, CO2, and S lost are greater for the “coarse” distribution, because of the difference between cooling times for large pumice and ash. For example, 4.5 cm pumice will lose ~84% of its initial Cl content, whereas 500 µm ash would lose only ~11%, if both erupt at 1048 K in a 10-km eruption column (Figure 10). The difference between the two size distributions is greatest for Cl, because it diffuses faster than either CO2 or S (Figure 12).
Finally, we achieved our column heights by assuming initial eruption velocities and temperatures and then varying mass flux. The initial velocity will of course influence the amount of degassing that occurs, because it influences the amount of time allowed for cooling. To investigate this influence, we recalculated degassing of Cl by assuming different velocities at 1048 K. We focus on Cl because it diffuses fastest, and is more sensitive to changes in cooling time. For an eruption column of 10 km, the percentage of Cl lost decreases from 30 to 27% as velocity decreases from 200 to 100 m s-1. For a 30 km column, the percentage decreases from 50 to 39%, as velocity
decreases from 300 to 200 m s-1. Those percentages are for the “coarse” particle-size distribution,
but similar changes occur if we use the “fine” distribution.
Measuring the output and composition of gases at volcanoes has become an increasingly important method for monitoring for approaching magma and impending eruption (Malinconico, 1979; Greenland et al., 1985; McGee and Sutton, 1994; Harris and Rose, 1996; Duffell et al., 2003). Our modeling suggests that changing partition coefficients can complicate the release of gas from rising magma. The ratio Cl/H2O decreases as magma approaches the surface because of the combined effect of melt depletion and variation of KdCl (Figure 13). As reduced magma rises, SO2/CO2 increases, but only because CO2 becomes depleted, as
†
KdS is constant (Figure 14). The modest amount of sulfur contained in the gas compared to that of chlorine results in low values of S/Cl, but the balance between S and Cl degassing increases S/Cl as pressure decreases. In contrast, degassing of oxidized magma results in dramatically higher SO2/CO2 and S/Cl values because of the high
†
KdS (Figure 15). As a result, S/Cl values are greater than those for reduced magma, and they decrease during ascent.
In general, gas composition changes as a function of depth, but is not affected by variations in mass flux. On a first order basis, the behavior of a given volatile can be understood by considering the third degassing scenario, where magma is permeable from 40 vol.%. This occurs because the pulses from the two first scenarios reach values almost identical to that of the flux from the third scenario at that depth (Figure 13-15). Volatile fractions in the fourth scenario are always lower than those of the other cases because degassing starts at higher pressure, depleting the magma of volatiles earlier in the eruption. This scenario illustrates the importance of understanding the kinetics of degassing in order to link surface measurements to processes at depth.
Volcano gas studies often measure fluxes of sulfur to indicate the degassing of magma (e.g., Duffell et al., 2003). We use the integrated flux of H2O and the ratio S/H2O to calculate the total output of sulfur at the vent for each scenario. As expected, the total S flux at the vent varies with mass flux (Figure 16). The trend between S and mass flux is somewhat irregular when magma is least permeable (scenarios 1 and 2). This irregularity is caused by the transition from pulses to continuous gas flux as eruptive conditions become more vigorous. In the explosive regime, the
cumulative amount of gas is orders of magnitude larger than that of the effusive regime, because the large mass flux needed to reach fragmentation balances the short time available for gas to be expelled. The longer the magma is permeable (going from scenario 1 to 4), the stronger the total S flux is. All else being equal, sulfur outputs from oxidized magma are about 30 times greater than those from reduced magma (Figure 16).
Our lowest mass flux assumed equals that of Masaya volcano during the three weeks preceding a small explosive eruption of April 2001 (Duffell et al., 2003). They observed an increasing S/Cl ratio while the SO2 output decreased. Our calculations show that, at a given eruptive rate and under oxidized conditions, S/Cl decreases and SO2 increases as magma rises, regardless of permeability scenario. Changes in magma flux, however, affect only the total amount of gas. It is thus possible that degassing by foam collapse at progressively shallower depth coupled with progressive stalling of the rising magma caused the observed changes in gas flux and composition.
Volcanic Plinian eruptions can dramatically affect the atmosphere by injecting large masses of gases into the stratosphere, and many studies have attempted to estimate the amounts of gas that ancient eruptions released (e.g., Devine et al., 1984). For such eruptions, the only viable way of estimating those masses is by using the “difference” method, in which the differences between dissolved volatile contents in glass inclusions in crystals (assumed to be pre-eruptive gas contents) and those in matrix glass are scaled by the total mass of the eruption. Of course, it is well known that the difference method greatly underestimates the amount of volatiles released compared to remote sensing techniques (e.g., Wallace, 2001). In the case of ancient eruptions, however, no remote sensing techniques are available, and the difference method is the only method available to establish even a minimum amount of gas released. Often such estimates use one pumice, but we found that the amount of gas lost from matrix glass depends strongly on the size of that pumice (Figure 9). Thus, if large pumices are used to estimate degassing, the amount of gas released can be over-estimated. For example, if we were to use a 3.2-cm-sized pumice for the difference method, the amounts of gases we would estimate as released would exceed the actually amounts by 2-4 times for Cl, 2-6 times for CO2, and 1.5-4 times for S. Our over-estimate is even worse if the
eruption produced a “fine” distribution of material, because those large pumices would make up even less of the total amount of material (Figure 11). Our miscalculation also increases for colder magma and smaller eruptions, because both result in less time for all of the smaller particles to loss gas. Clearly, the amount of gas released depends on the size distribution of erupting material, and thus on the fragmentation process. As a first-order approximation, we find that the optimal size for estimating gas loss (Cl, CO2, and S) is –2f to –3f pumice from a coarse deposit, and 0f to –1.5f pumice from a fine deposit.
Our degassing models have their limitations and assumptions. One limitation of the conduit flow modeling is our assumption of instantaneous equilibrium between water and melt. We calculated the likely time needed for Cl and S to diffuse through the melt into the bubbles to determine whether changes in porosity occur slowly enough for volatiles to escape. Given diffusive rates (equations 1 and 2), we find that there is ample time for Cl to diffuse in all cases except in the last few meters before the surface in the third and fourth scenarios at high mass flux. Sulfur, on the other hand, may diffuse too slowly to remain in equilibrium. The same is likely true for other slowly diffusing species, such as CO2 (equation 3). In order to fully evaluate gas fluxes from ascending magma, a more complete model should thus be developed in which kinetics are included. We also neglected interaction of gas with any shallow hydrothermal system, which would clearly modify the composition of gas fluxes. We did, however, find important variations in the composition of released gases resulted from differing magma dynamics and composition, in the absence of hydrothermal systems, and so we caution against ascribing all observed fluctuations to hydrothermal modification. Hort and Gardner (2000) discuss the assumptions and limitations of that modeling pumice cooling, one of which is the assumption of conductive cooling. They showed, however, that model results match the observations of Tait et al. (1998) for the rate of oxidation of pumice, which occurs only in high temperature pumice.
Acknowledgments Thorough reviews by Maragret Mangan and Paul Wallace greatly improved the manuscript.
EAR-0229290; EAR-0309703; EAR-0400745) and from Deutsche Forschungsgemeinschaft (DFG Ho1411 11-1). The authors wish to thank Joe Devine and Ken Severin for their assistance with the electron microprobes at Brown University and the University of Alaska Fairbanks, respectively.
References Cited
Blower, J.D., 2001, Factors controlling permeability-porosity relationships in magma: Bulletin of Volcanology, v. 63, p. 497-504.
Burgisser, A., and Gardner, J.E., 2004, Experimental constraints on degassing and permeability in volcanic conduit flow: Bulletin of Volcanology, DOI: 10.1007/s00445-004-0359-5.
Carroll, M.R., and Webster, J.D., 1994, Solubilities of sulfur, noble gases, nitrogen, chlorine, and fluorine in magmas: in Carroll, M.R., and Holloway, J.R., eds., Volatiles in Magmas, Reviews in Mineralogy, v. 30, p. 231-280.
Cottrell, E, Gardner, J.E., and Rutherford, M.J., 1999, Dynamic movement and changing storage conditions of large silicic magma bodies: Evidence from the Minoan rhyodacite, Santorini, Greece: Contributions to Mineralogy and Petrology, v. 135, p. 315-331.
Devine, J.D., Sigurdsson, H., Davis, A.N., and Self, S., 1984, Estimates of sulfur and chlorine yield to the atmosphere from volcanic eruptions and potential climatic effects: Journal of Geophysical Research, v. 89, p. 6309-6325.
Duffell, H.J., Oppenheimer, C., Pyle, D.M., Galle, B., McGonigle, A.J.S., and Burton, M.R., 2003, Changes in gas composition prior to a minor explosive eruption at Masaya volcano, Nicaragua: Journal of Volcanology and Geothermal Research, v. 126, p. 327-339.
Eichelberger, J.C., Carrigan, C.R., Westrich, H.R., and Price, R.H., 1986, Non-explosive silicic volcanism: Nature, v. 323, p. 598-602.
Gardner, J.E., Rutherford, M., Carey, S., and Sigurdsson, H., 1995, Experimental constraints on pre-eruptive water contents and changing magma storage prior to explosive eruptions of Mount St. Helens volcano: Bulletin of Volcanology, v. 57, p. 1-17.
Gardner, J.E., Hilton, M., and Carroll, M.R., 1999, Experimental Constraints on Degassing of Magma: Isothermal Bubble Growth During Continuous Decompression from High Pressure: Earth and Planetary Science Letters.
Glaze, L.S., and Baloga, S.M., 1996, Sensitivity of buoyant plume heights to ambient atmospheric conditions: Implications for volcanic eruption columns: Journal of Geophysical Research, v. 101, p. 1529-1540.
Glaze, L.S., Baloga, S.M., and Wilson, L., 1997, Transport of atmospheric water vapor by volcanic eruption columns: Journal of Geophysical Research, v. 102, p. 6099-6108.
Greenland, L.P., Rose, W.I., Jr., and Stokes, J.B., 1985, An estimate of gas emissions and magmatic gas content from Kilauea volcano: Geochimica et Cosmochimica Acta, v. 49, p. 125-129.
Harms, E., Gardner, J.E., and Schminke, H.-U., 2004, Phase equilibria in the Laacher See Tephra (East Eifel, Germany): Constraints on pre-eruptive storage conditions of a phonolitic magma reservoir: Journal of Volcanology and Geothermal Research, v. 134, p. 125-138.
Harris, D.M., and Rose, W.I., 1996, Dynamics of carbon dioxide emissions, crystallization, and magma ascent: hypotheses, theory, and applications to volcano monitoring at Mount St. Helens: Bulletin of Volcanology, v. 58, p. 163-174.
Hort, M., and Gardner, J.E., 2000, Constraints on degassing of pumice clasts during Plinian volcanic eruptions based on model calculations: Journal of Geophysical Research, v. 105, p. 25981-26001.
Klug, C., and Cashman, K.V., 1996, Permeability development in vesiculating magmas: Implications for fragmentation: Bulletin of Volcanology, v. 58, p. 87-100.
Klug, C., Cashman, K.V., and Bacon, C.R., 2002, Structure and physical characteristics of pumice from the climactic eruption of Mount Mazama (Crater Lake), Oregon: Bulletin of Volcanology, v. 64, p. 486-501.
Malinconico, L.L., 1979, Fluctuations in SO2 emissions during recent eruptions of Etna: Nature, v.
278, p. 43-45.
McCormick, M.P., Thomason, L.W., and Trepte, C.R., 1995, Atmospheric effects of the Mt. Pinatubo eruption: Nature, v. 373, p. 399-404.
McGee, K., and Sutton, A.J., 1994, Eruptive activity at Mount St. Helens, Washington, USA, 1984-1988: a gas geochemistry perspective: Bulletin of Volcanology, v. 56, p. 435-446.
Metrich, N., and Rutherford, M.J., 1992, Experimental study of chlorine behavior in hydrous silicic melts: Geochimica et Cosmochimica Acta, v. 56, p. 607-616.
Pang, K.D., 1991, The legacies of eruption: Matching traces of ancient volcanism with chronicles of cold and famine: Sciences, v. 31, 30-33.
Papale, P., 1999, Modeling of the solubility of a two-component H2O+CO2 fluid in silicate liquids, American Mineralogist, v. 84, p. 477–492.
Papale, P., and Polacci, M., 1999, Role of carbon dioxide in the dynamics of magma ascent in explosive eruptions, Bulletin of Volcanology, v. 60, p. 583-594.
Rampino, M.R., Self, S., and Stothers, R.B., 1988, Volcanic winters: Annual Reviews of Earth and Planetary Sciences, v. 16, 73-99.
Scaillet, B., Clemente, B., Evans, B.W., and Pichavant, M., 1998, Redox control of sulfur degassing in silicic magmas: Journal of Geophysical Research, v. 103, 23937-23949.
Sparks, R.S.J., Bursik, M.I., Ablay, G.J., Thomas, R.M.E., and Carey, S.N., 1992, Sedimentation of tephra by volcanic plumes. Part 2: Controls on thickness and grain-size variations of tephra fall deposits: Bulletin of Volcanology, v. 54, p. 685-695.
Symonds, R.B., Rose, W.I., Bluth, G.J.S., and Gerlach, T.M., 1994, Volcano-gas studies: Methods, results, and applications: in Carroll, M.R., and Holloway, J.R., eds., Volatiles in Magmas, Reviews in Mineralogy, v. 30, p. 1-66.
Tait, S., Thomas, R.M.E., Gardner, J.E., and Jaupart, C., 1998, Constraints on cooling rates and permeabilities of pumice in an explosive eruption jet from colour and magnetic mineralogy: Journal of Volcanology and Geothermal Research, v. 86, p. 79-91.
Wallace, P., 2001, Volcanic SO2 emissions and the abundance and distribution of exsolved gas in magma bodies: Journal of Volcanology and Geothermal Research, v. 108, p. 85-106.
Watson, E.B., 1994, Diffusion in volatile-bearing magmas: in Carroll, M.R., and Holloway, J.R., eds., Volatiles in Magmas, Reviews in Mineralogy, v. 30, p. 371-412.
Webster, J.D., 1992, Fluid-melt interactions involving Cl-rich granites: Experimental study from 2 to 8 kbar: Geochimica et Cosmochimica Acta, v. 56, p. 659-678.
Webster, J.D., 1997, Exsolution of magmatic volatile phases from Cl-enriched mineralizing granitic magmas and implications for ore metal transport: Geochimica et Cosmochimica Acta, v. 61, p. 1017-1029.
Westrich, H.R., and Eichelberger, J.C., 1994, Gas transport and bubble collapse in rhyolitic magma: an experimental approach: Bulletin of Volcanology, v. 56, p. 447-458.
Woods, A.W., and Bursik, M.I., 1991, Particle fallout, thermal disequilibria, and volcanic plumes: Bulletin of Volcanology, v. 53, p. 559-570.
TABLE 1. COMPOSITIONS OF STARTING MATERIALS Lipari Laacher See Minoan Minoan Rhyolite Phonolite Rhyodacite Rhyodacite Obsidian Pumice Pumice Glass SiO2 73.87 56.33 69.07 71.75 TiO2 0.10 0.12 0.45 0.34 Al2O3 13.13 22.88 15.08 14.98 FeO* 1.57 1.58 3.30 2.21 MnO 0.04 0.50 0.09 0.09 MgO 0.04 0.05 0.93 0.39 CaO 0.80 0.43 2.94 2.18 Na2O 4.22 11.25 5.16 5.10 K2O 5.03 5.03 2.81 2.97 Total 98.9 99.09 99.83
-Note: oxides in wt.%, total iron reported as FeO. Data for Minoan pumice and glass are from Cottrell et al. (1999).
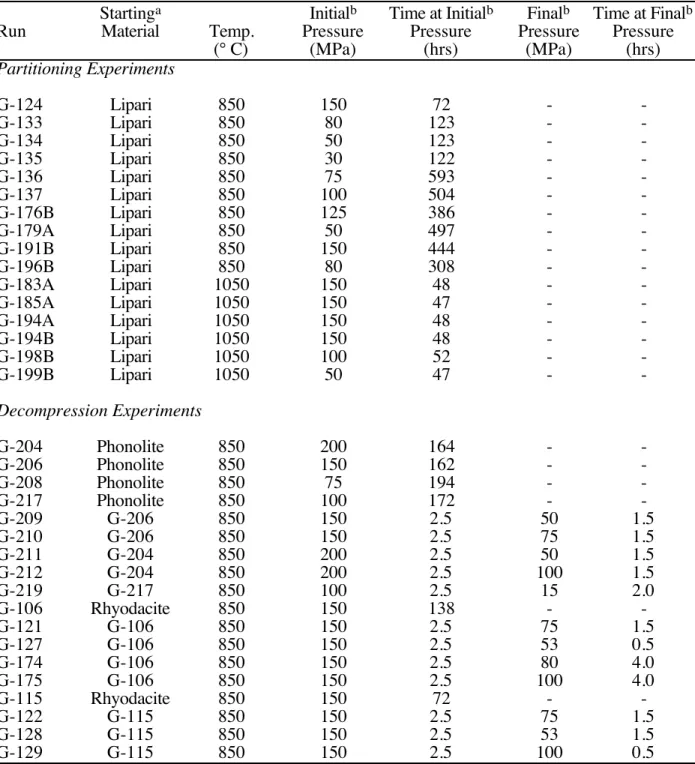
TABLE 2. EXPERIMENTAL RUN CONDITIONS
Startinga Initialb Time at Initialb Finalb Time at Finalb
Run Material Temp. Pressure Pressure Pressure Pressure (° C) (MPa) (hrs) (MPa) (hrs) Partitioning Experiments G-124 Lipari 850 150 72 - -G-133 Lipari 850 80 123 - -G-134 Lipari 850 50 123 - -G-135 Lipari 850 30 122 - -G-136 Lipari 850 75 593 - -G-137 Lipari 850 100 504 - -G-176B Lipari 850 125 386 - -G-179A Lipari 850 50 497 - -G-191B Lipari 850 150 444 - -G-196B Lipari 850 80 308 - -G-183A Lipari 1050 150 48 - -G-185A Lipari 1050 150 47 - -G-194A Lipari 1050 150 48 - -G-194B Lipari 1050 150 48 - -G-198B Lipari 1050 100 52 - -G-199B Lipari 1050 50 47 - -Decompression Experiments G-204 Phonolite 850 200 164 - -G-206 Phonolite 850 150 162 - -G-208 Phonolite 850 75 194 - -G-217 Phonolite 850 100 172 - -G-209 G-206 850 150 2.5 50 1.5 G-210 G-206 850 150 2.5 75 1.5 G-211 G-204 850 200 2.5 50 1.5 G-212 G-204 850 200 2.5 100 1.5 G-219 G-217 850 100 2.5 15 2.0 G-106 Rhyodacite 850 150 138 - -G-121 G-106 850 150 2.5 75 1.5 G-127 G-106 850 150 2.5 53 0.5 G-174 G-106 850 150 2.5 80 4.0 G-175 G-106 850 150 2.5 100 4.0 G-115 Rhyodacite 850 150 72 - -G-122 G-115 850 150 2.5 75 1.5 G-128 G-115 850 150 2.5 53 1.5 G-129 G-115 850 150 2.5 100 0.5
Note: Lipari = powder of Lipari obsidian; Phonolite = powder of Laacher See phonolite; Rhyodacite = powder of
Minoan rhyodacite. Initial and final pressures are those at which experiment was run. If only initial pressure is given, experimental ran at that pressure for entire length of the experiment. If two pressures are listed, experiment first ran at initial pressure (for time given) and then was instantaneously decompressed to final pressure, where it ran for time given before being quenched. All times are in hours.
TABLE 3. Cl CONCENTRATIONS IN DECOMPRESSION EXPERIMENTS Run Starting [Cl] Material (ppm) G-204 Phonolite 6460 (130) G-206 Phonolite 7046 (130) G-208 Phonolite 8257 (150) G-217 Phonolite 8032 (125) G-106 Rhyodacite 4604 (150) G-115 Rhyodacite 2282 (90) Decompression Experiments G-209 G-206 8200-8503 G-210 G-206 8011-8352 G-211 G-204 7756-8768 G-212 G-204 7538-7945 G-219 G-217 8380-8770 G-121 G-106 5066-6240 G-127 G-106 2897-5741 G-174 G-106 5042-5817 G-175 G-106 4889-6129 G-122 G-115 1949-2990 G-128 G-115 1538-2248 G-129 G-115 1962-2440
Note: See Table 1 for compositions and Table 2 for experimental run conditions. Cl contents listed for
solubility experiments are averages of 8 analyses (±1s in parentheses). Cl contents for decompression experiments are the lowest and highest value analyzed among 6 to 9 analyses per sample.
TABLE 4. PARTITION COEFFICIENTS OF Cl BETWEEN RHYOLITE AND WATER Run [Cl] Excess Water KdCl
(ppm) (wt.%) 850°C Experiments G-124 2374 6.0 7.8 G-133 2917 6.5 3.1 G-134 3295 3.6 2.0 G-135 3317 4.0 1.6 G-136 3204 5.0 2.0 G-137 3179 1.4 8.2 G-176B 2530 5.0 7.7 G-179A 2850 5.2 4.4 G-191B 2294 6.7 7.6 G-196B 3358 5.6 0.9 1050° C Experiments G-183A 2868 2.7 8.4 G-185A 3060 3.4 4.5 G-194A 2680 5.4 5.6 G-194B 2478 9.7 4.0 G-198B 2896 9.9 2.0 G-199B 3056 2.2 7.1
Note: See Table 2 for experimental run conditions. Concentrations are averages of 6 analyses of Cl content i n
glasses. Excess water is the mass of water in experiment per sample mass. Partition coefficients are concentration of of Cl in water divided by that of Cl in the glass.
Figure Captions
Figure 1. Variations in partition coefficients of Cl between water and rhyolite at 850° C as a function of water pressure. Solid symbols are samples run with weight percents of excess water to melt of 3.5 to 6.5 wt.% (Table 4). Dashed curve is the variation in KdCl with pressure used in our degassing model (see text).
Figure 2. Variations in partition coefficients of Cl between water and rhyolite at 1050° C as a function of the weight percent of excess water in the experiment. Filled symbols are samples at 150 MPa, open symbols are lower pressure samples (data from Table 4). Vertical line indicates ±1 s.
Figure 3. Changes in Cl contents in decompressed rhyodacite glasses as a function of final pressure (Table 4). Differences equal the Cl content in the decompressed sample minus that in the starting materials. Solid boxes are single analyses from experiments that had G-106 as starting material; open boxes are single analyses from experiments that had G-115 as starting material (Table 2). Solid and open boxes at 150 MPa record the range of Cl contents in the two starting materials (Table 4).
Figure 4. Cl contents in decompressed phonolite glasses as a function of final pressure (open symbols). Each point represents a single analysis; see Table 4 for data. Cl solubility in phonolite as determined from experiments that were not decompressed is shown by closed symbols (±1 s) (see Table 4).
Figure 5. Compositional gradient of dissolved Cl melt content near a large gas bubble in experiment G-211 (see Table 2). The decrease in Cl content away from the bubble, as well as the overall
elevated Cl contents compared to the starting material, indicates that the gradient records diffusion of Cl from the bubble into the melt.
Figure 6. Degassing behavior as a function of pressure for scenario 1, where permeability begins when porosity reaches 40 vol.% and then porosity drops to 0 vol.% in 180 s. a) Water vapor output in kg/s for four magma fluxes. B) Porosity of the magma as a function of pressure for four magma fluxes.
Figure 7. Degassing behavior as a function of pressure for scenario 2, where permeability begins when porosity reaches 40 vol.% and then porosity drops to 30 vol.% in 180 s. a) Water vapor output in kg/s for four magma fluxes. B) Porosity of the magma as a function of pressure for four magma fluxes.
Figure 8. Degassing behavior as a function of pressure where permeability starts at either 40 vol.% (scenario 3) or 0 vol.% (scenario 4) porosity and then porosity remains at that value. Water vapor output is given in kg/s for two magma fluxes: 102.2 (solid curves) and 108.1 (dashed curves).
Figure 9. Predicted post-cooling Cl contents in matrix glasses as a function of position inside the pumice. Initial Cl content and temperature was 1500 ppm and 1048 K. Pumice size was either 4 or 8 cm. Vesicle wall thickness was also varied between 10 and 20 µm. Note the influences that pumice size and wall thickness have on final Cl contents.
Figure 10. Predicted amounts degassed (in wt.%) of Cl, CO2, and S from cooling pumice and ash in a Plinian eruption column as a function of pumice size (in mm and f units). Amounts shown are for an eruption column of 10 km height and initial temperature of 1048 K. Degassing from ash smaller than 0.35 mm is assumed constant at 10, 4, and 0.4 wt.% for Cl, CO2, and S, respectively.
Figure 11. Size distributions of pumice and ash assumed to calculate total masses of gases lost in Plinain eruption columns. Solid curve represents a relatively “coarse” distribution; dashed curve represents a relatively “fine” distribution (Woods and Bursik, 1991; Sparks et al., 1992).
Figure 12. Total mass of gases lost, expressed as percentages of the total mass contained in the initial melt, from cooling tephra in Plinian eruption columns, as a function of height of the eruption column (equal to magma flux). Percents in a) are for a “coarse” size distribution, and those in b) are for a “fine” distribution (Figure 11). Boxes are Cl values, circles are CO2 values, and triangles are S values. Solid trends connect degassing of magma initially at 1148 K, whereas dashed curves connect degassing of magma initially at 1048 K.
Figure 13. Variations in the Cl/H2O ratio of the output of gas released from ascending magma as a function of pressure. Labels 1-4 refer to degassing scenarios 1-4 (see text for discussion).
Figure 14. Variations in gas composition, as expressed as a) SO2/CO2 and b) S/Cl, as a function of pressure for reduced magma with S partition coefficient of 1. Labels 1-4 refer to degassing scenarios 1-4 (see text for discussion).
Figure 15. Variations in gas composition, as expressed as a) SO2/CO2 and b) S/Cl, as a function of pressure for oxidized magma with S partition coefficient of 1000. Labels 1-4 refer to degassing scenarios 1-4 (see text for discussion).
Figure 16. Depth-integrated fluxes of sulfur at the vent for each of the four degassing scenarios as a function of magma mass flux for a) oxidized magma and b) reduced magma. The stars indicate fluxes for explosive conditions; squares indicate effusive conditions.
![TABLE 3. Cl CONCENTRATIONS IN DECOMPRESSION EXPERIMENTS Run Starting [Cl] Material (ppm) G-204 Phonolite 6460 (130) G-206 Phonolite 7046 (130) G-208 Phonolite 8257 (150) G-217 Phonolite 8032 (125) G-106 Rhyodacite 4604 (150) G-115 Rhyodacite 2282 (90) Deco](https://thumb-eu.123doks.com/thumbv2/123doknet/14712835.568034/30.918.121.741.143.562/concentrations-decompression-experiments-phonolite-phonolite-phonolite-rhyodacite-rhyodacite.webp)