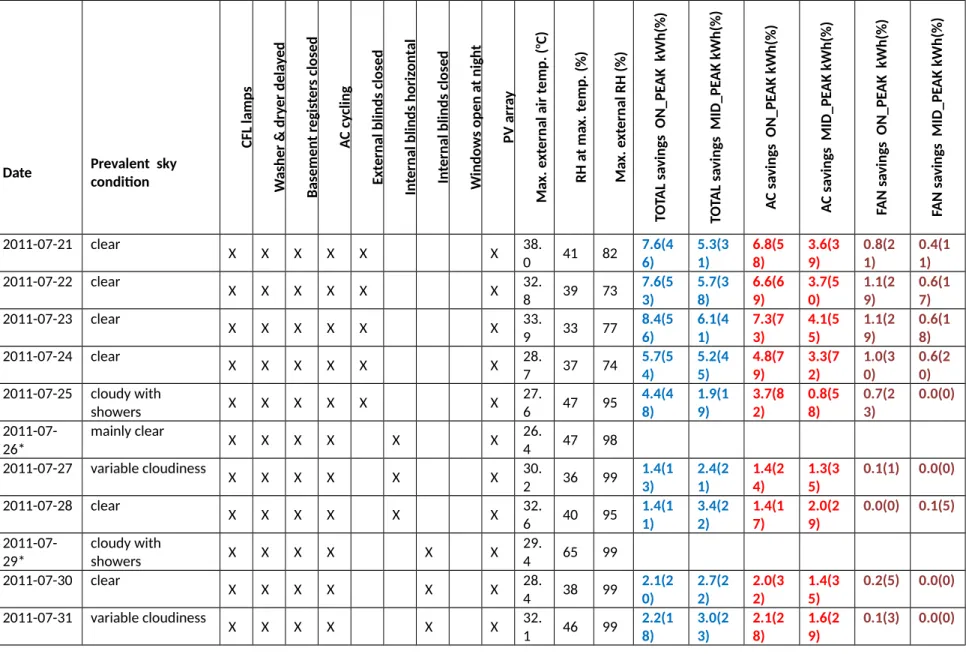
Table 1. Summary of days on which peak load reduction trials were conducted, showing the measures enacted, climate data, and total savings during various hours (tariff blocks).
Date Prevalent sky condition
CFL lamps Washer & dryer delayed Basement registers closed AC cycling External blinds closed Internal blinds horizontal Internal blinds closed Windows open at night PV array Max. external air temp. (o C) RH at max. temp. (%) Max. external RH (%) TOTAL savings ON_PEAK kWh(%) TOTAL savings MID_PEAK kWh(%) AC savings ON_PEAK kWh(%) AC savings MID_PEAK kWh(%) FAN savings ON_PEAK kWh(%) FAN savings MID_PEAK kWh(%)
2011-07-21 clear
X X X X X X 38.
0 41 82 7.6(4
6)
5.3(3 1)
6.8(5 8)
3.6(3 9)
0.8(2 1)
0.4(1 1) 2011-07-22 clear
X X X X X X 32.
8 39 73 7.6(5
3)
5.7(3 8)
6.6(6 9)
3.7(5 0)
1.1(2 9)
0.6(1 7) 2011-07-23 clear
X X X X X X 33.
9 33 77 8.4(5
6)
6.1(4 1)
7.3(7 3)
4.1(5 5)
1.1(2 9)
0.6(1 8) 2011-07-24 clear
X X X X X X 28.
7 37 74 5.7(5
4)
5.2(4 5)
4.8(7 9)
3.3(7 2)
1.0(3 0)
0.6(2 0) 2011-07-25 cloudy with
showers X X X X X X 27.
6 47 95 4.4(4
8)
1.9(1 9)
3.7(8 2)
0.8(5 8)
0.7(2 3)
0.0(0) 2011-07-
26*
mainly clear
X X X X X X 26.
4 47 98
2011-07-27 variable cloudiness
X X X X X X 30.
2 36 99 1.4(1
3)
2.4(2 1)
1.4(2 4)
1.3(3 5)
0.1(1) 0.0(0) 2011-07-28 clear
X X X X X X 32.
6 40 95 1.4(1
1)
3.4(2 2)
1.4(1 7)
2.0(2 9)
0.0(0) 0.1(5) 2011-07-
29*
cloudy with
showers X X X X X X 29.
4 65 99
2011-07-30 clear
X X X X X X 28.
4 38 99 2.1(2
0)
2.7(2 2)
2.0(3 2)
1.4(3 5)
0.2(5) 0.0(0) 2011-07-31 variable cloudiness
X X X X X X 32.
1 46 99 2.2(1
8)
3.0(2 3)
2.1(2 8)
1.6(2 9)
0.1(3) 0.0(0)
Page 1 of 2
2011-08-01 clear
X X X X X X 31.
3 37 98 2.2(1
6)
4.0(2 6)
2.0(2 3)
2.2(3 2)
0.2(4) 0.2(7)
2011-08- 02*
mainly clear
X X X X X X X 26.
8 43 85
2011-08-03 variable cloudiness
X X X X X X X 26.
2 55 97 1.8(2
1)
3.4(4 0)
1.7(4 3)
1.9(7 5)
0.2(6) 0.2(8)
NOTES:
Savings represent the difference between the corrected use of the Reference House, and the actual use of Test House with load reduction measures as implemented, and without the offsetting PV generation included
Saving from implemented measures: kWh = total savings over the 6-hr period considered; (%) = average of hourly percentage savings for the 6-hr period considered
Days with * were transition days between periods with different measures, for clarity we do not report savings data for these days
Page 2 of 2