Analysis of a Shuffling Detection Device for Fall Prevention
by
Alaisha Alexander
Submitted to the Department of Mechanical Engineering in Partial Fulfillment of the Requirements for the Degree of
Bachelor of Science in Mechanical Engineering at the
Massachusetts Institute of Technology
June 2018
2018 Alaisha Alexander. All rights reserved.
The author hereby grants to MIT permission to reproduce and to distribute publicly paper and electronic copies of this thesis document
in whole or in part in any medium now known or hereafter created.
Signature redacted
Signature of Author: ...Alaisha Aex--ner Department of Mechanical Engineering
Signature redacted
C ertified by : ... ... ~
K
>Leia
Stirling Charles Stark Draper Professor of Aeronautics and Astronautics Thesis SupervisorSignature redacted
C ertified b y : ... ... ...
MASSACHU T STTE Rohit Karnik
OF TECHNOLOGY Associate Professor of Mechanical Engineering
77 Massachusetts Avenue
Cambridge, MA 02139 http://Iibraries.mit.edu/ask
DISCLAIMER NOTICE
Due to the condition of the original material, there are unavoidable flaws in this reproduction. We have made every effort possible to provide you with the best copy available.
Thank you.
The images contained in this document are of the best quality available.
Analysis of a Shuffling Detection Device for Fall Prevention
by
Alaisha Alexander
Submitted to the Department of Mechanical Engineering on May 20, 2018 in Partial Fulfillment of the
Requirements for the Degree of
Bachelor of Science in Mechanical Engineering
ABSTRACT
According to the World Health Organization, falls are the second leading cause of accidental or unintentional injury deaths worldwide. In order to address this issue from a fall prevention perspective, I began developing a footwear device to give feedback to the user on their walking. In this iteration, I've identified characteristics to distinguish between shuffling and walking strides for implementation in a threshold-based algorithm and the device created was effective in making this distinction with a 74.65% accuracy and 73.17% sensitivity. The errors identified are those common to threshold-based algorithms and can be corrected in future iterations with a more sensitive threshold and stride detection method. Moving forward, the device can be improved in order to be integrated into a feedback device for the intended user.
Thesis Supervisor: Leia Stirling
Table of Contents A b stract ... 2 Table of Contents ... 3 List of Figures ... 4 List of Tables ... 5 1. Introduction ... 6 2. Background ... 6
2.1 Accidental Falls: Demographics and Causes ... 7
2.2 Fall Detection ... 7
2.3 Detection M ethods ... 8
2.4 Summ ary and Approach ... 9
3. System Design ... 10
3.1 Identifying Characteristics ... 10
3.2 Apparatus ... 12
3.3 M ethods ... 12
4. Results and Discussion ... 13
5. Conclusions and Future W ork ... 15
6. References ... 16
7. Appendices ... 17
7.1 Appendix A : Arduino Code ... 17
List of Figures
Figure 2.1.1: Fatal falls rate by age and sex 7
Figure 3.1.1: Test Sensor Placement Diagram 10
Figure 3.1.2a: Lumbar Accelerometer Pattern 10
Figure 3.1.2b: Shin Gyroscope Pattern 10
Figure 3.1.3a: Toe Accelerometer Pattern 11
Figure 3.1.3b: Toe Gyroscope Pattern 11
List of Tables
Table 3.3.1: Test Profile 13
Table 3.3.2: Designation Description 13
Table 4.1.1: Designation of Results 14
Table 4.1.2: Accuracy, Specificity, Sensitivity, and F1 Score 14
1. Introduction
Walking, though commonplace, involves coordination and balance from different parts of the body. When walking, people utilize several senses in order to correct themselves, adjusting stride, pace, gait, and other characteristics to avoid obstacles, climb slopes, or simply keep moving forward[1-3]. It is then no surprise that as humans get older, they have can have difficulties walking whether that be through physical limitations or a reduced perception[4].
Around 28-35% of individuals aged 65 and over fall every year growing to around 32-42% for those aged 70 and over [5]. According to the World Health Organization, falls are the second leading cause of accidental or unintentional injury deaths worldwide [5], and more than one third of elderly people fall once or more each year [6]. Fall detection allows for rapid response to such events but the falls themselves can be fatal [7]. What constitutes a fall and its impact is well documented; however, falls can be caused by a myriad of reasons from several different factors, including but not limited to physical restrictions while walking, unnoticed obstacles, and a shift in elevation on a flat or sloped surface.
Elderly adults typically have reduced control or significant risk factors, like muscle weakness or a gait deficit, that contribute to difficulty lifting their feet when walking[8,9]. They may, for example, shuffle, or drag, their feet across the floor when walking. In this scenario, thresholds, rugs, or even an uneven slope in the floor can cause them to fall. In order to prevent these types of falls, this project sought to design and analyze a shuffling detection device in order to give feedback to users. With this feedback, elderly adults would be more aware of a walking habit that puts them at risk of a fall and adjust appropriately.
In the process of creating and testing this device, questions regarding what it means to shuffle one's feet as well as the most efficient way to give feedback to users were considered. A shuffle was considered an incomplete walking stride or a stride forward that did not lift the feet fully off of the ground. In some cases, shuffling is the manifestation of physical restrictions. However, this device is seeking to address awareness in order to address shuffling that is the manifestation of perception, like impaired eyesight or balance deficits, or confidence change.
The success of this device will be determined in how well it can distinguish between walking and shuffling as well as how quickly and clearly it can display this information in a way that can be easily understood.
2. Background
Modeling a similar project used to alert astronauts [10] who have limited vision and sensory perception in their suits, I began developing a device to distinguish between shuffling and walking. The aforementioned project utilized varying sensors to detect an obstacle and provide vibrotactile and visual cues to the user. Two separate devices, augmented reality glasses and vibrotactile boots, were used to provide feedback. Additionally, the boots held built-in sensors to detect objects, including an inertial measurement unit to determine the orientation of the boot and neglect the floor as an obstacle. This project provided a starting point for using an inertial measurement unit to identify patterns present in measurable aspects of walking and receptive methods of feedback.
When approaching the design of this device, background included motivation, fall detection, fall analysis, and feedback of the analysis system.
2.1 Accidental Falls: Demographics and Causes
Among persons aged 65 years or older, falls are the leading cause of death from injury [7]. Figure
2.1.1 shows fatal falls by 5-year age group and sex. Fatal fall rates increase with age for both sexes.
Falls pose an economic and physical risk to elderly adults. In the elderly, falls are the leading contributor to the economic burden of injuries with respect to lifetime costs in the USA and Australia [6]. Each year,
unintentional falls kill over a Women N Men
10,000 adults age 65 and 180
older in the United States 160 153.2
[11]. These falls are usually
the manifestation of 2
physical restrictions and
other physical injuries.
Muscle weakness, impaired 3 60
balance, gait deficits, and 34
visual impairment all create 20 5410.6 95 16 19
additional difficulty and put 0 -- u
affected individuals at risk 65-69 70-74 75-79 80-84 85+
[8]. The risk of these Age Group
physical restrictions escalate
the danger of smaller Figure 2.1.1: Fatal falls rate by age and sex group The fatal falls rates of household dangers like an those 65 and older in the USA in 2001 (Source: WHO Global Report on Falls
unevenly sloped floor or the Prevention in Older Age [5])
threshold of a door.
Fall prevention is critical in preventing these unintentional injuries. As a manifestation of these
other physical impairments, falls are the result of a modified walking profile. Ageing influences gait patterns which in turn affects the control mechanism of human locomotor balance[4]. This effect on control can present itself in several ways like reduced control to minimize tripping on sloped surfaces [9] or reduced minimum toe clearance while walking [2].
Though certain risk factors require specialized care, like a hip fracture, other physical restrictions simply change the perception of the individual, like vision impairment. These factors can be mitigated with attention and caution as well as focused improvement[ 11]. Targeted attention and caution is effective in reducing the likelihood of a fall which in turn reduces fall-related injuries and the likelihood of a fatal fall.
2.2 Fall Detection
Within fall detection, there is extensive literature on sensing and analyzing falls and their impacts. Though literature on fall prevention was limited, literature on human gait, stride, and posture were more abundant. Fall detection utilizes varying sensors and analysis methods to understand the
impact and severity of falls. These fall detection techniques include, but are not limited to, accelerometry-sense acceleration, a fusion of accelerometry and posture sensors, and event sensing using vibrational data. These detection techniques then determine the data processing technique used to best analyze and understand the information collected [12].
The majority of existing pre-impact fall detection systems are wearable sensor-based since wearable micro-electro-mechanical systems, such as accelerometers and gyroscopes, are small, light-weight and low-cost. However, inertial measurement units (IMUs) are preferred since singular signals have difficulty differentiating between a fall and fall-like perturbations, like balance recovery, shifting weight, or jumping [13,14]. Camera, or vision based, approaches and ambient based approaches make use of cameras, microphones, sonar, or other environmental sensors. However, these approaches are typically more focused on addressing environmental factors.
The sensor choice influences, or is influenced by, the fall indicators that the researchers intend to measure. It is also significant to consider the intention to identify an accurate and rapid detection method to integrate into a technology that is capable of reducing the impact of a fall, thus reducing fatal falls. The data collection and data processing must then be almost immediate in order to allow the reaction of an on-demand injury prevention system.
Pre-impact fall detection indicators are typically defined by body kinematics [13]. Some examples include head acceleration, upper arm velocity, angular rate of the waist, and angular rate of the sternum. Some would monitor more than one indicator in order to ensure accuracy when using predefined thresholds as the criteria for detecting a fall. The most common body sites for sensors were the waist and chest area. This is likely the case in order to be close to the center of mass. Since rapid detection was vital, the algorithms used needed to have rapid analysis times. The two common algorithms were threshold-based algorithms and machine learning algorithms[13]. For threshold-based algorithms, a fall is considered detected if the selected indicators are beyond some pre-defined threshold. Machine learning algorithms vary depending on the selected indicators and a training period is typically required to ensure the accuracy of the algorithm.
2.3 Detection Methods
Threshold-based algorithms, though computationally efficient, can be difficult to implement because an appropriate threshold can vary depending on its use and the user. A higher threshold would result in more missed detections of falls but fewer false alarms, or detections of falls when none occur.. A lower threshold would result in more false alarms but less misdetection. Researchers tend to set these thresholds based on maximum readings of non-fall activities and minimum readings of fall events but the experimental settings cannot be inclusive of all non-fall activities and all possible fall events.
Machine learning algorithms are also common and include support vector machines, hidden Markov models, artificial neural networks, and wavelet based analysis among others[ 12,13]. These algorithms were computationally intensive compared to threshold-based algorithms and typically had longer detection times resulting in a delay in feedback. The training period is also significant
when considering a machine learning algorithm since the non-fall and fall events will facilitate how accurate it will perform in real-time instances.
In gait analysis, machine learning algorithms are typically used since several indicators and events are considered[ 1,15,16]. In these experiments, detection times are not critical in conducting analysis and providing feedback. In the case of a portable system for fall detection, the researchers use a threshold-based system[17]. The portable system is tested in different placements for sensitivity and specificity in varying non-fall and fall events.
2.4 Summary and Approach
After reviewing the literature that informed this project, I sought to create a wearable device that was capable of providing feedback to the user when their strides were shuffling equivalent. Ideally, this device would be capable of distinguishing between disruptive walking events, like the user
shifting weight, and the user's shuffling or walking strides.
The choice in sensor was critical in determining placement as well as analysis. An IMU was determined to be the best fit for the intended device since it addressed the need for more than one type of sensor, was light-weight, and was compatible with the intended focus of distinguishing between two physical states (walking and shuffling) with reduced concern about external and environmental influences.
Using an IMU, both accelerometer and gyroscope data from the placement of choice will be available. A threshold-based algorithm will be capable of making use of both in order to distinguish between walking and shuffling stride without a computationally intensive method in order to provide timely feedback.
3. System Design
3.1 Identifying Characteristics
Before building the apparatus, it was critical to determine key characteristics
by which to measure and analyze the
walking profile of the user. The determination of these characteristics was essential before creating prototypes since the needed location of the IMU would determine the design, attachment, and user interaction of the apparatus.
From the literature, I decided to record from the foot near the toe, from the shin, and from the lumbar. The APDM Opal
IMU was strapped to these areas using an ' t
elastic Velcro band. Data were collected
-from a pilot set of two subjects to obtain data for developing algorithms. Protocols were approved by MIT Committee on the
Use of Humans as Experimental Subjects Figure 3.1.1: Test Sensor Placement Diagram The
and informed written consent was placement of the sensors used in identifying characteristics in provided. The subjects (one male, one order to determine the ideal placement for device purpose female) were then instructed to walk
normally for a period of time, shift their weight, and shuffle their feet. From these trials, I focused on the accelerometer and gyroscope data in order to find patterns that existed in both of these states and key distinctions or differences that could be used to distinguish them.
15 i 10 0 E, 0 (a)
~VI44~V~\/
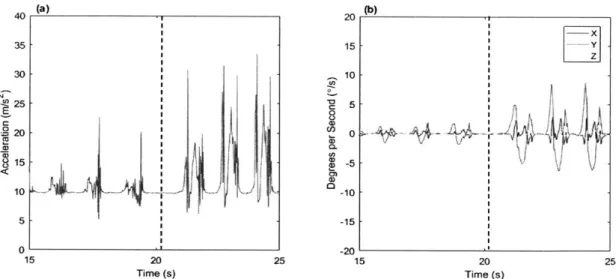
J~AhjAj~ 15 20 Time (s) 20 15 I0 0 0 g-5 0) 25 -10 -15 -20-1 (b) 5 20 Time (s) 25Figure 3.1.2: (a) Lumbar Accelerometer Pattern The accelerometer magnitude data from the lumbar
positon in the transition from shuffling to walking (b) Shin Gyroscope Pattern The gyroscope data from the shin position in the transition from shuffling to walking
I>- -x
--1
-V(a) 35 -
K-Y
* 15Z 30 10 2020 IL ' 4,, 01 20 ~ J~1I 15 20 25 1s 20 25 ime (s) Time (s)Figure 3.1.3: (a) Toe Accelerometer Pattern The accelerometer magnitude data from the toe positon in the transition from shuffling to walking (b) Toe Gyroscope Pattern The gyroscope data from the
toe position in the transition from shuffling to walking
These patterns existed in several different measurements from every recorded area shown in figures 3.1.2 and 3.1.3. For the lumbar, the accelerometer showed a pattern of peaks that were indicative the swaying movement in that area while walking. Though distinguishing between walking and shuffling was clear because of the dampened movement, reliably distinguishing strides from weight shifts was not as clear. For the shin, the gyroscope demonstrated patterns that were consistent with the stepping movements. And though, again, the dampened gyroscope movement distinguished between walking and shuffling, reliably distinguishing strides was not clear.
The lumbar and shin supported the idea of strides following a recognizable pattern that could be simplified for threshold-based analysis but did not provide data that would reliably predict the difference with a singular location. For the toe, there were patterns for both the accelerometer and the gyroscope that were not only consistent with individual strides but also had a clear distinction between shuffling, walking, and weight shifting.
As shown in Figure 3.1.3.a, the toe accelerometer magnitude pattern has a clear threshold for distinguishing between walking and shuffling profiles. This threshold paired with the gyroscope pattern shown in Figure 3.1.3.b gives a complete picture. This pattern is consistent with both walking and shuffling and is absent when the subjects were shifting their weight.
From these observations, I began to design an apparatus that allowed for the IMU to be near the toe and a method by which to communicate real time feedback to the user.
(b)
3.2 Apparatus
The apparatus consisted of two parts, a data collecting attachment and a display. The data collecting attachment was a 3D printed shoe attachment. Its purpose was to hold the electronics, provide easy access for adjustment, and send data as quickly as possible to the display. It consisted of three parts, a base, a cover, and a clip. The clip attached to the shoelace area as close to the toe as possible. The clip was designed for ease of use and simplicity. The base was crafted to hold an Arduino Uno comfortably with pins that acted as anchors for the cover. The cover snapped onto the base and has a protected but open alcove for the use of a small breadboard with the expected attachments.
Due to time constraints, the disply was Figure 3.2.1: Apparatus Placement Diagram Placement of Dumie to imcoraintsdt ip ay apparatus items on subject during testing
limited to a macro enabled workbook.
The workbook was openly displayed on a computer that was wired to the apparatus. The workbook determined if the data indicated whether or not a stride was being made and if that stride was of a walking profile or a shuffling profile. For every stride, the workbook would also make note how long the threshold-based analysis method was taking to determine if a stride was made and categorize the stride.
The electronics of the apparatus consisted of an Arduino Uno and a LSM9DSO Inertial Measurement Unit. These components were connected and held within the data collecting attachment of the apparatus and connected directly to the display.
3.3 Methods
In order to test the device, several trials were run with the female subject. Its accuracy in distinguishing between shuffling and walking strides and providing true alarms to the user were measured.
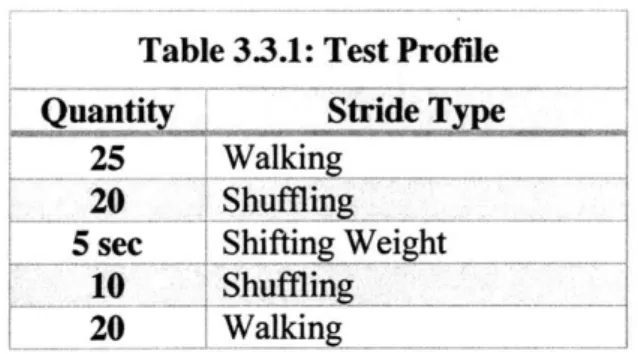
The subject attached the apparatus as shown in Figure 3.2.1. The subject executed the profile displayed in Table 3.3.1 while wearing the device. The subject walked uninterrupted and with no obstacles. While the subject walked, they paced their strides within the workbook separated from the analysis of the strides. Each stride made, the subject tapped enter. The macro-enabled workbook received information from the data collection aspect of the apparatus to determine whether or not a stride was made and categorize that stride.
Table 3.3.1: Test Profile Quantity Stride Type
25 Walking
20 Shuffling
5 sec Shifting Weight
10 Shuffling ...
1
20 Walking
Each stride was given a designation after the trial depending on how accurate it was compared to the actual strides of the subject: true positive, false negative, true negative, and false positive. A breakdown of these designations is shown in Table 3.3.2.
Table 3.3.2: Designation Description
Designation Description
True Positive Walkingprofiles correctly identified as walking
False Positive _Shuffden ed as ng
True Negative Shuffling correctly identified as shuffling
False Negative Walking in correctly identified as shuffling
Once these designations are assigned, the effectiveness of the device will be determined by it accuracy, specificity, sensitivity, and FI score. Accuracy would be the measure of trueness, or how well the device is able to determine the actual stride profile of the user. It is determined by the number of true designations out of all designated strides. Sensitivity is the true positive rate, or the proportion of positives that are correctly identified. In this case, it is the proportion of correctly identified walking profiles. Specificity is the true negative rate; it is the proportion of correctly identified shuffling profiles. The Fi score is the harmonic average of precision and sensitivity. In this case, it is a measure of the holistic accuracy of the device that includes consideration of false negatives.
During the trials, the workbook kept track of the processing time for each data point. Once each point was received, it would be compared to previous points to determine if it was an identifying characteristic in the pattern used to identify whether or not a stride was made. Once a point is identified as the final characteristic in the pattern, the entire time period of that pattern is analyzed and categorized as walking or shuffling. The processing time includes the moment from receiving the data point until its possible categorization.
4. Results and Discussion
The device made was effective in distinguishing between walking and shuffling profiles. It was also effective in making this distinction quickly. Neither the device nor the feedback method has been optimized for use with the intended target audience. This device serves as a starting point for a more developed prototype.
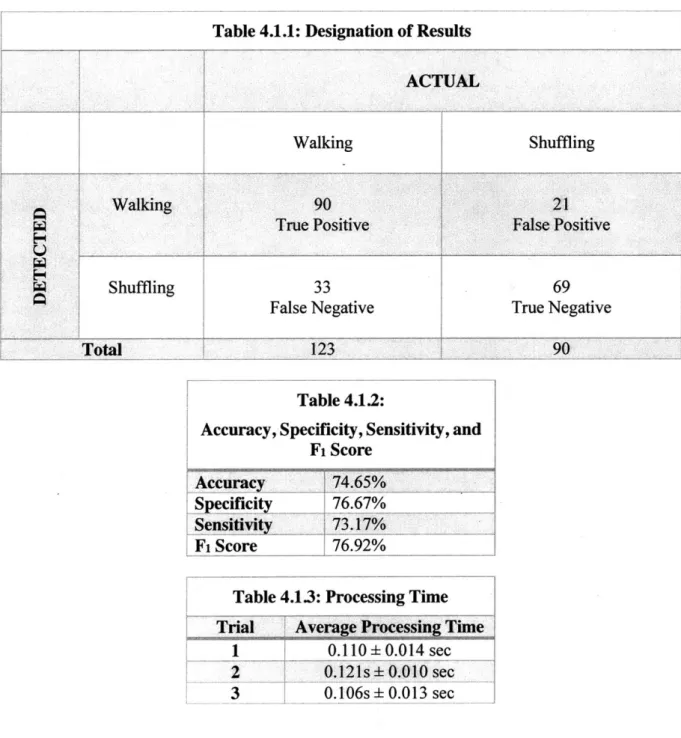
Over three trials, 225 strides were made by the subject. Of those, 213 were detected. The designation of these 213 strides are displayed in Table 4.1.1. Most of both the walking and shuffling strides were detected accurately. Most errors in the categorization of strides occurred immediately following the transition from one profile to the other. However, the error of identifying strides occurred both during transitioning and when the foot was dragged before completing a shuffling stride.
Overall, the device was correct in identifying the stride and giving the correct categorization over 74.6% of the strides. For the device, the accuracy, specificity, sensitivity, and F1 score are shown in Table 4.1.2. The average processing time (and standard deviation) for each trial is shown in Table 4.1.3.
Table 4.1.1: Designation of Results ACTUAL
Walking Shuffling
Walking 90 21
True Positive False Positive
Shuffling 33 69
False Negative True Negative
I. Total 123
Table 4.1.2:
Accuracy, Specificity, Sensitivity, and Fi Score
Specificity
76.67%Sensitivity 73.17%
F1 Score 76.92%
Table 4.13: Processing Time Trial Average ProcessingTime
1 0.110 0.014 sec 2 0.121s 0.01O sec
3 _0.106s+0.Ol3 sec__
For threshold-based algorithms with similar materials, processing times hover around 64-200 milliseconds[13]. The processing time for this device then falls into that range as expected. There were two types of errors present in identifying whether or not a stride was made, false and missed alarms. False alarms occurred when the feet were dragged during shuffling and one stride was mistaken for two. The pattern identified was present in a dampened form more than once when the foot dragged before the incomplete step. There were 6 false alarms present over the 225 strides. This occurred exclusively during shuffling strides and all 6 false alarms were categorized as shuffling strides. Missed alarms occurred during walking when transitioning to or from the shuffling stride or walking from a static state. However, the device detected almost 95% of the strides made.
The two errors in the categorization of strides comes from the threshold chosen and neglecting consideration of the initial part of strides. The threshold chosen may need to be adjusted to better reflect the stride of the user. The accelerometer magnitude was normalized to account for drifting, however, more adjustment may be needed. Additionally, the current algorithm analyzes the stride from the first key characteristic identified from the gyroscope data and not necessarily the beginning of the stride, where the highest values of the threshold typically exist.
In an integrated system, these errors would be more significant. The errors that caused the missed and false alarms would not affect the detection of strides but would affect the method and frequency of notification to the user. For example, if the consecutive number of shuffling strides determined the urgency of notification, consistent false alarms would lead to increased and unwarranted urgency. Additionally, missed alarms would lead to decreased and unwarranted leniency in these notifications. The current errors of categorization where walking is misdetected as shuffling could be disruptive to the user. However, the misdetection of shuffling as walking would prevent proper notification. The challenge then is to minimize misdetection by identifying a threshold that does not improperly notify the user of shuffling while walking but can provide proper notification of consistent shuffling.
5.
Conclusions and Future Work
To improve this device in its current iteration, I would suggest refinement of the threshold-algorithm with special consideration on the causes of the errors. In order to better identify the strides, additional pattern recognition may be necessary for instances where the foot is dragged onto the floor before lifting the incomplete step as well as patterns during transitioning periods. Once these patterns are incorporated, identifying a method to include the entirety of the stride within analysis will be necessary for a proper adjustment of the threshold.
To move forward, I would suggest modifying the apparatus to be more accessible and intuitive to the intended users. The apparatus placed on the foot is difficult to access alone with limited mobility and may not be as accessible or intuitive to the intended users for their preferred footwear. An additional objective while moving forward would be to consider a feedback method for the intended audience that is intuitive in communicating the distinguished stride profiles in a way to encourage correction that is not overwhelming. With these improvements and a feedback method, user testing will be able to further inform the future work.
6. References
[1] Trong-Nguyen Nguyen, Huu-Hung Huynh, and Meunier, J., 2016, "Skeleton-Based Abnormal
Gait Detection," Sens. 14248220, 16(11), pp. 1-13.
[2] Khandoker, A. H., Karmakar, C. K., Begg, R. K., and Palaniswami, M., 2007, "Wavelet-Based Multiscale Analysis of Minimum Toe Clearance Variability in the Young and Elderly during Walking," 2007 29th Annual International Conference of the IEEE Engineering in Medicine and Biology Society, pp. 1558-1561.
[3] Thies, S. B., Price, C., Kenney, L. P. J., and Baker, R., 2015, "Effects of Shoe Sole Geometry
on Toe Clearance and Walking Stability in Older Adults," Gait Posture, 42(2), pp. 105-109. [4] Karmakar, C. K., Khandoker, A. H., Begg, R. K., Palaniswami, M., and Taylor, S., 2007,
"Understanding Ageing Effects by Approximate Entropy Analysis of Gait Variability," 2007 29th Annual International Conference of the IEEE Engineering in Medicine and Biology
Society, pp. 1965-1968.
[5] World Health Organization, ed., 2008, WHO Global Report on Falls Prevention in Older Age,
World Health Organization, Geneva, Switzerland.
[6] Heinrich, S., Rapp, K., Rissmann, U., Becker, C., and K6nig, H.-H., 2010, "Cost of Falls in Old Age: A Systematic Review," Osteoporos. Int., 21(6), pp. 891-902.
[7] Sattin, R. W., 1992, "Falls Among Older Persons: A Public Health Perspective," Annu. Rev.
Public Health, 13(1), pp. 489-508.
[8] Society, A. G., Society, G., Of, A. A., and Prevention, 0. S. P. 0. F., 2001, "Guideline for the
Prevention of Falls in Older Persons," J. Am. Geriatr. Soc., 49(5), pp. 664-672.
[9] Khandoker, A. H., Lynch, K., Karmakar, C. K., Begg, R. K., and Palaniswami, M., 2010, "Toe
Clearance and Velocity Profiles of Young and Elderly during Walking on Sloped Surfaces,"
J. NeuroEngineering Rehabil., 7, p. 18.
[10] Gibson, A., Webb, A., and Stirling, L., 2017, "Analysis of a Wearable, Multi-Modal Information Presentation Device for Obstacle Avoidance," IEEE, pp. 1-9.
[11] Binder, S., 2002, "Injuries among Older Adults: The Challenge of Optimizing Safety and Minimizing Unintended Consequences," Inj. Prev., 8(suppl 4), p. iv2-iv4.
[12] Kaur, R., and Kaur, P. D., 2017, "Review on Fall Detection Techniques Based on Elder People," Int. J. Adv. Res. Comput. Sci., 8(3), pp. 1062-1067.
[13] Hu, X., and Qu, X., 2016, "Pre-Impact Fall Detection," Biomed. Eng. Online, 15(1), pp.
61-61.
[14] Medrano, C., Igual, R., Garcia-Magarifio, I., Plaza, I., and Azuara, G., 2017, "Combining Novelty Detectors to Improve Accelerometer-Based Fall Detection," Med. Biol. Eng. Comput., 55(10), pp. 1849-1858.
[15] Alsaaod, M., Luternauer, M., Hausegger, T., Kredel, R., and Steiner, A., 2017, "The Cow Pedogram-Analysis of Gait Cycle Variables Allows the Detection of Lameness and Foot Pathologies," J. Dairy Sci., 100(2), pp. 1417-1426.
[16] Khandelwal, S., and Wickstr6m, N., 2016, "Gait Event Detection in Real-World Environment for Long-Term Applications: Incorporating Domain Knowledge Into Time-Frequency Analysis," IEEE Trans. Neural Syst. Rehabil. Eng., 24(12), pp. 1363-1372.
[17] Aihua Mao, Xuedong Ma, Yinan He, and Jie Luo, 2017, "Highly Portable, Sensor-Based System for Human Fall Monitoring," Sens. 14248220, 17(9), pp. 1-15.
7. Appendices
7.1 Appendix A: Arduino Code
The following is the Arduino code used to pair the Arduino with the marco enable workbook. The open source and available macro enabled workbook PLX-DAQ served as a starting point for the display used.
* Arduino code is paired with Macro enabled worksheet PLX-DAQ-v2.11.xlsm
#include <SPI.h> #include <Wire.h>
#include <Adafruit Sensor.h> #include <AdafruitLSM9DSO.h>
/* Assign a unique base ID for IMU */
AdafruitLSM9DSO lsm = AdafruitLSM9DSO(1000); // Use 12C, ID #1000
#define LSM9DSOXMCS 10 #define LSM9DSO GYRO CS 9 #define LSM9DSOSCLK 13 #define LSM9DSOMISO 12 #define LSM9DSOMOSI 11 int i = 0;
int ms = 100; //select value for delay
int ledPin = 13; //pin for proper sensor working notification
/ *********************************************************************
/*
Configures the gain and integration time for the TSL2561 / *********************************************************************
void configureSensor(void)
// 1.) Set the accelerometer range
lsm.setupAccel (lsm.LSM9DSOACCELRANGE_2G); //lsm.setupAccel (lsm.LSM9DSOACCELRANGE_4G); //lsm.setupAccel(lsm.LSM9DSOACCELRANGE_6G); //lsm.setupAccel(lsm.LSM9DSOACCELRANGE_8G); //lsm.setupAccel(lsm.LSM9DSOACCELRANGE_16G);
// 2.) Set the magnetometer sensitivity
lsm.setupMag(lsm.LSM9DSOMAGGAIN_2GAUSS); //lsm.setupMag(lsm.LSM9DSOMAGGAIN_4GAUSS); //lsm.setupMag(lsm.LSM9DSOMAGGAIN_8GAUSS); //lsm.setupMag(lsm.LSM9DSOMAGGAIN_12GAUSS); // 3.) Setup the gyroscope
//lsm.setupGyro(lsm.LSM9DSOGYROSCALE_500DPS); //lsm.setupGyro(lsm.LSM9DSOGYROSCALE_2000DPS); void setup() { digitalWrite(ledPin,HIGH); #ifndef ESP8266 while (!Serial); console opens #endif // will pause
// open serial connection Serial.begin(9600);
if(!lsm.begino) {
/* There was a problem detecting connections */ digitalWrite(ledPin, while(1); digitalWrite(ledPin, L Zero, Leonardo, the LSM9DSO
etc until serial
... check your
HIGH);
OW);
// Setup the sensor gain and integration time
configureSensor();
//Serial. println ("CLEARDATA"); Serial.println ("CLEARSHEET");
// clears sheet starting at row 2
// clears sheet starting at row 1
// define columns
Serial.println("LABEL,Date,Time,Timer,AccX,AccY,AccZ,GyroX,GyroY,GyroZ
// set the names for the 3 checkboxes
Serial.println("CUSTOMBOX1,LABEL,Stop logging at 100?"); Serial.println("CUSTOMBOX2,LABEL,Resume log at 200?"); Serial.println("CUSTOMBOX3,LABEL,Quit at 300?");
// check appropriate checkboxes
Serial.println ("CUSTOMBOX1, SET,
Serial. println ("CUSTOMBOX2,SET,
Serial.println ("CUSTOMBOX3, SET,
0"); 0");
0")
void loop() {
// Get a new sensor event
sensors event t accel, mag, lsm.getEvent(&accel, &mag,
gyro, temp; &gyro, &temp); }
// simple print out Serial.print("DATA,DATE,TIME,TIMER,"); Serial.print(accel.acceleration.x); Serial.print(",");Serial.print(accel.acceleration.y); Serial.print(",");Serial.print(accel.acceleration.z); Serial.print(","); Serial.print(gyro.gyro.x); Serial.print(",");Serial.print(gyro.gyro.y); Serial.print(",");Serial.print(gyro.gyro.z); Serial.print(","); Serial.println("SCROLLDATA_20");
// check value of customboxi on PLX DAQ in Excel and if
// checkbox is checked then send the command to pause logging
if(i==100)
{
Serial.println("CUSTOMBOX1,GET");
int stoplogging = Serial.readStringUntil(10).toInt(;
// this information can be seen in the direct debug window on
PLX DAQ in Excel
Serial.println( (String) "Value of stoplogging/checkbox is: " +
stoplogging);
if (stoplogging)
Serial.println("PAUSELOGGING");
// and now resume logging
if(i==200)
Serial.println("CUSTOMBOX2,GET");
int resumelogging = Serial.readStringUntil(10).toInto;
if(resumelogging)
Serial.println("RESUMELOGGING");
// and for forced quit of Excel with saving the file first
if(i==300) Serial.println("CUSTOMBOX3,GET"); if-(Serial.readStringUntil(10).toInt()) { Serial.println("SAVEWORKBOOKAS,300-Lines-File"); Serial.println("FORCEEXCELQUIT"); } else
Serial.println("No forced Excel quit requested!");
i++;
L