HAL Id: hal-02817950
https://hal.inrae.fr/hal-02817950
Preprint submitted on 6 Jun 2020
HAL is a multi-disciplinary open access
archive for the deposit and dissemination of sci-entific research documents, whether they are pub-lished or not. The documents may come from teaching and research institutions in France or abroad, or from public or private research centers.
L’archive ouverte pluridisciplinaire HAL, est destinée au dépôt et à la diffusion de documents scientifiques de niveau recherche, publiés ou non, émanant des établissements d’enseignement et de recherche français ou étrangers, des laboratoires publics ou privés.
Labour market concentration and migration patterns in
Russia
Celine Bignebat
To cite this version:
Associé :
N° 4 / 2006
Labour market concentration and
migration patterns in Russia
C. BIGNEBAT
Labour market concentration and migration patterns in Russia
1Céline Bignebat
INRA, Institut National de la Recherche Agronomique ; UMR MOISA, Marchés Organisation Institutions et Stratégies d’Acteurs ;
Montpellier, France
August 2005
Abtract :
The following development proposes to focus on an underestimated aspect of the Russian restructuring process, namely the evolution of single industry areas throughout transition. We argue that the highly concentrated structure of the post-soviet labour market influences the transformation trend of the Russian economy: to assess this proposition, we describe the phenomenon and quantify it. Then, we use this information to investigate migration patterns in the Russian Federation: as employment is less diverse, these cities should experience outflows of inhabitants. However, we find empirical evidence that specialisation has no influence on migrations.
Keywords : labour mobility, transition, wages JEL : J6, R1, P25
Titre : concentration du marché du travail et phénomènes migratoires en Russie
L’article développe un aspect sous-estimé de la transition russe, à savoir celui de l’évolution des localités où se situe une unique entreprise. Cette structure du marché du travail caractérisée par une forte concentration du travail influence la transformation de l’économie russe. On commence par décrire ce phénomène et le quantifier. On utilise alors cette information pour étudier les flux migratoires dans les villes de la Fédération de Russie : quand les opportunités d’emploi sont moins diversifiées au niveau local, on devrait observer un solde migratoire négatif au niveau des villes. Cependant, nous montrons ici que la spécialisation très forte des villes dans un secteur n’a pas d’influence sur les migrations. On dérive alors les déterminants de celles-ci.
Mots Clefs : mobilité du travail, transition, salaires
1 Article présenté à l’ EERC les 25-26 Février 2005 à Kiev, aux Journées de l’AFSE les 19-20 Mai 2005 à
Company towns (goroda-zavody), namely towns were the largest firm employs more than half the working population, is of major interest for economic policy decisions in Russia: the federal legislation integrates this geo-economic particularity and diverse international programs are directed towards them. Implementing diversity of local productive activity is considered as a predominant goal to challenge the necessary production restructuring. Problems generated by the existence of company towns are twofold: first, downsizing the workforce of the firm leads to high unemployment rate in the town, or to outflows of workers towards other local labour markets. Moreover, the social function of the company at the municipal level has to be revised: self-governments are entitled to take over the responsibility of the social and sanitary infrastructure, such as kindergarten and hospitals.
In the next development, we study the spatial consequences of firms’ restructuring in terms of human mobility on the Russian territory. During Soviet era, especially after the establishment of the `State Committee on Labour and Social Questions' by the Ministry of Labour in 1955, high wage premium were set for remote regions to attract workers to industrial centres suffering under poor climatic conditions. Moreover, restrictions on labour mobility are numerous and keep workers from moving to areas (in the Russian case, metropolitan areas) where their qualifications are better rewarded. This is the case for Russia, where less than 2% people change their residence annually within border since 1991 (intraregional migration is excluded, : Andrienko, Guriev, 2002), a very low level compared to that experienced by, for instance, Australia (7.9%) or Norway (6.1%) in the same period. In fact, mobility restriction from rural areas and small towns to metropolitan areas (through so-called propiska) persisted throughout transition. In addition to this administrative feature, the provision of social assets by the enterprise seems to play a predominant role in workforce geographical inertia : non-monetary compensation in Russia consists mainly in the free access to hospital, catering, child care, housing … In 1998, 50% of workers received catering, 32% medical services and 34% new housing (reported by Biletsky & al., 1999). Last, the monetary cost of moving from one place to another is high considering the distance between cities.
However, programs supported by the World Bank are implemented to set incentives to move from the Northern regions to the European part of Russia: the number of potential migrants is estimated between 2 and 9 millions (Heleniak, 1999). In these regions where only a few
number of firms are present on the labour market, downsizing the firm means downsizing the city: the evaluation of the project by the World Bank (2001) concludes for some cities, among them Vorkuta that :
The only industry in Vorkuta is coal mining. The Vorkuta coal industry is affected by the coal sector crisis and by the impact of economic transition. The Government has reduced significantly the volume of subsidies for coal producers, liberalized prices and initiated coal sector privatization. This has led to restructuring, which resulted in the closure of seven of the sixteen mines in the Vorkuta area.[…] In the city of Vorkuta, the project will assist in downsizing of Vorkuta city. Specifically, the project will: (i) provide out-migration support for all residents of one non-viable settlement in the Vorkuta area; and for selected groups of the non-working population in the Vorkuta area (up to 6,500 people total); (ii) demolish housing and other facilities in one non-viable settlement and in two sections of the city of Vorkuta. (Banque Mondiale, "project appraisal …", p. 6)
We try to get an insight into migration dynamics in 1996 to 1998, that is to say before the implementation of the previously describe project. Thus, we present first an analysis of labour market concentration in Russia and, we investigate then its influence on migration patterns.
1. Concentration of labour in Russia: methodology and empirical analysis
Labour concentration in a few enterprises or branches on the local level appears only rarely in the economic literature: most of the cases deal with the emergence of company towns after the Industrial Revolution, generally mines and towns specialised in textile manufacturing. But in recent years, the attention towards highly specialised municipalities increased. This development required an analysis of the definition of company towns.
1.1. Specialisation of towns in the Russian transition
As a political target, company towns have to be defined by the law: criterions have been described which show that a precise classification of cities is difficult to establish.
The governmental decree n° 1001 from the 29 August 1994 defines a company town as a settlement were more than 30% of the active population is employed by a single enterprise or were more than 30% of the infrastructure and social sphere is owned by a single enterprise. However, the Law of the Russian Federation dated 8 January 1998 n° 6-FZ `on bankruptcy' presents another definition: company workers with their family must account for more than 50% of the total population of the city.
The divergence of indicators according to which a town is defined as a monopsony is partly due to the lack of methodological investigation in order to determine precise indicators: economic empirical studies retain generally the arbitrary level of 50% of the active population of the settlement employed by a single enterprise.
From a different point of view, one usually refers to the dependence of the municipal budget on the firm's activity: when more than 50% of the communal budget is drawn from taxes collected on revenues and benefices directly linked to the enterprise's production, the settlement should be considered as a monopsonistic area. However, we developed the Russian framework of tax retention at the local level to underline the absence of autonomy of towns: they can't fiscally depend on the firm's activity as they don't derive any monetary benefice from it.
One should however argue that mono-profile towns exist whose description is very close to that of company towns: the diversification of the productive activities matters. When facing an asymmetric sectoral shock, a mono-profile town is as vulnerable as a company town. When should then take in consideration the economic insertion of cities. Single industry areas are described as towns whose activity is dominated by one or few enterprises from the same type, belonging to the same branch, producing for a thin market segment. It may either consist in vertically integrated enterprises, for instance cities with a petrochemical complex.
The latter observation is retained in order to describe the characteristics of single industry towns. On this latter basis, 367 cities over 1068 are viewed as single industry cities: it represents 19.03 million inhabitants, namely 20.0% of the population of Russian cities (own calculations based on Brunet, 2001 and Goskomstat, 2001). Turning to the location of cities on the Russian territory, the unevenly distribution of company towns is striking: the number of one company towns in comparison with the number of cities in the oblast shows a very large diversity of situations. This ratio is ranking from 0% (Lipetsk oblast, Omsk Oblast and Chukotka autonomous okrug) to more than 60% (Sakhaline, Karelya, Kemerovo and Mourmansk oblasts). The South of Russia counts the lower concentration of company towns (Southern and Privolzhsky federal districts), followed by the Central region. Higher concentration rates are observed for the Northern region (specialized in forestry and extraction). But the highest frequency of monopsonies is revealed in the Ural region and in Siberia.
1.2. Concentration of labour and migrations
After the identification of the cities where labour concentration is high, we turn to the analysis of the influence of labour market structure on migrations out of or into these cities. We should observe migration flows implied by the industrial restructuring. In fact, economic modelling suggests that a high level of labour concentration depresses the wage level: as there are only few employment opportunities on the local labour market, workers may accept a large decrease in their wages without leaving their job. Therefore, firms enjoy a market power related to their number on a disaggregated level. Knowing the cost of moving, workers may be monetary interested in settling down in another local labour market.
By arguing this way, we are referring to the analysis of Friebel and Guriev (2000) who show theoretically and empirically that a high concentration rate of labour in few enterprises may lead to a strategic behaviour of managers in order to attach their workforce to the firm. For instance, they underlined the choice of in-kind payments, and non monetary advantages linked to the job. The cost of moving is therefore higher for workers living in company towns. In fact, we can observe a certain correlation between the regions experiencing the largest negative migration balance and the one with low diversification of employment. The Northern and Eastern regions experienced a high outmigration rate.
Map 1. Migration balance in the Russian Oblasts (1998, %)
2. Influence of labour market structure on migrations
We investigate the determinants of migration balance for Russian cities, and include in the set of exogenous variables the concentration of labour as described in the first part.
2.1. Data and empirical method
We are considering Russian urban areas, that are 956 cities (closed cities, Moscow and Saint-Petersburg don’t belong to the original sample). We dispose over a large set of socio-economic variables for all of them, which are drawn from Goskomstat: population structure (children, labour force, unemployment, and pensioners), population dynamics, average wage, average pension, public amenities, and municipal budget. We matched these data with data at the city level documenting the specialization patterns and the branch in which the major part of the workers is employed.
We can therefore estimate an equation relating the migration balance relatively to the population size with city characteristics, considered as city endowment that should reflect the attractiveness of the municipalities.
i i
i X controls
mig = β+ +ε (1)
Among them, the average wage of the employed population. We suspected this variable of being endogenous as the average wage influence the migration decision and the migration patterns has an impact on wages by letting the workforce become scarce. We implemented a Durbin-Wu-Hausman test of endogeneity for the suspected variable and conclude that we shall instrument the average wage level and turn to simultaneous equations specification. We estimate an econometric model based on simultaneous equations, wage level and migrations. i i i i Z mig controls meanwage= β+α + +ε (2) i i i i X meanwage controls mig= γ+δ + +µ
We choose an identification variable that should influence the average wage observed in the municipality without having an impact on the migration patterns experienced by the city. We decided to retain a proxy for the educational structure of the city workforce. As we don’t dispose on this precise variable, we used the proportion of the student population engaged in general basic education and that of people studying in technical higher education.
We selected a set of variables corresponding to relative advantages of cities that should influence the migration decision towards a region. As we study the migration balance of cities in 1998, the variables are lagged variables (beginning of 1997). Nominal variables are deflated by a regional price indicator from Goskomstat. Some of the variables refer to natural amenities (distance to large city centers, distance to Moscow), to monetary advantages and labour market tensions, and to population structure (children, working age people and pensioners). The variable monop indicates the cities suffering under poor employment diversification (see 1.1 for definition of a company town used in this study), and nes presents a set of dummy variables for the specialisation branch of the municipality (the sector in which we observe the major part of employment). We use the proportion of population working in the industry as we expect workers to be more mobile than others, even more when they are facing the restructuring of their industry.
Table 1. Selected variables, description
Variable Description meanwag Average real wage of the employed working population
migrrate Migration balance relative to population dist Distance to Moscow
distcap Distance to the oblast’s capital population City size (thousand of people)
ratio Number of men/number of women children Proportion of children (less than 18) pension Proportion of pensioners
indprop Proportion of working population employed in industry prodind Industrial production corrected for price
unemp Unemployment rate workage Proportion of working age population
activ Proportion of active population nes_1 Agriculture, fishery
nes_2 Food industry nes_3 Clothing, leather
nes_4 Domestic equipment nes_5 Automobile
nes_6 Shipbuilding, aeronautic and rail industry (ref) nes_7 Engineering
nes_8 Electrics, electronic nes_9 Mineral products nes_10 Textile. Nes_11 Wood and paper nes_12 Chemistry nes_13 Metallurgy
nes_14 Electric and electronic components nes_15 Fuel
nes_16 Water, gas, electricity nes_17 Building nes_18 R & D
nes_19 Military
nes_20 Railroad and tourism activities monop Company town
parttech Proportion of student engaged in higher technical studies partbase Proportion of student engaged in basic general studies
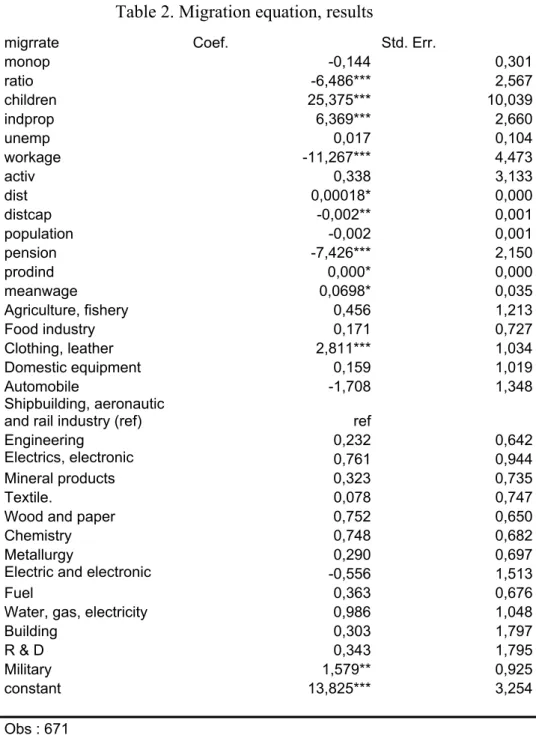
The results of the equation of interest are presented in table 2, whereas the results of the first step equation can be found in appendix.
Table 2. Migration equation, results
migrrate Coef. Std. Err.
monop -0,144 0,301 ratio -6,486*** 2,567 children 25,375*** 10,039 indprop 6,369*** 2,660 unemp 0,017 0,104 workage -11,267*** 4,473 activ 0,338 3,133 dist 0,00018* 0,000 distcap -0,002** 0,001 population -0,002 0,001 pension -7,426*** 2,150 prodind 0,000* 0,000 meanwage 0,0698* 0,035 Agriculture, fishery 0,456 1,213 Food industry 0,171 0,727 Clothing, leather 2,811*** 1,034 Domestic equipment 0,159 1,019 Automobile -1,708 1,348 Shipbuilding, aeronautic
and rail industry (ref) ref
Engineering 0,232 0,642
Electrics, electronic 0,761 0,944 Mineral products 0,323 0,735
Textile. 0,078 0,747
Wood and paper 0,752 0,650
Chemistry 0,748 0,682
Metallurgy 0,290 0,697
Electric and electronic -0,556 1,513
Fuel 0,363 0,676
Water, gas, electricity 0,986 1,048
Building 0,303 1,797 R & D 0,343 1,795 Military 1,579** 0,925 constant 13,825*** 3,254 Obs : 671 R² : 0,2491 Significance levels * : is 10 %, ** : is 5%, *** : is 1%
Whereas the dummy monop turned out to be significatively negative in the model (1), so that it increases the probability that the migrations out of the city are higher than those into the city, when we control for the endogeneity of the average wage level, the concentration of the workforce in a few firms has no impact on the migration balance.
The estimation allows describing the factors of migration in and out regions. Some of them are linked to labour market conditions: a higher average wage level, and industrial towns
attract people or give incitations to stay in the region. The population of those regions is young (among them a lot of children), whereas older people (the information is about pensioners) live in region experiencing outflows. The sex ratio of men relatively to women has a negative influence on migrations.
Labour market tightness indicators like the unemployment rate doesn’t influence migration patterns, but this variable is drawn from the number of people registered in employment agencies, so that its level doesn’t reflect the real state of the local labour market.
Conclusion:
The investigation of the migration patterns in the Russian Federation depicts a dynamics separating the country into two types of regions: we observe in some of the regions inflows that are related to the population structure and labour market signals. Especially, monetary incitation provided by higher wage levels seems to attract people to cities. Industrial regions with a young population benefit from migration into their municipalities; on the other hand, more agricultural regions inhabited by pensioners.
Appendix 1 : Descriptive statistics
Variable Obs Mean Std. Dev. Min Max meanwag 864 3,128 3,635 0,19 28,06915 migrrate 846 0,014 1,877 -21,77 20,38128 dist 956 1423,207 1550,905 16,97 7088,63 distcap 954 155,046 178,662 0,00 1525,37 population 896 97,154 170,983 1,40 1396,90 ratio 891 0,893 0,073 0,50 1,35 children 892 0,074 0,016 0,03 0,22 pension 795 0,287 0,090 0,00 0,85 indprop 799 0,096 0,063 0,00 0,43 unemp 856 0,0416 0,022 0,02 0,087 workage 892 0,565 0,050 0,26 0,72 activ 823 0,025 0,033 0,00 0,75 nes_1 946 0,019 0,137 0 1 nes_2 946 0,086 0,280 0 1 nes_3 946 0,027 0,164 0 1 nes_4 946 0,020 0,140 0 1 nes_5 946 0,016 0,125 0 1 nes_6 946 0,050 0,217 0 1 nes_7 946 0,151 0,358 0 1 nes_8 946 0,030 0,170 0 1 nes_9 946 0,060 0,238 0 1 nes_10 946 0,058 0,234 0 1 nes_11 946 0,111 0,314 0 1 nes_12 946 0,091 0,288 0 1 nes_13 946 0,071 0,257 0 1 nes_14 946 0,005 0,073 0 1 nes_15 946 0,126 0,332 0 1 nes_16 946 0,023 0,151 0 1 nes_17 946 0,002 0,046 0 1 nes_18 946 0,014 0,116 0 1 nes_19 946 0,008 0,092 0 1 nes_20 946 0,032 0,175 0 1 monop 956 0,327 0,470 0 1 parttech 692 0,077 0,040 0,01 0,49 partbase 712 0,842 0,322 0,05 8,03
Appendix 2: average wage (first stage equation)
meanwage Coef. Std. Err.
migrrate 1,959*** 0,533 ratio 13,631*** 6,060 children -61,920*** 24,086 indprop -7,329 6,136 unemp -0,084 0,168 workage 31,608*** 8,713 activ 0,219 7,020 parttech 12,736* 7,880 partbase 4,025* 2,629 monop 0,312 0,681 nes_1 -1,319 2,772 nes_2 0,211 1,660 nes_3 -3,596* 2,197 nes_4 0,509 2,307 nes_5 6,264** 3,152 nes_7 -0,116 1,465 nes_8 -1,530 2,200 nes_9 -0,992 1,686 nes_10 -0,286 1,682 nes_11 -1,196 1,513 nes_12 -1,642 1,632 nes_13 0,625 1,585 nes_14 -0,907 3,422 nes_15 1,353 1,524 nes_16 -1,253 2,440 nes_18 0,130 4,101 nes_19 -1,464 4,111 nes_20 -3,007 2,239 constant -25,531*** 6,251 Obs : 671 R² : 0,2491 Significance levels * : is 10 %, ** : is 5%, *** : is 1%
REFERENCES
Adrienko Y. and S. Guriev: 2002, Determinants of interregional mobility in Russia, CEFIR Working Paper
Biletsky S., D. Brown, J. Earle, I. Komarov and K. Sabirianova: 1999, Inside the transforming firm: report from a survey of manufacturing enterprises in Russia, SITE document paper n°142.
Brunet R.: 2001, La Russie : dictionnaire géographique, CNRS-Libergéo, La documentation française, Paris.
Friebel G. & S. Guriev, "Should I stay or Can I go ? Worker attachment in Russia", CEFIR working paper, novembre 2000.
Goskomstat: 2001, Russian statistical Yearbook , Moscow
Heleniak T.,"Migration from the Russian North during the transition period", the World Bank discussion paper 9935, 1999
Rowland R.: 1998, Metropolitan population change in Russia and the former Soviet Union 1897-1997, Post Soviet Geography¸ 5, pp. 148-65
World Bank, "Project appraisal document on a proposed loan in the amount of US$ 80 million equivalent to the Russian Federation for a Northern restructuring project", World Bank development sector unit, mai 2001.