HAL Id: hal-01864314
https://hal-univ-rennes1.archives-ouvertes.fr/hal-01864314
Submitted on 24 Jan 2019HAL is a multi-disciplinary open access archive for the deposit and dissemination of sci-entific research documents, whether they are pub-lished or not. The documents may come from teaching and research institutions in France or abroad, or from public or private research centers.
L’archive ouverte pluridisciplinaire HAL, est destinée au dépôt et à la diffusion de documents scientifiques de niveau recherche, publiés ou non, émanant des établissements d’enseignement et de recherche français ou étrangers, des laboratoires publics ou privés.
Contrasting responses of bacterial and fungal
communities to plant litter diversity in a Mediterranean
oak forest
Mathieu Santonja, Quentin Foucault, Anaïs Rancon, Thierry Gauquelin,
Catherine Fernandez, Virginie Baldy, Pascal Mirleau
To cite this version:
Mathieu Santonja, Quentin Foucault, Anaïs Rancon, Thierry Gauquelin, Catherine Fernandez, et al.. Contrasting responses of bacterial and fungal communities to plant litter diversity in a Mediterranean oak forest. Soil Biology and Biochemistry, Elsevier, 2018, 125, pp.27-36. �10.1016/j.soilbio.2018.06.020�. �hal-01864314�
Title: Contrasting responses of bacterial and fungal communities to plant litter diversity in a
1
Mediterranean oak forest
2 3
Authors: Mathieu Santonja1,2,3,4¶*, Quentin Foucault1,5¶, Anaïs Rancon1, Thierry Gauquelin1, 4
Catherine Fernandez1, Virginie Baldy1, Pascal Mirleau1*
5 6
Addresses 7
1. Aix Marseille Univ., Univ. Avignon, CNRS, IRD, IMBE, Marseille, France. 8
2. Univ Rennes, CNRS, ECOBIO UMR 6553, F-35000 Rennes, France. 9
3. Ecole Polytechnique Fédérale de Lausanne (EPFL), School of Architecture, Civil and 10
Environmental Engineering (ENAC), Laboratory of Ecological Systems (ECOS), Station 2,
11
1015 Lausanne, Switzerland.
12
4. Swiss Federal Institute for Forest, Snow and Landscape Research (WSL), Site Lausanne, 13
Case postale 96, 1015 Lausanne, Switzerland.
14
5. Molecular Ecology Group, Senckenberg Biodiversity and Climate Research Centre, 15
Senckenberganlage 25, 60325 Frankfurt am Main, Germany.
16 17
¶ = equal contribution to the work 18
19
* = corresponding authors
20
Mathieu Santonja (mathieu.santonja@gmail.com); ORCID: 0000-0002-6322-6352
21
Pascal Mirleau (pascal.mirleau@imbe.fr)
22 23
Abstract 24
Tree species diversity of forested ecosystems control the diversity of leaf litter inputs to
25
the soil, with cascading effects on the microbial communities colonizing decomposing litter.
26
However, the extent to which bacterial and fungal communities inhabiting the litter layer are
27
affected by shifts in tree species diversity is not well understood. To investigate the role of litter
28
species diversity, litter species identity and litter functional traits on bacterial and fungal
29
communities of a typical Mediterranean oak forest, we set up a yearly field litterbag experiment
30
that considered leaf litter mixtures of four abundant species: Quercus pubescens, Acer
31
monspessulanum, Cotinus coggygria and Pinus halepensis. We found that both bacterial and 32
fungal communities varied strongly during decomposition but showed distinct succession
33
patterns. Both communities were also strongly influenced by litter species diversity, litter
34
identity and litter functional traits. The intensity and the direction of these effects varied during
35
decomposition. Litter diversity effects were mediated by litter species composition rather than
36
litter species richness, highlighting the importance of litter species identity - and associated
37
litter traits - as drivers of microbial communities. Both the “mass-ratio hypothesis”, measured
38
through the community weighted mean (CWM) litter traits, and the “niche complementarity
39
hypothesis”, measured through the functional dissimilarity (FD) of litter traits, contributed to
40
litter diversity effects, with a greater relative importance of FD compared to CWM, and with
41
an overall stronger impact on fungal than on bacterial communities. Interestingly, increasing
42
FD was related to decreasing bacterial diversity, but increasing fungal diversity. Our findings
43
provide clear evidence that any alteration of plant species diversity produces strong cascading
44
effects on microbial communities inhabiting the litter layer in the studied Mediterranean oak
45
forest.
46 47
Keywords: Bacteria; fungi; litter decomposition; litter traits; Mediterranean forest; plant-soil 48 interaction 49 50 1. Introduction 51
Alterations of plant communities due to ongoing global change, including climate,
land-52
use and resource availability changes, have already been observed and are presumed to continue
53
(Vitousek et al., 1997; Walther et al., 2002; van der Knaap et al., 2018). Studies of the
54
relationship between plant species diversity and ecosystem functioning have received growing
55
attention in the last decade (Diaz and Cabido, 2001; Loreau et al., 2001). The majority of such
56
studies investigated how plant diversity affects litter decomposition efficiency (Gartner and 57
Cardon, 2004; Hättenschwiler et al., 2005), but only a few have examined how it affects the
58
organisms running the process (Bardgett and Shine, 1999; Leloup et al., 2018). Soil
59
microorganisms are indeed major drivers of litter decomposition and mineralization (Bardgett, 60
2005; de Graff et al., 2010) and their responses to changes of leaf litter diversity should interact
61
with the decomposition process efficiency.
62
Litter microbial communities are strongly influenced by the quantity and the quality of
63
litter input from the plant community (Calderon et al., 2001; Lalor et al., 2007). Differences in
64
litter quality among tree species have been reported to affect the abundance and composition of
65
soil bacterial and fungal communities (Grayston et al., 1998; Aponte et al., 2013; Prescott and 66
Grayston, 2013). Both nitrogen (N) and phosphorus (P) availabilities actually shape microbial
67
decomposer communities as they are often limiting elements in the soil and play a central role
68
in resource competition (Cleveland and Liptzin, 2007; Mooshammer et al., 2014). Other plant
69
litter traits such as secondary metabolites are recognized to repress the biomass and activity of
70
microbial communities (Fierer et al., 2001; Ushio et al., 2013; Chomel et al., 2014, 2016). For
71
instance, Chomel et al. (2014) observed a negative correlation between phenolic concentrations
72
and fungal biomass during litter decomposition in a Mediterranean pine forest, calling attention
to the inhibitory effect of phenolic compounds from pine leaf litter toward fungi (Kainulainen 74
et al., 2003; Kraus et al., 2003; Hättenschwiler et al., 2005). Likewise, Amaral and Knowles 75
(1998) reported that monoterpenes inhibited the activity and growth of certain soil microbial
76
groups while stimulating others.
77
However, in most natural ecosystems, litter material from various plant species
78
decomposes together. As key actors of litter decomposition, microbial communities are likely
79
responding to the variation in species composition of the litter input that determines litter
80
functional diversity. According to the “mass-ratio hypothesis” (Grime, 1998), ecosystem
81
properties are strongly related to the relative input of each species, implying that functional
82
traits of the dominant plant species mainly determine ecosystem function (Garnier et al., 2004)
83
and thus the litter trait control over microbial communities changes along community-weighted
84
mean (CWM) trait values. Alternatively, the “niche complementarity hypothesis” argues that
85
the functional diversity (FD) of trait-values promotes an ecosystem’s functioning (Petchey and 86
Gaston, 2006; Diaz et al., 2007), for instance, by improving the availability of complementary
87
resources for microbial communities (Wardle et al., 1997; Barantal et al., 2014; Handa et al., 88
2014). These two mechanisms can operate simultaneously by affecting microbial communities
89
as a result of plant (litter) composition change. However, our knowledge about the relative
90
importance of these theories in controlling microbial decomposer communities is very limited.
91
The influence of tree species diversity on litter microbial communities has been studied
92
in boreal, temperate and tropical ecosystems, while information from Mediterranean
93
ecosystems is extremely scarce (e.g. Shihan et al., 2017; Santonja et al., 2017a, 2017b).
94
Mediterranean forests have a different species composition than temperate forests due to the
95
Mediterranean climate characteristics that have shaped species distribution (Quézel and Médail, 96
2003). Remarkable contrasts of temperature and humidity across seasons, and in particularly
97
the summer drought period, correspond to particular leaf litter traits, including secondary
metabolites (Chomel et al., 2014; Chomel et al., 2016; Hashoum et al., 2017), that have the
99
potential to influence microbial decomposer communities (Schimel et al., 2007; Williams and 100
Rice, 2007; Brockett et al., 2012).
101
In this study we assessed the potential consequences of a forest composition shift on
102
microbial communities associated with decomposing leaves, including both loss and gain of
103
tree species. We conducted a full-factorial in situ decomposition experiment over a gradient of
104
litter species diversity in a Mediterranean downy oak forest. Downy oak (Quercus pubescens
105
Willd.) is broadly distributed from northern Spain to the Caucasus (Quézel and Médail, 2003),
106
and is the dominant species structuring many forests of the northern parts of the Mediterranean
107
basin. We used leaf litter from the three dominant woody plant species naturally present in the
108
forest (Q. pubescens, Acer monspessulanum L. and Cotinus coggygria Scop.) and one pine
109
species (Pinus halepensis Mill.), which may become more frequent in downy oak forest in the
110
future in response to climate change (i.e. under warmer and drier environment; Gaucherel et 111
al., 2008; Bede-Fazekas et al., 2014). We aimed to determine the effects of (i) litter species
112
richness, (ii) litter species composition, (iii) litter species identity and (iv) litter functional trait
113
values on the dynamics of microbial communities, during one-year leaf litter decomposition.
114
Using fingerprinting methods, we explored in parallel fungal and bacterial community
115
dynamics at six time points, expecting to reveal differences across microbial decomposers
116
groups that have distinct trophic niches (Boer et al., 2005; Buée et al., 2009; Lopez-Mondejar 117
et al., 2015). We hypothesized that H1: microbial diversity and community structure associated
118
to decomposed leaves or needles change with decomposition time, as the litter quality changes
119
over the course of decomposition (Snajdr et al., 2011; Baldrian et al., 2012); H2: microbial
120
diversity increases with the increase of litter species richness, by increasing resource diversity
121
and microhabitat heterogeneity; H3: microbial community parameters (diversity and
122
community structure) are also determined by the plant identity in the litter mixture, as
differences of litter quality among plant species would lead to distinct effects on microbial
124
community parameters; H4: microbial diversity responds to “niche complementarity
125
hypothesis” rather than to “mass-ratio hypothesis”, as litter mixtures with contrasting litter
126
quality improve the availability of different resources and microhabitat for microorganisms. We
127
also hypothesized that H5: the relationships between microbial decomposers and litter diversity
128
decrease with decomposition time, as resource diversity changes during leaf litter
129
decomposition, leading to homogenization of litter quality across litter mixtures.
130 131
2. Materials and methods 132
133
2.1. Study site
134
This study was conducted in the Oak Observatory at the OHP (O3HP) experimental site 135
located in the research center “Observatoire de Haute Provence”, 60 km north of Marseille,
136
South of France (43°56’115” N, 05°42’642” E). The site is 680 m above sea level, and presents
137
a mean annual temperature of 11.9 °C and a mean annual precipitation of 830 mm (1967 - 2000
138
period, WMO standard temperature and precipitation: 1960-2003 St Michel l’Observatoire /
139
Meteo France 04192001; 2003-2010 Dauphine / Meteo France 04068001 - on and close to the
140
OHP, respectively). Temperature and rainfall during the experiment showed a seasonal
141
distribution characteristic of a Mediterranean climate, with maximum rainfall in June and
142
October, maximum temperature in July and August, and a dry summer season lasting less than
143
two months, typical of a supramediterranean bioclimatic stage (Supplementary Fig. S1).
144
According to the French Référentiel Pédologique (Baize and Girard, 1998), the soil is a pierric
145
calcosol (with S horizon between limestone rocks) or a calcarisol when limestone appears less
146
than 25 cm deep. The pH is between 6.5 and 7.5 for the A horizon and 7.5 the for S horizon.
According to the WRB classification (IUSS Working group WRB, 2006) the soil can be
148
classified as a mollic leptosol.
149
The study site is a Mediterranean natural old-growth oak forest belonging to the site
150
Natura 2000 “FR9302008 Vachères”, in which 53 different plant species were identified. This
151
forest already existed in the late 18th century (Hilaire et al., 2012) and was managed for
152
centuries by coppicing. Q. pubescens (Downy oak: 75% coverage) and A. monspessulanum
153
(Montpellier maple: 25% coverage) are the two dominant tree species, with understory
154
vegetation dominated by C. coggygria (smoke tree: 30% coverage). P. halepensis (Aleppo pine)
155
is present very close to the downy oak forest but only in open environments.
156 157
2.2. Experimental set-up
158
This experiment used litter of four species: A. monspessulanum, C. coggygria, P.
159
halepensis and Q. pubescens that will be named Acer, Cotinus, Pinus and Quercushereafter.
160
Freshly abscised leaves of the four species were collected over the whole period of maximum
161
litter fall from October to November using litter traps suspended under the relevant species.
162
Leaves were dried at ambient temperature and stored until the beginning of the experiment.
163
Leaf litter decomposition was studied for 320 days using the litterbag method (Swift et 164
al., 1979). Litterbags measuring 20 cm × 20 cm with a mesh size of 4 mm were filled with 10
165
g of dry leaf litter and placed in the field in January. Fifteen species mixtures were made with
166
an equal partitioning on a dry mass basis between species: a single-mixture litter for each
167
species (four types), all possible two-species mixture combinations (six types), all possible
168
three-species mixtures (four types) and a four-species mixture. There were thus 15 treatments,
169
comprising four levels of species richness: 1, 2, 3 and 4 species. A total of 360 litterbags (15
170
types × 6 sampling dates × 4 replicates) were used for the experiment. We used a nested
171
experimental design with four blocks of 100 m2 (spaced of 10 m) where replicates were
randomly scattered and spaced of 1 m in each block. We retrieved four replicates of each
173
treatment (i.e. one per block) every 50 (all the sampling dates) or 70 days (the last sampling
174
date, because violent rain events prevented sampling).
175
After removal, litterbags were immediately sealed in plastic bags to prevent loss of litter
176
material, and transported to the laboratory. Leaves were separated according to species, which
177
was possible even with small fragments of litter owing to marked morphological differences
178
among species. To prevent contamination of litter by soil, we wiped each leaf thoroughly before
179
analysis. Samples were freeze-dried (Lyovac GT2®), weighed and ground to powder.
180 181
2.3. Litter traits
182
Four litter samples of each species were taken to determine the initial characteristics of
183
the litter (Supplementary Table S1). Carbon (C) and nitrogen (N) content of the litters were
184
determined by thermal combustion on a Flash EA 1112 series C/N elemental analyzer (Thermo
185
Scientific, USA).
186
Phosphorus (P) was extracted with 20 ml of nitric acid from remaining dry ash after
187
combustion of 0.5 g of subsamples at 500 °C for 5 h in a muffle furnace. The pH was adjusted
188
to 8.5 with a 40% NaOH solution; 1 ml of each sample, 0.2 ml of mixed reagent (emetic tartar
189
and ammonium molybdate solution), 0.04 ml of ascorbic acid and 0.76 ml of distilled water
190
were placed directly in a spectrophotometer microcuvette. After 150 min, the reaction was
191
completed, and phosphorus concentration was measured at 780 nm with a UV/Vis
192
spectrophotometer (Thermo Scientific, USA).
193
Total phenolic concentrations were measured colorimetrically by the method of
194
Peñuelas et al. (1996) using gallic acid as a standard. A 0.25 g litter sample was dissolved in 20
195
ml of a 70% aqueous methanol solution, shaken for 1 h and then filtered (0.45 µm filter); 0.25
196
ml of filtered extract was mixed with 0.25 ml Folin-Ciocalteu reagent (Folin and Denis, 1915),
0.5 ml of saturated aqueous Na2CO3 (to stabilize the color reaction) and 4 ml of distilled water. 198
After 60 min, the reaction was completed, and concentration of phenolics was measured at 765
199
nm on a UV/Vis spectrophotometer (Thermo Scientific, U.S.A.).
200
Terpenes were extracted from 0.5 g of litter sample with 5 ml of dichloromethane, and
201
50 µl of an internal standard (dodecane) was added. The samples were filtered and then
202
analyzed by gas-chromatography/mass-spectrometry (GC-MS) on an Agilent HP6890 system
203
equipped with an MSD5973 Network mass detector, an ALS7673 automatic injector and an
204
HP5-MS apolar column (30 m × 0.25 mm × 0.25 µm; J&W Agilent Technologies, Crawford
205
Scientific, Lanarkshire, Scotland, UK). Retention indices were determined relative to injected
206
Wisconsin Diesel Range Hydrocarbons (Interchim, Montluçon, France) and confirmed by
207
comparison against expected literature values (Adams, 2007). Finally, the total terpene
208
concentration was measured as the sum of each of the individual terpene compounds.
209
To assess the “mass-ratio hypothesis”, we calculated the community-weighted mean
210
traits (CWM) of the litter mixtures as the average trait values of the litter mixtures following
211
Garnier et al. (2004) as TraitCWM = ∑𝑛𝑖=1𝑝𝑖 × 𝑡𝑟𝑎𝑖𝑡𝑖 where pi is the relative abundance for
212
species i and traiti is the trait value for species i. To assess the “niche complementarity
213
hypothesis”, we calculated functional dissimilarity (FD) of litter mixtures according to Rao’s
214
quadratic entropy (Botta Dukat, 2005) for each litter mixture as: TraitFD = ∑ni=1∑nj=1𝑝𝑖𝑝𝑗 ∗ 𝑑𝑖𝑗 215
where pi and pj are the relative abundance for shrub species i and j in the litter mixture, and dij
216
the Euclidian distance between species i and j for the trait considered. Because the measured
217
traits differ in their units, we used normalized values (using a z-scored standardization so as to
218
get a mean of zero and a standard deviation of one) to calculate functional dissimilarity.
219
According to the “mass-ratio hypothesis”, the highest scores of CWM are reached for species
220
within the mixture that exhibit the highest trait values. On the other hand, according to the
221
“niche complementarity hypothesis”, the highest scores of FD are reached for very dissimilar
litter species within the mixture. Since we predicted that microbial diversity responds to the
223
“niche complementarity hypothesis” rather than to the “mass-ratio hypothesis” (i.e. research
224
hypothesis H4), we expect that the increase in microbial diversity to be better correlated to the
225
increase in FD values than to the increase in CWM values.
226 227
2.4. Bacterial and fungal communities
228
Extraction of microbial cells from litter was achieved by washing 100 mg of
freeze-229
dried ground litter material with 1.5 ml of sterile saline solution (0.9 % NaCl; w/v). The
230
suspension was mixed by vortexing for 5 s and then centrifuged for a few seconds in order to
231
pellet the leaf residues. Microorganisms were recovered from the supernatant following transfer
232
to a new microtube and being centrifuged (16000 g, 30 min) to form a microbial pellet that was
233
frozen at -20°C until DNA extraction. Total DNA was extracted from each microbial sample
234
by using the PowerSoil-htp 96 wells DNA isolation kit (MoBio, Laboratories, Inc.), adjusting
235
the protocol to the use of a vacuum manifold. DNA samples were stored at -20°C until analysis.
236
We used Automated Ribosomal Intergenic Spacer Analysis (ARISA) to characterize
237
bacterial communities (Ranjard et al., 2001), and terminal Restriction Fragment Length
238
Polymorphism (tRFLP) to characterize fungal communities (Liu et al., 1997). The bacterial
239
16S-23S rDNA Intergenic Spacer (ITS) was amplified using the primers
[6fam]-s-d-Bact-1522-240
b-S-20 (5’-TGCGGCTGGATCCCCTCCTT-3’) and L-D-Bact-132-a-A-18
(5’-241
CCGGGTTTCCCCATTCGG-3’). The fungal 18S-5,8S ITS1 region was amplified using the
242
primers [HEX]-ITS1-F (5’-CTTGGTCATTTAGAGGAAGTAA-3’; Gardes and Bruns, 1993)
243
and ITS4 (5’-TCCTCCGCTTATTGATATGC-3’; White et al., 1990). Both PCR reactions
244
were performed in 20 µl mixtures containing 200 µM dNTPs, 5 % (v:v) DMSO, 0.5 µM of each
245
primer and 0.25 units GoTaq DNA-polymerase with the corresponding 5X PCR buffer
246
(Promega). After initial denaturation at 94°C for 5 minutes, we ran 35 cycles of: denaturation
at 94°C for 1 minute, followed by annealing at 55°C for 1 minute, elongation at 72°C for 1
248
minute and a final elongation at 72°C for 10 minutes. PCR products of the fungal ITS were
249
digested by adding 5 U of HinfI restriction enzyme and 2 µl of the corresponding restriction
250
buffer (Fermentas). Following verification of the ARISA and tRFLP products by using 2%
251
NuSieve-agarose gel electrophoresis, these products were diluted with sterile distilled water
252
(1/20), and analyzed with a capillary sequencer ABI 3730 (Applied Biosystem). One microliter
253
of the diluted sample was mixed with 0.8 µl of GeneScan-2500 ROX-labelled size standard and
254
8 µl of deionized formamide; denaturation was completed at 95°C for 5 min before capillary
255
electrophoresis in the POP-7 polymer, during 3 h with 7.5 kV run-voltage. The output series of
256
peak-sizes corresponding to bacterial or fungal operating taxonomic units (OTUs) were
257
analyzed by using the GeneMapper® v4.1 program (Applied Biosystem). Size standard peaks
258
were defined individually, parameters of the internal AFLP-method were set up in order to
259
detect peak-sizes in the 300-1200 bp range, with bin-windows set up to one bp and lower
260
detection limits of peak-heights fixed individually at values ranging from 1 to 100 Raw
261
Fluorescent Units (RFUs).
262 263
2.5. Statistical analyses
264
Statistical analyses were performed with the PRIMER-E software (version 6.1,
Primer-265
E Ltd, Plymouth, United Kingdom) for multivariate analyses, and with the R software (version 266
3.3.1, The R Foundation for Statistical Computing, Vienna, Austria) for univariate analyses. 267
Bacterial and fungal OTU (Operational Taxonomic Unit) - abundance matrices based
268
on ARISA and tRFLP fingerprints were analyzed with PRIMER-E. The “DIVERSE” routine
269
was ran to obtain the Shannon’s indices of diversity (H’ = -Ʃ pi × log10pi), where pi is the
270
proportion of the total abundance arising from the ith species. The abundance value of each
271
OTU was standardized by total abundance of the sample and then log-transformed (Log X+1)
before generating Bray-Curtis similarity matrices with minimum transformed-value as a
273
dummy variable. To visualize distance between samples, we used Principal Coordinate
274
Ordination (PCO) plots. We assessed whether microbial community structure differed
275
according to the time of decomposition, the litter diversity and the presence of plant species in
276
the litter mixtures by using analysis of similarity (ANOSIM) routine and multivariate analysis
277
of variance (PERMANOVA) that was set up with 9999 permutations and unrestricted
278
permutation of raw data method. The dispersion of the microbial communities shown by the
279
PCO was studied using the PERMDISP routine. We determined bacterial and fungal
280
communities’ turnover rates during litter decomposition (Supplementary Table S2;
281
Supplementary Fig. S2) for each litter mixture treatment, as the linear regression estimate of
282
Bray-Curtis dissimilarity changes, between samples collected after 50 days decomposition and
283
all successive collection dates (i.e. following 100, 150, 200, 250 and 320 days decomposition).
284
We used a general linear model approach to test for the effects of litter diversity
285
(separated in i) litter species composition, ii) litter species richness, iii) litter species identity
286
and iv) litter functional traits) on bacterial and fungal diversity. Due to the large number of
287
potentially important predictors, we carried out three distinct statistical models. The first model
288
tested the impact of litter diversity (decomposed in litter species richness and litter species
289
composition), time of decomposition (expressed as harvest date) and block on bacterial and
290
fungal diversity (expressed as the Shannon-Wiener index). The second model tested the impact
291
of litter species identity (i.e. the presence/ absence of a particular species), time of
292
decomposition and block on bacterial and fungal diversity.
293
For a more detailed understanding of how the diversity of leaf litter affected microbial
294
diversity, we evaluated the effects of mean traits (TraitCWM) and functional trait dissimilarities 295
(TraitFD) of the 8 measured litter traits (Supplementary Table S1). A principal component 296
analyses (PCA), based on these 8 litter traits across litter mixtures, allowed to define the two
first components of each PCA (i.e. CWM1 and CWM2, and FD1 and FD2) as characteristic
298
vectors of CWM and FD, respectively. We then performed a third model in order to decipher
299
the relative contributions of CWM1, CWM2, FD1, FD2, time of decomposition and block on
300
bacterial and fungal diversity.
301
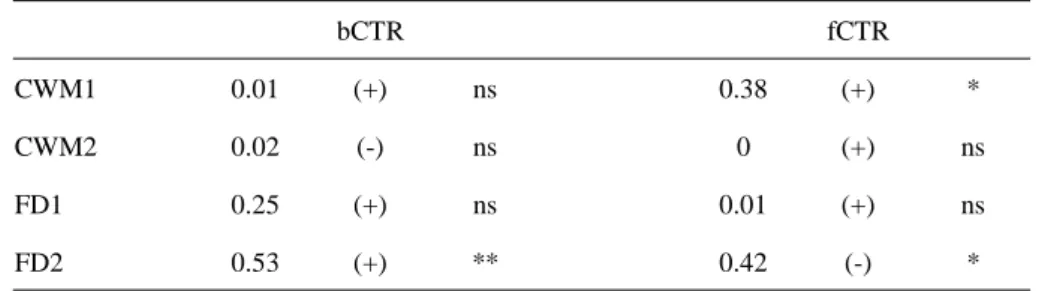
Finally, we performed regressions analyses to test for the relationships between litter
302
functional traits (TraitCWM and TraitFD) and bacterial and fungal community turnover rates 303 (Supplementary Table S2). 304 305 3. Results 306 307
3.1. Microbial community dynamics during decomposition
308
Overall, 746 bacterial and 448 fungal OTUs were detected in the litter during this
309
experiment. Time of litter decomposition explained the largest proportion of the variation in
310
microbial diversity (Tables 1-3). Bacterial diversity increased at the beginning of litter
311
decomposition and remained constant from 150 days to the end of the experiment (Fig. 1a).
312
Fungal diversity increased during decomposition and reached its maximum value after 320 days
313
of litter decomposition (Fig. 1d). Microbial community dissimilarities varied importantly
314
during time of litter decomposition (PERMANOVA, bacterial community: Pseudo-F = 15.5, P
315
< 0.001; fungal community: Pseudo-F = 19.1, P < 0.001). Both bacterial and fungal
316
communities changed during the decomposition experiment (Supplementary Fig. S3). While
317
the dissimilarity among fungal communities remained steady during decomposition
318
(Supplementary Fig. S3b), the dissimilarity among bacterial communities decreased leading to
319
the homogenization of bacterial community across mixtures over time (Supplementary Fig. 320
S3a).
321 322
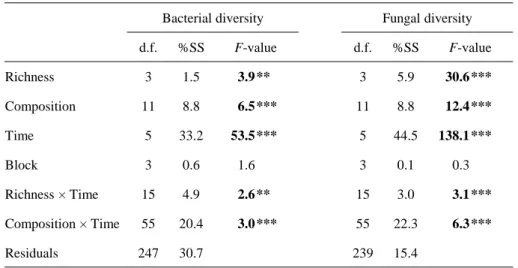
3.2. Litter diversity effects on microbial communities
323
Litter species composition accounted for a higher portion of the overall variance of
324
microbial diversity than litter species richness (Table 1; Supplementary Table S3). Bacterial
325
diversity was higher in the three- and four-species litter mixtures compared to the single and
326
two-species litter mixtures (Fig. 1b). Fungal diversity was the lowest in single-species litter
327
mixtures; it increased with increasing species richness and reached its maximum value in the
328
three- and four-species litter mixtures (Fig. 1e). Microbial diversity differed among the 15 litter
329
species combinations (Figs. 1c and 1f). However, the litter mixture effects on microbial
330
diversity, including both litter species composition and litter species richness, varied during the
331
course of the decomposition (Litter species richness × Time and Litter species composition ×
332
Time interactions, Table 1). Specifically, bacterial diversity was partially affected by litter
333
species richness (i.e. after 100, 200 and 320 days of decomposition; Supplementary Table S3;
334
Figs. 2b, 2d and 2f), while fungal diversity was affected by litter species richness during all the
335
decomposition process, but not after 320 days of decomposition (Supplementary Table S3; Fig. 336
2l). Litter species composition affected microbial diversity throughout the decomposition
337
periods, except for bacterial diversity after 150 days (Supplementary Table S3).
338
Litter species richness influenced the fungal community dissimilarity by increasing the
339
resemblance of community in multi-species litter mixtures compared to single-species litter
340
(PERMANOVA, Pseudo-F = 2.67, P < 0.01). On the contrary, litter species richness had no
341
effect on the bacterial community dissimilarity (PERMANOVA, Pseudo-F = 1.08, P = 0.2403).
342
Litter species composition strongly influenced fungal communities, but had reduced effects on
343
bacterial communities (Supplementary Fig. S4b).
344 345
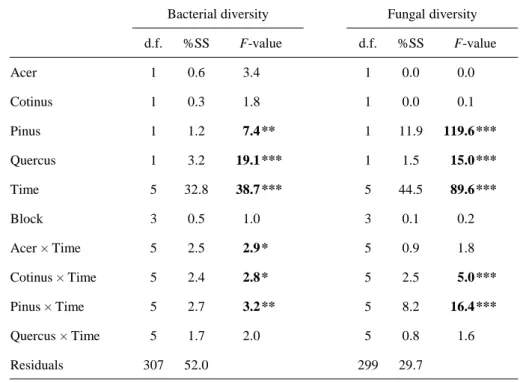
3.3. Litter identity effects on microbial communities
Measuring the response of microbial diversity to the presence of each plant species in
347
the mixtures revealed the major effects of Quercus, that increased both bacterial and fungal
348
diversities all along the decomposition process and the effect of Pinus that increased
349
specifically fungal diversity at most sampling time. Except for Quercus, the effects of the three
350
other plant species on microbial diversity strongly depended on decomposition time (Table 351
2). The presence of Acer enhanced bacterial diversity after 100 and 320 days of decomposition
352
(Time × Acer presence interaction, Table 2; Fig. 3a). Cotinus decreased both bacterial and
353
fungal diversities after 50 days of decomposition and, on the opposite, positively affected both
354
bacterial and fungal diversities at later decomposition stages (Time × Cotinus presence
355
interaction, Table 2; Figs. 3b and 3f). The presence of Pinus enhanced fungal diversity until
356
250 days of decomposition, whereas Pinus decreased both bacterial and fungal diversities after
357
320 days of decomposition (Time × Pinus presence interaction, Table 2; Figs. 3c and 3g).
358
Presence of Quercus enhanced both bacterial and fungal diversities throughout the
359
decomposition process (Table 2; Figs. 3d and 3h).
360
Microbial community dissimilarities also differed according to the identity of the plant
361
species in the litter mixture (Supplementary Fig. S5). The bacterial community dissimilarity
362
was affected by the presence of Acer (ANOSIM, R = 0.16, P < 0.001; Supplementary Fig. S5a)
363
and Pinus (ANOSIM, R = 0.13, P < 0.001; Supplementary Fig. S5e), but not by the presence
364
of Cotinus or Quercus. The fungal community dissimilarity was mainly affected by the presence
365
of Pinus (ANOSIM, R = 0.32, P < 0.001; Supplementary Fig. S5f) and to a lower extent by
366
Acer (ANOSIM, R = 0.18, P < 0.001; Supplementary Fig. S5b). Interestingly, the influence of
367
Quercus on fungal community dissimilarity was covered by the influence of Pinus (ANOSIM, 368
R = 0.16, P < 0.001; Supplementary Fig. S5h). In other words, the presence of Quercus had a
369
different effect on litter mixtures either containing or excluding Pinus.
370 371
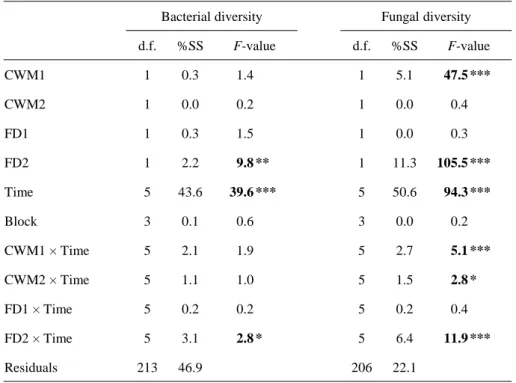
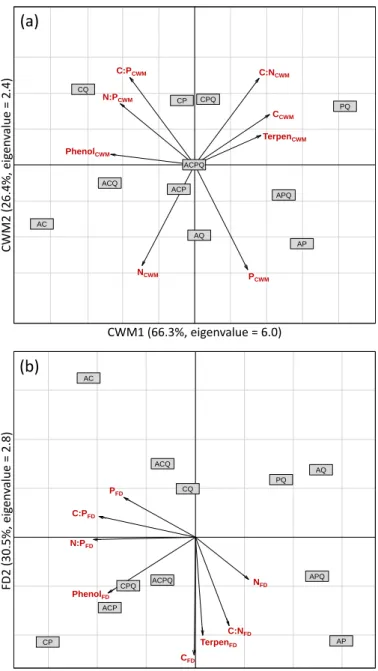
3.4. Control of microbial communities by mass ratio or niche complementarity hypothesis
372
Principal component analysis of CWM traits showed that the first PCA axis (CWM1),
373
explaining 66.3% of traits variation, was determined mainly by high C and terpen
374
concentrations and low phenolic concentration (Fig. 4a). The second PCA axis (CWM2),
375
explaining 26.4% variation, was related mainly to high values of C:N and C:P ratios, and low
376
values of N and P concentrations (Fig. 4a). Principal component analysis of FD traits showed
377
that the first PCA axis (FD1), explaining 45% of trait dissimilarity variation, was related mainly
378
to increasing dissimilarities of phenolic concentration, and of C:P and N:P ratios (Fig. 4b). The
379
second axis (FD2), explaining 30.5% variation, was related mainly to increasing dissimilarity
380
of terpen and C concentrations, and of C:N ratio (Fig. 4b).
381
When evaluating jointly the effects of CWM and FD traits, we found that bacterial
382
diversity was mostly controlled by time of decomposition, FD2 and the interaction FD2 × time
383
of decomposition (Table 3). Increasing FD2 scores (i.e. decreasing functional dissimilarity of
384
terpen, C and C:N ratios) were related to higher bacterial diversity index after 200, 250, and
385
320 days of decomposition, as indicated by the FD2 × time of decomposition interaction (Table 386
3; Fig. 5) and by the negative relationship between the bacterial communities turnover rate and
387
FD2 (Table 4).
388
In contrast to bacterial diversity, both CWM and FD traits strongly controlled fungal
389
diversity (Table 3). Fungal diversity was significantly affected by time of decomposition,
390
CWM1, FD2 as well as the interactions CWM1 × time of decomposition, CWM2 × time of
391
decomposition and FD2 × time of decomposition (Table 3). Increasing CWM1 scores
392
(correlated mainly to decreasing phenolic concentration) were related to higher fungal diversity,
393
except after 320 days of decomposition (CWM1 × time of decomposition interaction, Table 3).
394
Increasing CWM2 scores (mainly correlated to increasing values of C:N and C:P ratios) were
395
related to higher fungal diversity after 50 and 100 days of decomposition (CWM2 × time of
decomposition interaction, Table 3). The relationship between FD2 and fungal diversity
397
opposed to that observed with bacterial diversity: increasing FD2 scores (i.e. correlated mainly
398
to decreasing C, terpen and C:N dissimilarities) were related to lower fungal diversity, except
399
after 320 days of decomposition (FD2 × time of decomposition interaction, Table 3; Fig. 5).
400
The relationships between the dynamic of fungal diversity during litter decomposition
401
and both CWM1 and FD2 values were confirmed by similar relationships with fungal
402
communities’ turnover rate (i.e. negative correlation of fCTR with CWM1 and positive
403
correlation of fCTR with FD2; Table 4).
404 405
4. Discussion 406
In line with our first hypothesis, microbial community’s changes were important across
407
decomposition time. While the fingerprinting methods used are likely to detect DNA of living
408
microorganisms and relic DNA that is not fully degraded during the experiment (Carini et al., 409
2017), our result is consistent with previous studies on the seasonal variation of microbial
410
communities, reporting that variations in soil moisture, temperature or leaf litter chemistry
411
during decomposition were most likely causes of changes in microbial communities (Snajdr et 412
al., 2011; Voriskova et al., 2014; Lopez-Mondejar et al., 2015; Purahong et al., 2015). The
413
bacterial community showed a faster dynamic and reached a higher diversity than the fungal
414
community, which confirms previous studies (Baldrian et al., 2012; Urbanova et al., 2015;
415
Santonja et al., 2017a). Interestingly, we observed that the community heterogeneity among
416
litter mixtures remained constant along the decomposition process for fungi, while it gradually
417
disappeared for bacteria (Supplementary Fig. S3). This finding supports the idea that the rapid
418
establishment of bacterial diversity is driven by the availability of simple compounds at early
419
decomposition stages (Moorhead and Sinsabaugh, 2006); then, simple compounds decrease in
420
quantity to the advantage of recalcitrant compounds, which triggers selective changes in the
bacterial decomposer community. Comparatively, the fungal decomposer community showed
422
an apparently lower diversity that gradually established to its maximum value at later
423
decomposition stages. These results suggest that diversification of the fungal decomposer
424
community at advanced litter decomposition stages relies on competition for recalcitrant
425
compounds utilization and to late colonization of the remaining leaf tissue (Moorhead and 426
Sinsabaugh, 2006).
427
In agreement with our second hypothesis, microbial diversity increased with litter
428
species richness. Previous studies have provided evidence that microbial biomass and diversity
429
respond positively to litter mixing (Blair et al., 1990; Bardgett and Shine, 1999; Chapman and 430
Newman, 2010; Santonja et al., 2017a), with differences in litter properties causing resource
431
diversification and habitat heterogeneity for microbial decomposers (Tilman et al., 1997;
432
Hooper and Vitousek, 1998; Hättenschwiler et al., 2011). Unlike Santonja et al. (2017a) who
433
reported that only fungal diversity increased after one year of litter decomposition in a
434
Mediterranean oak shrubland, here we observed that both bacterial and fungal diversities
435
increased during the process in the studied Mediterranean oak forest. We also clearly
436
demonstrated that the litter diversity effects are mediated by litter species composition rather
437
than litter species richness, highlighting the importance of litter species identity in litter
438
mixtures as a driver of microbial community diversity. We partially confirmed our hypothesis
439
that microbial responses to litter species diversity (both composition and richness) decrease
440
with decomposition time. Because it is generally assumed that initial differences in litter quality
441
among different plant species converge to similar quality during litter decomposition (e.g.
442
Moore et al., 2005; Preston et al., 2009), we expected to observe greater litter diversity control
443
of microbial communities during the early stages of decomposition. Interestingly, litter
444
diversity effects varied during the experiment but were not restricted to the early decomposition
445
stages.
In line with our third hypothesis, microbial community proxies were sensitive to the
447
litter species identity, as the presence of the four plant species affected - positively or negatively
448
- microbial diversities. Previous studies also highlighted the importance of tree species identity
449
as drivers of microbial communities, rather than changes in tree species richness (Scheibe et 450
al., 2015; Urbanova et al., 2015). As for the litter diversity effect, the litter identity effect on
451
microbial communities was irregular across decomposition times. Interestingly, the positive
452
effects of Q. pubescens on both bacterial and fungal diversities remained constant during all the
453
decomposition process. Since Q. pubescens is the dominant tree in the studied Mediterranean
454
oak forest, microorganisms could be well adapted to colonize and degrade this litter type. A.
455
monspessulanum enhanced sporadic bacterial diversity, but showed a noticeable effect on 456
microbial community dissimilarities, suggesting an important contribution on bacterial
457
community composition. This effect is probably related to high contents of N and P
458
(Supplementary Table S1) that are generally limiting nutrients in the soil and would be mostly
459
favorable to heterotrophic bacterial decomposers (Cleveland and Liptzin 2007; Mooshammer
460
et al., 2014). C. coggygria expressed negative effects on both bacterial and fungal diversities
461
only at the earliest decomposition stage, which then reverted to a positive effect at later
462
decomposition stages. This could be attributed to its strong initial phenolic content
463
(Supplementary Table S1) that was shown to affect microbial colonization of leaf litter (Chomel 464
et al., 2014) and is later on rapidly lixiviated (73% phenolic content loss after 100 days of
465
decomposition; Santonja et al., 2015). As the alien species of the study, P. halepensis is the 466
only coniferous species among the four studied woody-plant and is characterized by the highest
467
terpene content. Its presence in the litter mixtures noticeably enhanced fungal diversity until
468
later decomposition stages (although this effect decreased during the experiment; Fig. 3g) and
469
also showed striking effects on fungal community dissimilarities. These results suggest that
470
terpenes favor fungal decomposer diversity. Interestingly the effect of Q. pubescens
superimposed to the effects of P. halepensis leading to four distinct fungal communities
472
(Supplementary Fig. S5h). Overall, the fungal community composition showed essentially
473
more susceptibility to the identity of plant species present in the leaf litter mixtures than the
474
bacterial community composition (Supplementary Fig. S4), stressing the tight and specialist
475
relationship between plant species and fungal decomposer community, compared to the more
476
relaxed and generalist relationship with bacterial decomposer community (Moorhead and 477
Sinsabaugh, 2006).
478
In line with our fourth hypothesis, both mass-ratio (measured through community
479
weighted mean (CWM) of litter traits) and niche complementarity (measured through
480
functional dissimilarity (FD) of litter traits) hypotheses contributed to the litter diversity effects
481
on microbial decomposer communities, with a greater relative importance of the niche
482
complementary compared to the mass ratio hypothesis. According to the niche complementarity
483
hypothesis, litter mixtures with contrasting litter quality improve the availability of different
484
resources for decomposers (Tilman et al., 1997; Hooper and Vitousek, 1998; Schimel and 485
Hättenschwiler, 2007). But, surprisingly, increasing functional dissimilarity of litter traits -
486
hence resource availability, was unfavorable to the bacterial community turnover rate and
487
diversity while conversely, it was beneficial to the fungal community turnover rate and diversity
488
in the studied Mediterranean oak forest. In contrast to bacterial diversity, the first and second
489
components of the CWM PCA were both associated to fungal diversity, highlighting the
490
contribution of the traits mass ratio as additional drivers of fungal diversity. Decreasing mean
491
phenolic concentration of litter mixtures (i.e. CWM1) was related to higher turnover rate of the
492
fungal community, affecting fungal diversity until 250 days of decomposition. This suggests
493
that fungal communities are more sensitive to phenolics than bacterial communities.
494
Interestingly, increasing mean C:N ratio value of litter mixtures (i.e. CWM2) was related to
495
higher fungal diversity after 50 and 100 days of decomposition. The C:N ratio of bacterial
biomass is expected to vary between 3 and 6 while the C:N ratio of fungal biomass is expected
497
to vary between 5 and 15 (McGill et al., 1981). Subsequently, fungal communities are expected
498
to have lower N requirement than bacteria (Güsewell and Gessner, 2009), and thus, being less
499
N limited, they would be able to colonize and develop on poor-quality litter at early
500 decomposition stages. 501 502 5. Conclusion 503
Our results from a field experiment clearly demonstrated that potential shifts in plant
504
species diversity and associated litter traits may have strong cascading impacts on microbial
505
decomposer communities in a Mediterranean oak forest. Both bacterial and fungal communities
506
were influenced by litter species diversity, litter identity and litter functional traits. However,
507
the intensity and the direction of these effects varied strongly during decomposition. Litter
508
diversity effects were mediated by litter species composition rather than litter species richness,
509
highlighting the importance of litter species identity (and associated litter traits) as driver of
510
microbial communities. We also underscored the importance of Quercus pubescens (i.e. the
511
dominant tree species of the studied oak forest) and Pinus halepensis (i.e. an alien tree species
512
that may become more frequent in the studied oak forest in response to climate change) in
513
structuring microbial communities. Both community weighted mean (CWM) litter traits
(mass-514
ratio hypothesis) and functional dissimilarity (FD) of litter traits (niche complementarity
515
hypothesis) contributed to litter diversity effects, with a greater relative importance of FD
516
compared to CWM, and with an overall stronger impact on fungal compared to bacterial
517
communities. Collectively, these findings also suggest that different aspects of litter diversity
518
control microbial communities during litter decomposition.
519 520
Acknowledgement 521
We thank Sylvie Dupouyet, Jean-Philippe Orts and Ilja Reiter for their contribution to
522
the set-up of the experiment and the field work, Caroline Lecareux, Alexia Pailler and Germain
523
Boungou for their assistance to the chemical and microbial analyses, and the staff of the
524
“Plateforme Génomique du Génopole de Toulouse Midi-Pyrénées” for technical assistance
525
with the sequencing facilities. Funding was provided by the Centre National de la Recherche
526
Scientifique (CNRS) through the EC2CO-BIOEFECT action and the Agence Nationale pour la
527
Recherche (ANR) through the project SecPriMe2 (ANR-12-BSV7-0016-01). We also thank the
528
French Region PACA and Europe for PhD grant attributed to Mathieu Santonja. Finally, we
529
gratefully acknowledge the program MISTRALS (Mediterranean Integrated STudies at
530
Regional And Local Scales), particularly the axe BioDivMeX, and the LabEx OT-Med (no
531
ANR-11-LABX-0061) funded by the «Investissements d’Avenir» program of the French
532
National Research Agency through the A*MIDEX project (no ANR-11-IDEX-0001-02).
533 534
Conflict of interest: The authors declare that they have no conflict of interest. 535
536
References 537
Adams, R.P., 2007. Identification of essential oil components by gas chromatography / mass
538
spectrometry, 4th ed. Allured Publishing Corporation, Carol Stream.
539
Amaral, J.A., Knowles, R., 1998. Inhibition of methane consumption in forest soils by
540
monoterpenes. Journal of Chemical Ecology 24, 723-734.
541
Aponte, C., Garcia, L.V., Maranon, T., 2013. Tree species effects on nutrient cycling and soil
542
biota: a feedback mechanism favouring species coexistence. Forest Ecology and Management
543
309, 36-46.
544
Baize, D., Girard, M.C., 1998. A sound reference base for soils: the « référentiel pédologique ».
545
INRA, Paris.
Baldrian, P., Kolarik, M., Stursova, M., Kopecky, J., Valaskova, V., Vetrovsky, T., Zifcakova,
547
L., Snajdr, J., Ridl, J., Vlcek, C., Voriskova, J., 2012. Active and total microbial communities
548
in forest soil are largely different and highly stratified during decomposition. ISME Journal,
549
6, 248.
550
Barantal, S., Schimann, H., Fromin, N., Hättenschwiler, S., 2014. C, N and P fertilization in an
551
Amazonian rainforest supports stoichiometric dissimilarity as a driver of litter diversity effects
552
on decomposition. Proceedings of the Royal Society of London Series B Biological Sciences,
553
281, 20141682.
554
Bardgett, R.D., 2005. The biology of soil: a community and ecosystem approach. Oxford
555
University Press, Oxford.
556
Bardgett, R.D., Shine, A., 1999. Linkages between plant litter diversity, soil microbial biomass
557
and ecosystem function in temperate grasslands. Soil Biology and Biochemistry 31, 317-321.
558
Bede-Fazekas, A., Horvath, L., Kocsis, M., 2014. Impact of climate change on the potential
559
distribution of Mediterranean pines. Quarterly Journal of the Hungarian Meteorological
560
Service 118, 41-52.
561
Blair, J.M., Parmelee, R.W., Beare, M.H., 1990. Decay-rates, nitrogen fluxes, and decomposer
562
communities of single-species and mixed-species foliar litter. Ecology 71, 1976-1985.
563
Boer, W., Folma, L.B., Summerbell, R.C., Boddy, L., 2005. Living in a fungal world: impact
564
of fungi on soil bacterial niche development. FEMS Microbiology Reviews 29, 795-811.
565
Botta Dukát, Z., 2005. Rao’s quadratic entropy as a measure of functional diversity based on
566
multiple traits. Journal of Vegetation Science, 16, 533-540.
567
Brockett, B.F.T., Prescott, C.E., Grayston, S.J., 2012. Soil moisture is the major factor
568
influencing microbial community structure and enzyme activities across seven biogeoclimatic
569
zones in western Canada. Soil Biology and Biochemistry 44, 9-20.
Buée, M., De Boer, W., Martin, F., Van Overbeek, L., Jurkevitch, E., 2009. The rhizosphere
571
zoo: an overview of plant-associated communities of microorganisms, including phages,
572
bacteria, archaea, and fungi, and of some of their structuring factors. Plant and Soil 321,
189-573
212.
574
Calderon, F.J., Jackson, L.E., Scow, K.M., Rolston, D.E., 2001. Short-term dynamics of
575
nitrogen, microbial activity, and phospholipid fatty acids after tillage. Soil Science Society
576
American Journal 65, 118-126.
577
Carini, P., Marsden, P.J., Leff, J.W., Morgan, E.E., Strickland, M.S., Fierer, N., 2017. Relic
578
DNA is abundant in soil and obscures estimates of soil microbial diversity. Nature
579
Microbiology 2, 16242.
580
Chapman, S.K., Newman, G.S., 2010. Biodiversity at the plant-soil interface microbial
581
abundance and community structure respond to litter mixing. Oecologia 162, 763-769.
582
Chomel, M., Fernandez, C., Bousquet-Mélou, A., Gers, C., Monnier, Y., Santonja, M.,
583
Gauquelin, T., Gros, R., Lecareux, C., Baldy, V., 2014. Secondary metabolites of Pinus
584
halepensis alter decomposer organisms and litter decomposition during afforestation of 585
abandoned agricultural zones. Journal of Ecology 102, 411-424.
586
Chomel, M., Guittonny‐Larchevêque, M., Fernandez, C., Gallet, C., DesRochers, A., Paré, D.,
587
Jackson, B.G., Baldy, V., 2016. Plant secondary metabolites: a key driver of litter
588
decomposition and soil nutrient cycling. Journal of Ecology 104, 1527-1541.
589
Cleveland, C.C., Liptzin, D., 2007. C:N:P stoichiometry in soil: is there a ‘‘Redfield ratio’’ for
590
the microbial biomass? Biogeochemistry 85, 235-252.
591
de Graaff, M.A., Classen, A.T., Castro, H.F., Schadt, C.W., 2010. Labile soil carbon inputs
592
mediate the soil microbial community composition and plant residue decomposition rates.
593
New Phytologist 188, 1055-1064.
Diaz, S., Cabido, M., 2001. Vive la difference: plant functional diversity matters to ecosystem
595
processes. Trends in Ecology and Evolution 16, 649-655.
596
Diaz, S., Lavorel, S., De Bello, F., Quetier, F., Grigulis, K., Robson, T.M., 2007. Incorporating
597
plant functional diversity effects in ecosystem service assessments. Proceedings of the
598
National Academy of Sciences of the USA 104, 20684-20689.
599
Fierer, N., Schimel, J.P., Cates, R.G., Zou, J., 2001. Influence of balsam poplar tannin fractions
600
on carbon and nitrogen dynamics in Alaskan taiga floodplain soils. Soil Biology and
601
Biochemistry 33, 1827-1839.
602
Folin, O., Denis, W., 1915. A colorimetric method for the determination of phenols (and phenol
603
derivates) in urine. Journal of Biological Chemistry 22, 305-308.
604
Gardes, M., Bruns, T.D., 1993. ITS primers with enhanced specificity for basidiomycetes‐
605
application to the identification of mycorrhizae and rusts. Molecular Ecology 2, 113-118.
606
Garnier, E., Cortez, J., Billès, G., Navas, M.L., Roumet, C., Debussche, M., Laurent, G.,
607
Blanchard, A., Aubry, D., Bellmann, A., Neill, C., Toussaint, J.P., 2004. Plant functional
608
markers capture ecosystem properties during secondary succession. Ecology 85, 2630-2637.
609
Gartner, T.B., Cardon, Z.G., 2004. Decomposition dynamics in mixed-species leaf litter. Oikos
610
104, 230-246.
611
Gaucherel, C., Guiot, J., Misson, L., 2008. Changes of the potential distribution area of French
612
Mediterranean forests under global warming. Biogeosciences 5, 1493-1504.
613
Grayston, S.J., Wang, S.Q., Campbell, C.D., Edwards, A.C., 1998. Selective influence of plant
614
species on microbial diversity in the rhizosphere. Soil Biology and Biochemistry 30, 369-378.
615
Grime, J.P., 1998. Benefits of plant diversity to ecosystems: immediate, filter and founder
616
effects. Journal of Ecology 86, 902-910.
617
Güsewell, S., Gessner, M.O., 2009. N:P ratios influence litter decomposition and colonization
618
by fungi and bacteria in microcosms. Functional Ecology 23, 211-219.
Handa IT, Aerts R, Berendse F, Berg MP, Bruder A, Butenschoen O, … Hättenschwiler S.
620
2014. Consequences of biodiversity loss for litter decomposition across biomes. Nature
621
509:218-221.
622
Hashoum, H., Santonja, M., Gauquelin, T., Saatkamp, A., Gavinet, J., Greff, S., Lecareux, C.,
623
Fernandez, C., Bousquet-Mélou, A., 2017. Biotic interactions in a Mediterranean oak forest:
624
role of allelopathy along phenological development of woody species. European Journal of
625
Forest Research 136, 699-710.
626
Hättenschwiler, S., Tiunov, A.V., Scheu S., 2005. Biodiversity and litter decomposition in
627
terrestrial ecosystems. Annual Review of Ecology, Evolution, and Systematics 36, 191-218.
628
Hättenschwiler, S., Fromin, N., Barantal S., 2011. Functional diversity of terrestrial microbial
629
decomposers and their substrates. Comptes Rendus Biologies 334, 393-402.
630
Hilaire C., Orts J.P., Boer M., Gauquelin T. 2012. Le domaine de l’Observatoire de
Haute-631
Provence (OHP): hermas et chênaie pubescente, du XVIIIe siècle à nos jours. Courrier
632
scientifique du Parc naturel régional du Luberon et de la Réserve de biosphère Luberon-Lure
633
11, 8-21.
634
Hooper, D.U., Vitousek, P.M., 1998. Effects of plant composition and diversity on nutrient
635
cycling. Ecological Monographs 68, 121-149.
636
IUSS Working Group WRB, 2006. World reference base for soil resources 2006 - World Soil
637
Resources Reports No. 103. FAO, Rome.
638
Kainulainen, P., Holopainen, T., Holopainen, J.K., 2003. Decomposition of secondary
639
compounds from needle litter of Scots pine grown under elevated CO2 and O3. Global Change 640
Biology 9, 295-304.
641
Kraus, T.E., Dahlgren, R.A., Zasoski, R.J., 2003. Tannins in nutrient dynamics of forest
642
ecosystems-a review. Plant and Soil 256, 41-66.
Lalor, B.M., Cookson, W.R, Murphy, D.V., 2007. Comparison of two methods that assess soil
644
community level physiological profiles in a forest ecosystem. Soil Biology and Biochemistry
645
39, 454-462.
646
Leloup, J., Baude, M., Nunan, N., Meriguet, J., Dajoz, I., Le Roux, X., Raynaud, X., 2018.
647
Unravelling the effects of plant species diversity and aboveground litter input on soil bacterial
648
communities. Geoderma 317, 1-7.
649
Liu, W.T., Marsh, T.L., Heng, H.C., Forney, L.J., 1997. Characterization of microbial diversity
650
by determining terminal restriction fragment length polymorphisms of genes encoding 16S
651
rRNA. Applied and Environmental Microbiology 63, 4516-4522.
652
Lopez-Mondejar, R., Voriskova, J., Vetrovsky, T., Baldrian, P., 2015. The bacterial community
653
inhabiting temperate deciduous forests is vertically stratified and undergoes seasonal
654
dynamics. Soil Biology and Biochemistry 87, 43-50.
655
Loreau, M., Naeem, S., Inchausti, P., Bengtsson, J., Grime, J.P., Hector, A., Hooper, D.U.,
656
Huston, M.A., Raffaeli, D., Schmid, B., Tilman, D., Wardle, D.A., 2001. Biodiversity and
657
ecosystem functioning: Current knowledge and future challenges. Science 294, 804-808.
658
McGill, W.B., Hunt, H.W., Woodmansee, R.G., Reuss, J.O., 1981. Phoenix, a model of the
659
dynamics of carbon and nitrogen in grassland soils. Ecological Bulletins 33:49-115.
660
Moore TR, Trofymow AJ, Siltanen M, Prescott C, CIDET Working Group. 2005. Litter
661
decomposition and C, N and P dynamics in upland forest and peatland sites, central Canada.
662
Canadian Journal of Forest Research 35:133-142.
663
Moorhead, D.L., Sinsabaugh, R.L., 2006. A theoretical model of litter decay and microbial
664
interaction. Ecological Monographs 76, 151-174.
665
Mooshammer, M., Wanek, W., Zechmeister-Boltenstern, S., Richter, A., 2014. Stoichiometric
666
imbalances between terrestrial decomposer communities and their resources: mechanisms and
667
implications of microbial adaptations to their resources. Frontiers in Microbiology 5, 22.
Peñuelas, J., Estiarte, M., Kimball, B.A., Idso, S.B., Pinter, P.J., Wall, G.W., Garcia, R.L.,
669
Hansaker, D.J., LaMorte, R.L., Hendrix, D.L., 1996. Variety of responses of plant phenolic
670
concentration to CO2 enrichment. Journal of Experimental Botany 47, 1463-1467. 671
Petchey, O.L., Gaston, K.J., 2006. Functional diversity: back to basics and looking forward.
672
Ecology Letters 9, 741-758.
673
Prescott, C.E., Grayston, S.J., 2013. Tree species influence on microbial communities in litter
674
and soil: Current knowledge and research needs. Forest Ecology and Management 309,
19-675
27.
676
Preston CM, Nault JR, Trofymow A, Smyth C, CIDET Working Group. 2009. Chemical
677
changes during 6 years of decomposition of 11 litters in some Canadian forest sites. Part 1.
678
Elemental composition, tannins, phenolics, and proximate fractions. Ecosystems
12:1053-679
1077.
680
Purahong, W., Kapturska, D., Pecyna, M.J., Jariyavidyanont, K., Kaunzner, J., Juncheed, K.,
681
Uengwetwanit, T., Rudloff, R., Schulz, E., Hofrichter, M., Schloter, M., Kruger, D., Buscot,
682
F., 2015. Effects of forest management practices in temperate beech forests on bacterial and
683
fungal communities involved in leaf litter degradation. Microbial Ecology 69, 905-913.
684
Quézel, P., Médail, F., 2003. Ecologie et biogéographie des forêts du bassin Méditerranéen.
685
Elsevier, Paris.
686
Ranjard, L., Poly, F., Lata, J.C., Mougel, C., Thioulouse, J., Nazaret, S., 2001. Characterization
687
of bacterial and fungal soil communities by automated ribosomal intergenic spacer analysis
688
fingerprints: biological and methodological variability. Applied Environmental Microbiology
689
67, 4479-4487.
690
Santonja, M., Baldy, V., Fernandez, C., Balesdent, J., Gauquelin, T., 2015. Potential shift in
691
plant communities with climate change in a Mediterranean Oak forest: consequence on
nutrients and secondary metabolites release during litter decomposition. Ecosystems 18,
1253-693
1268.
694
Santonja, M., Rancon, A., Fromin, N., Baldy, V., Hättenschwiler, S., Fernandez, C., Montes,
695
N., Mirleau, P., 2017a. Plant litter diversity increases microbial diversity and carbon and
696
nitrogen cycling in a Mediterranean shrubland. Soil Biology and Biochemistry 111, 124-134.
697
Santonja M., Fernandez C., Gers C., Proffit M., Gauquelin T., Reiter I., Cramer W., Baldy V.,
698
2017b. Plant litter mixture partly mitigates the negative effects of extended drought on soil
699
biota and litter decomposition in a Mediterranean oak forest. Journal of Ecology 105,
801-700
815.
701
Scheibe, A., Steffens, C., Seven, J., Jacob, A., Hertel, D., Leuschner, C., Gleixner, G., 2015.
702
Effects of tree identity dominate over tree diversity on the soil microbial community structure.
703
Soil Biology and Biochemistry 81, 219-227.
704
Schimel, J.P., Hättenschwiler, S., 2007. Nitrogen transfer between decomposing leaves of
705
different N status. Soil Biology and Biochemistry 39, 1428-1436.
706
Schimel, J., Balser, T.C., Wallenstein, M.D., 2007. Microbial stress-response physiology and
707
its implications for ecosystem function. Ecology 88, 1386-1394.
708
Shihan, A., Hättenschwiler, S., Milcu, A., Joly, F.X., Santonja, M., Fromin, N., 2017. Changes
709
in soil microbial substrate utilization in response to altered litter diversity and precipitation in
710
a Mediterranean shrubland. Biology and Fertility of Soils 53, 171-185.
711
Snajdr, J., Cajthaml, T., Valaskova, V., Merhautova, V., Petrankova, M., Spetz, P., Leppanen,
712
K., Baldrian, P., 2011. Transformation of Quercus petraea litter: successive changes in litter
713
chemistry are reflected in differential enzyme activity and changes in the microbial
714
community composition. FEMS Microbiology Ecology 75, 291-303.
715
Swift, M.J., Heal, O.W., Anderson, J.M., 1979. Decomposition in terrestrial ecosystems.
716
University of California press, Berkeley.